Tuva Tools v4.3.0
Released 10/13/2026 Latest
Tuva Tools 4.3 is a major feature release. New capabilities include map distance measurement, sampling with categorical attributes and proportions, multi-select annotation editing, card stacking, undo and redo in Insert Data, and spreadsheet-style autofill. Accessibility received a comprehensive update covering keyboard navigation, screen reader support, and focus management across multiple areas of the tool.
New Features
-
Map Enhancements:
Three new capabilities were added to map plots:
-
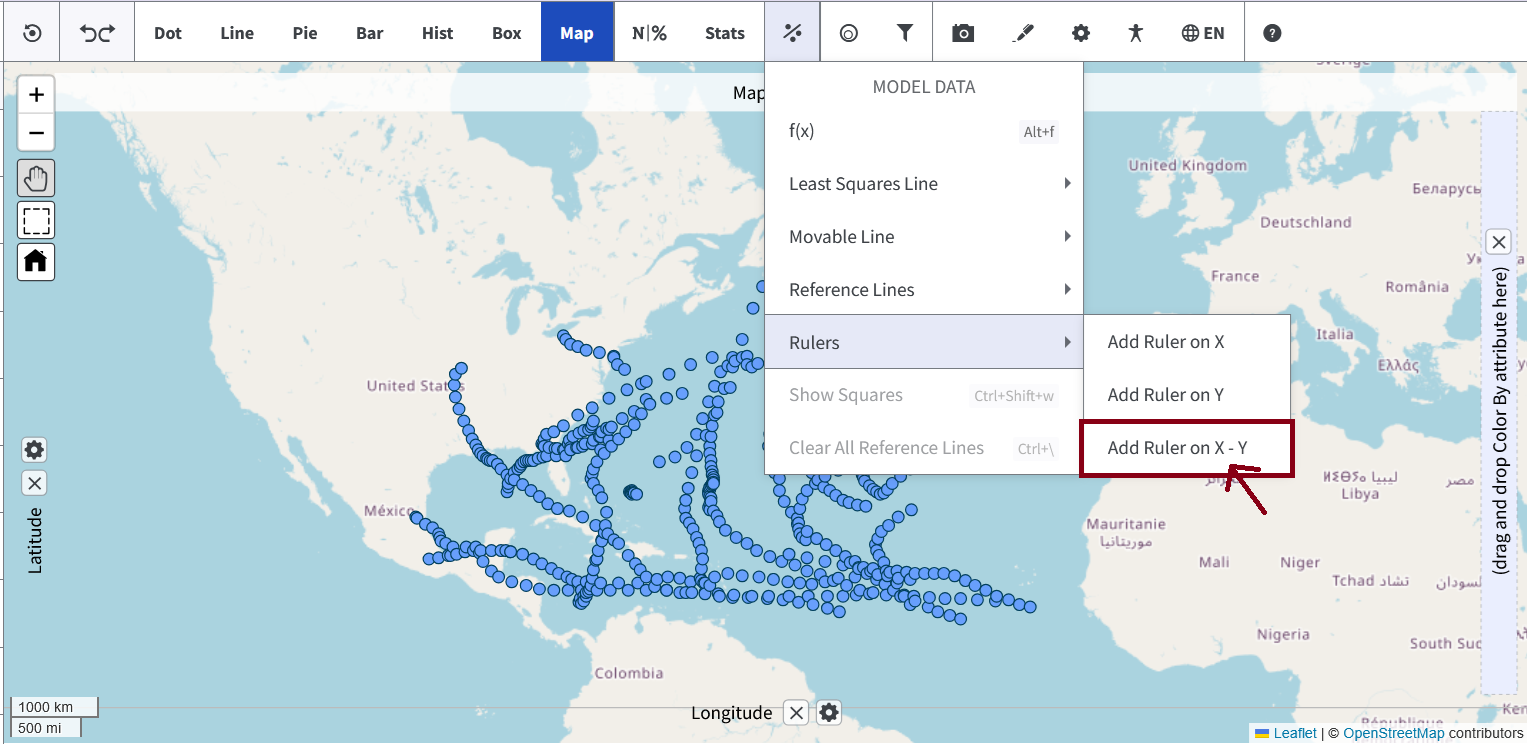
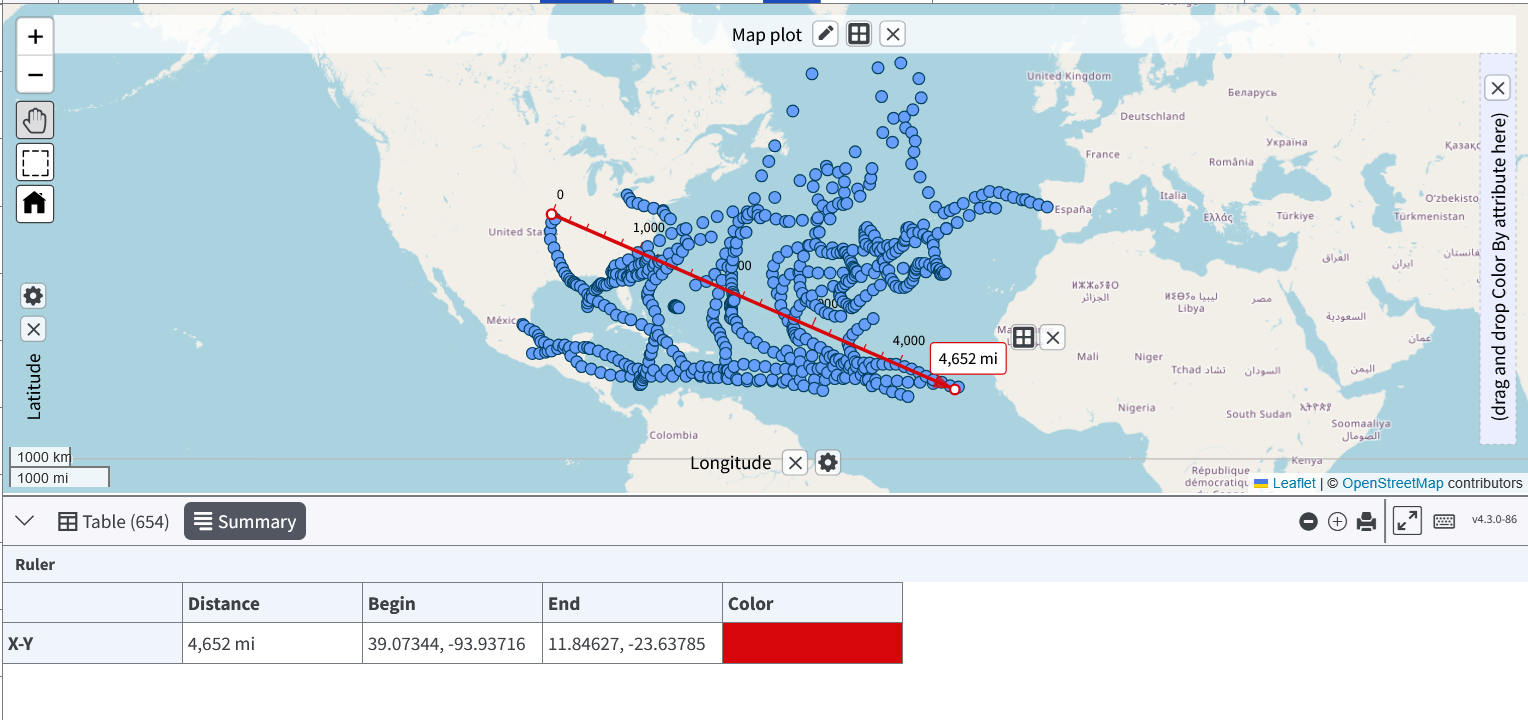
Distance Ruler: A new "Ruler on X-Y" option is now
available in the Map context menu. It places a draggable line between two points
and displays the straight-line distance in miles or kilometers, with major and
minor tick marks along the ruler. Drag either endpoint to reposition the
measurement, and change the ruler color from its context menu.
-
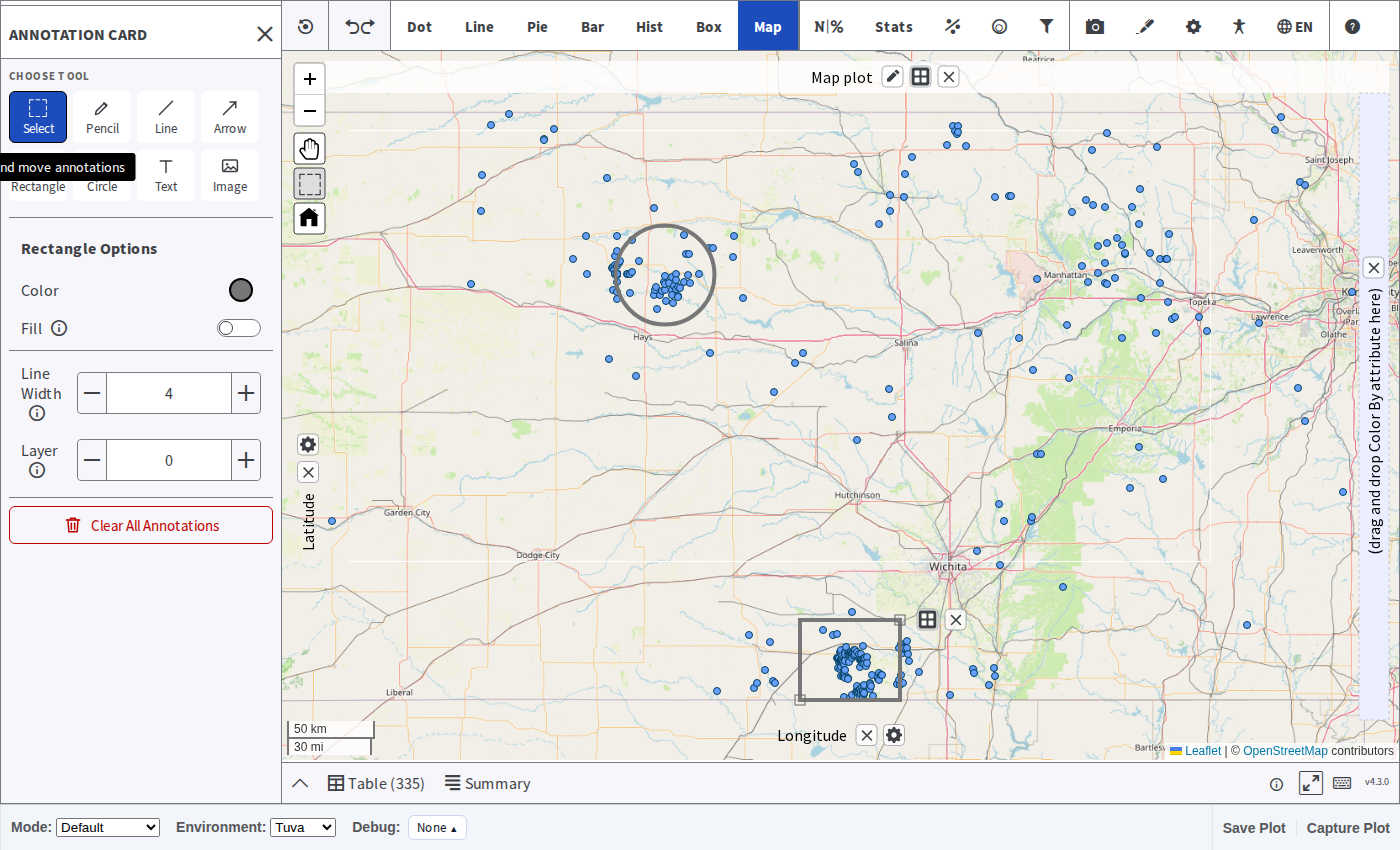
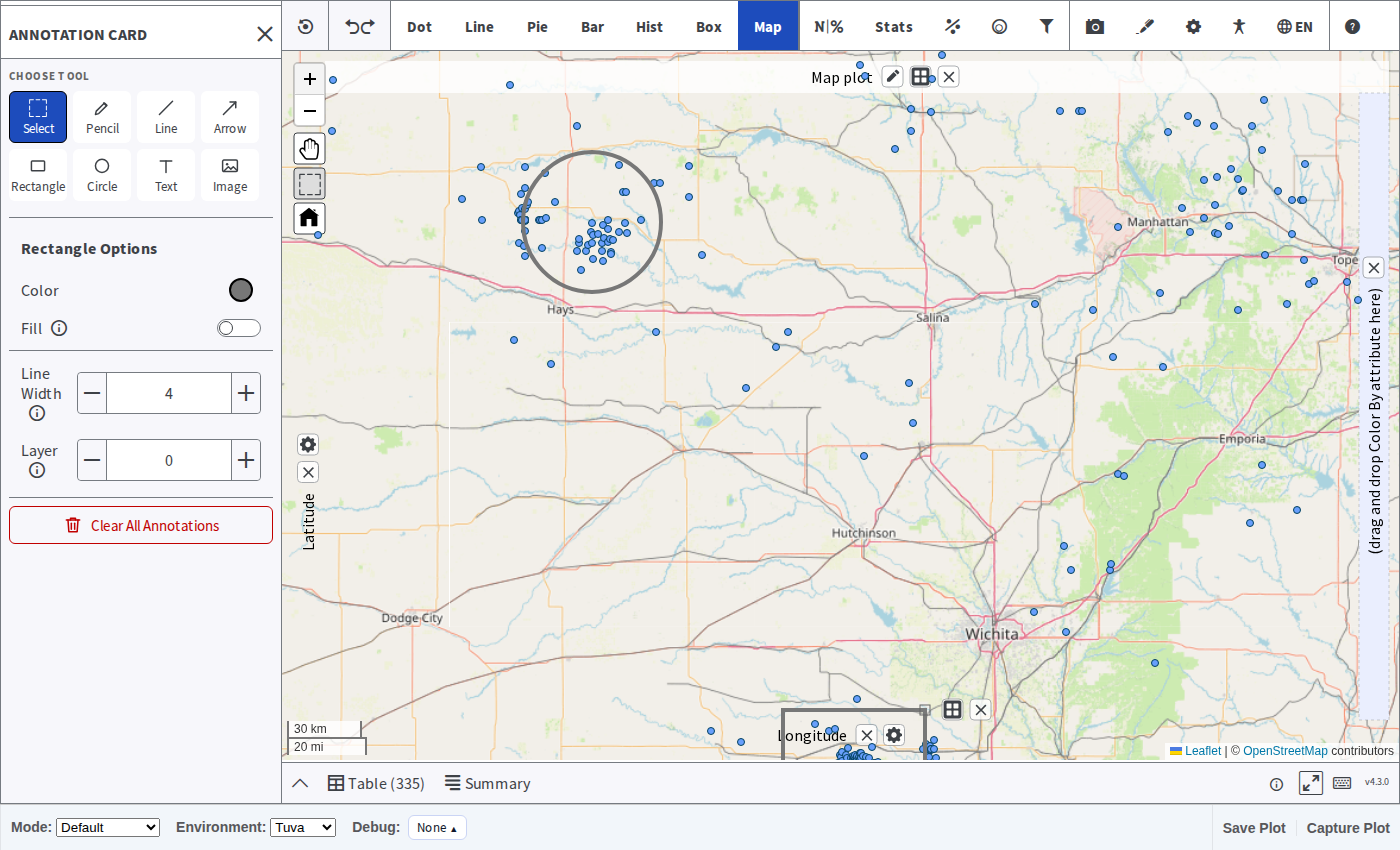
Annotations fixed to geographic position: Annotations such as
shapes and drawings now stay in their correct location on the map when you zoom or
pan. Previously, they shifted because they used screen pixel coordinates; they now
use latitude and longitude.
Annotations before Zoom
Annotations after Zoom
-
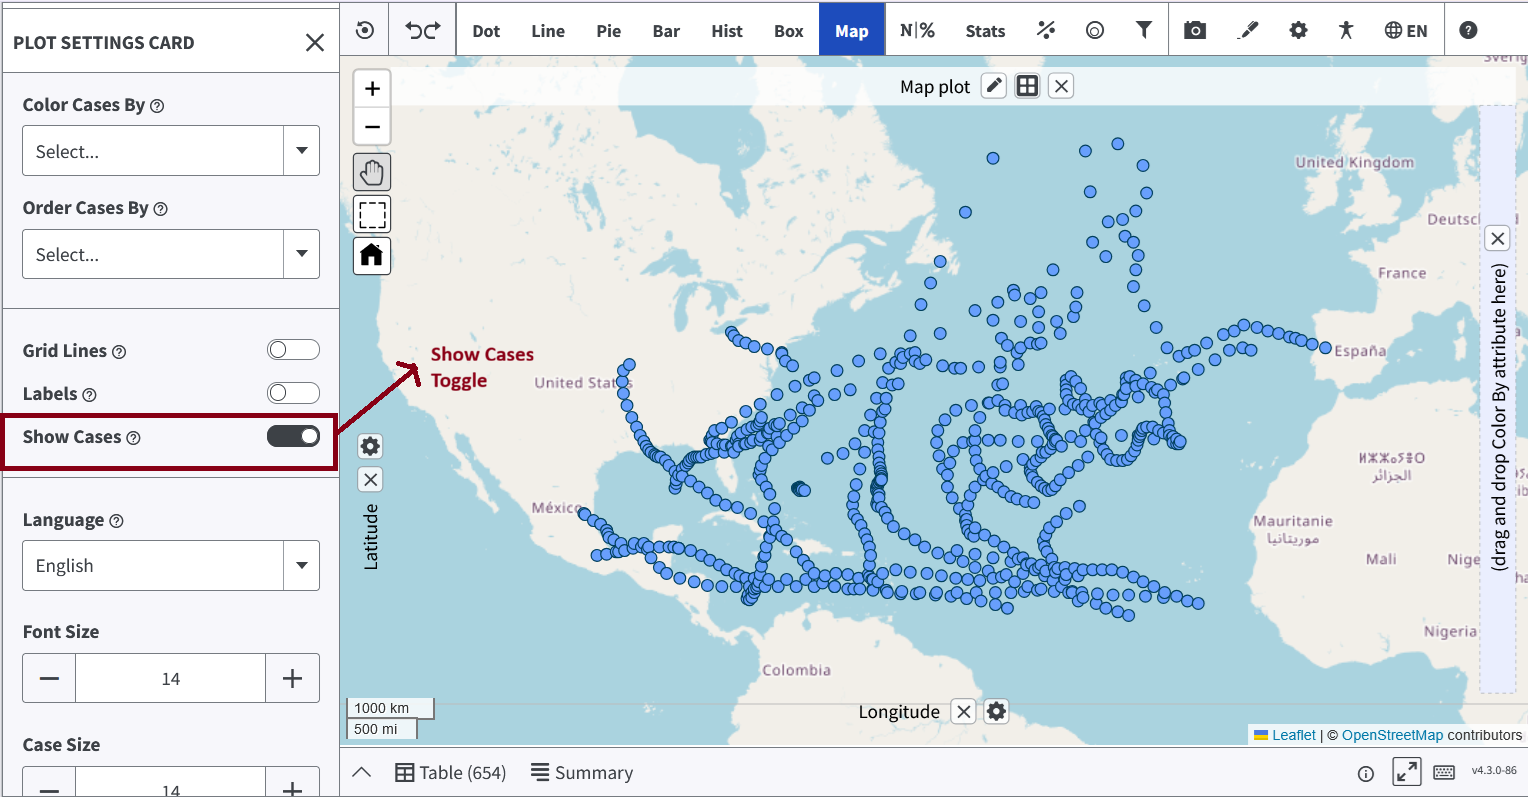
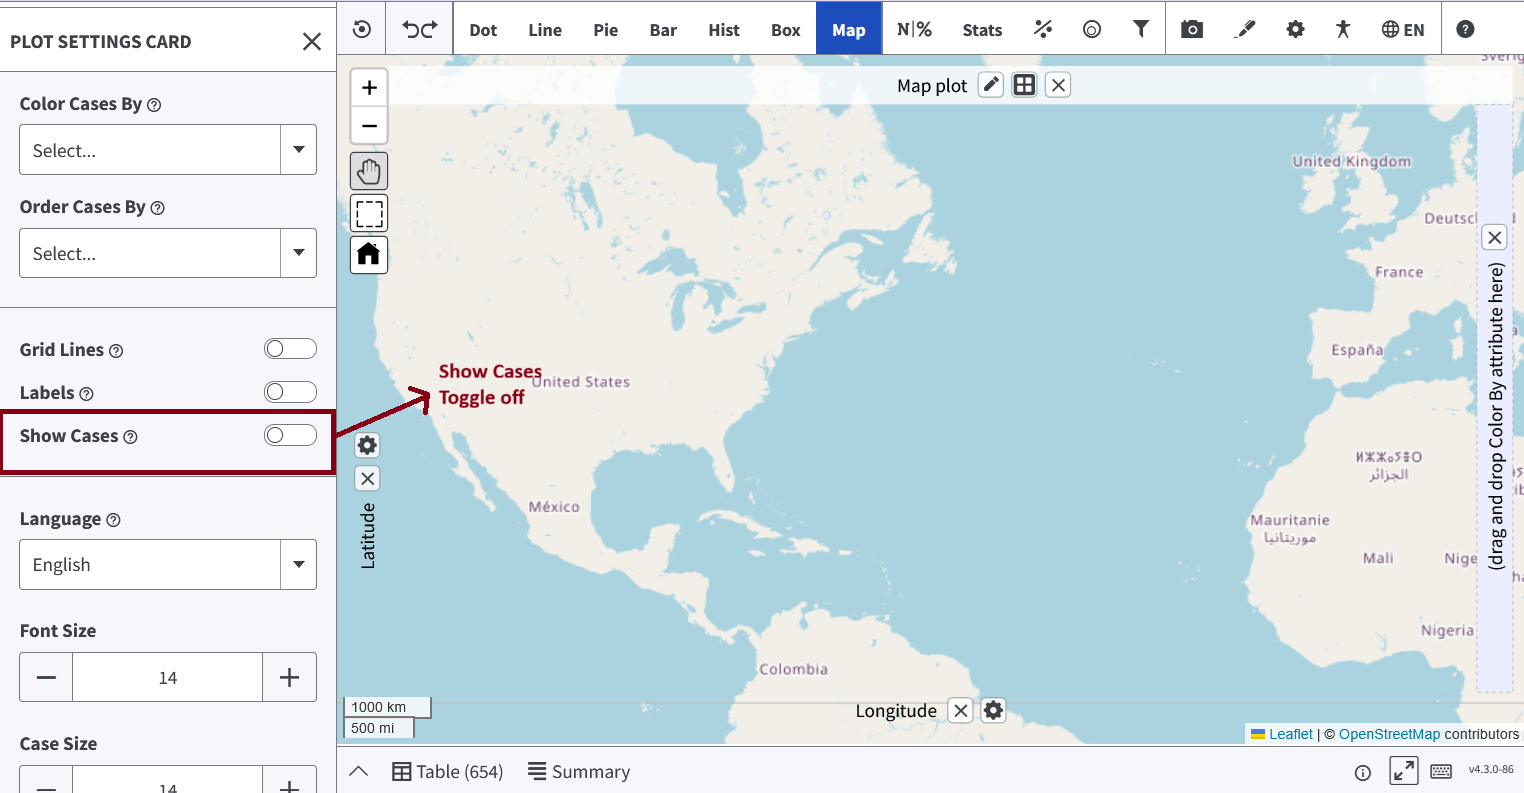
Show Cases Toggle (Authoring Tool): A "Show Cases"
toggle in Plot Settings is now available in the Authoring Tool. It is on by
default. Turning it off hides all data points, bars, or pie slices in any plot
type, including maps, making it possible to build activities that reveal data only
when intended.
Map with Cases Showing
Map with Cases Hidden
-
Distance Ruler: A new "Ruler on X-Y" option is now
available in the Map context menu. It places a draggable line between two points
and displays the straight-line distance in miles or kilometers, with major and
minor tick marks along the ruler. Drag either endpoint to reposition the
measurement, and change the ruler color from its context menu.
-
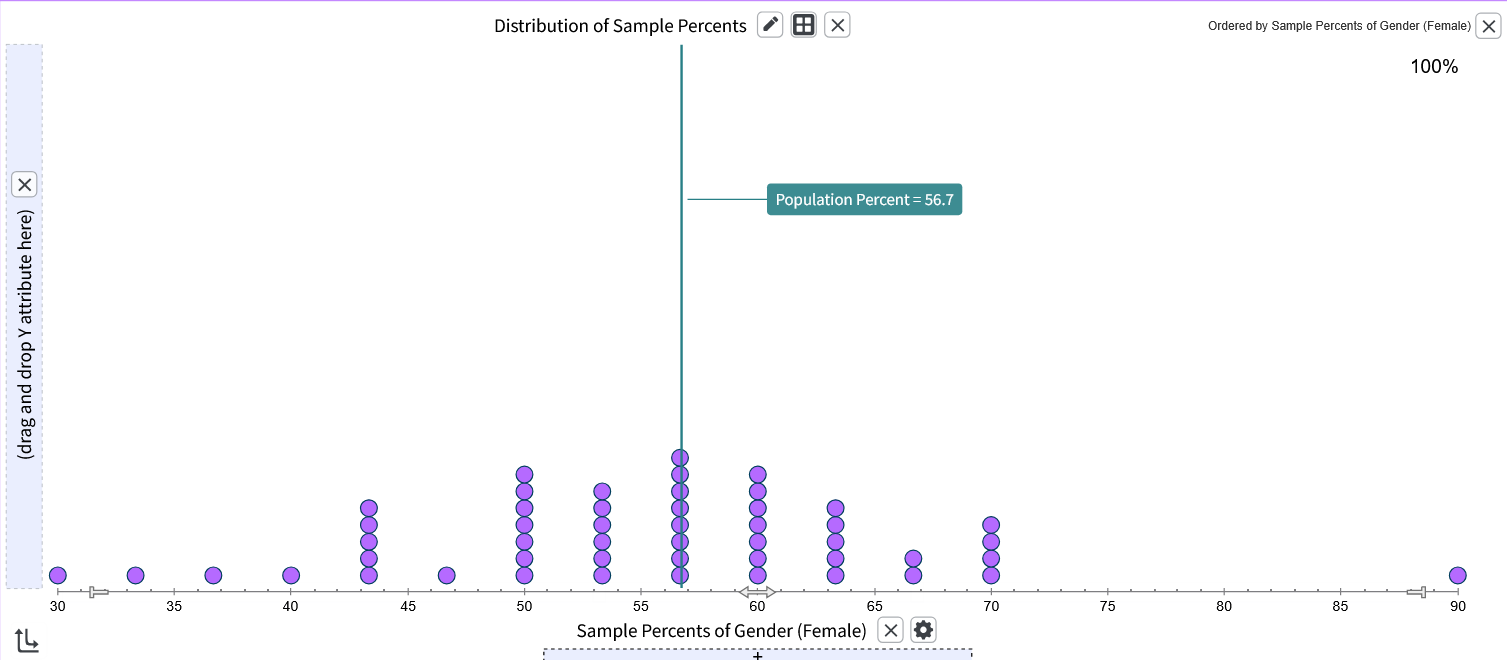
Sampling with Categorical Attributes:
The sampler now works with categorical attributes, enabling students to explore
proportions the same way they explore means and other numeric statistics. Here's the
workflow:
-
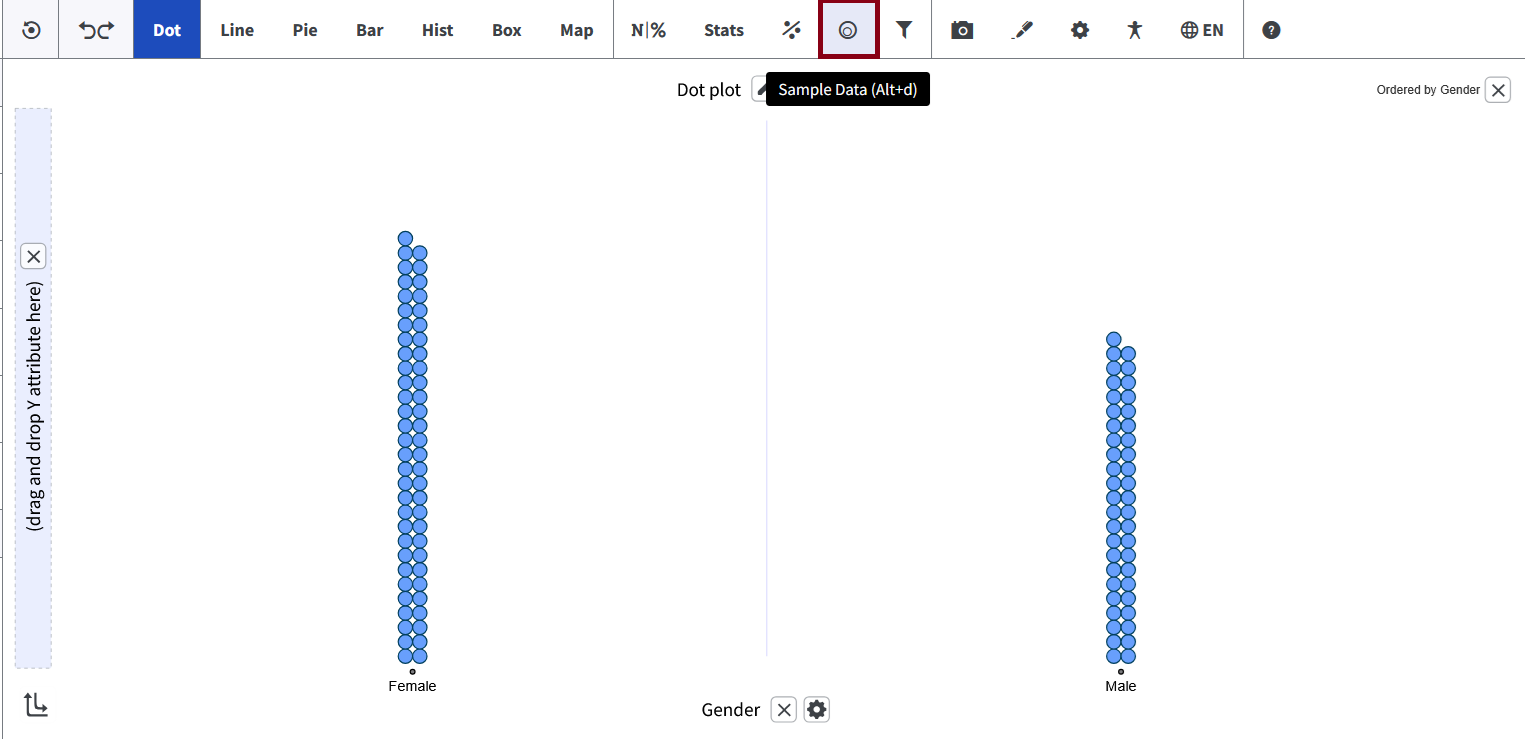
Drop a categorical attribute (such as Gender or Species) on an axis. The Sampling
menu becomes available.
-
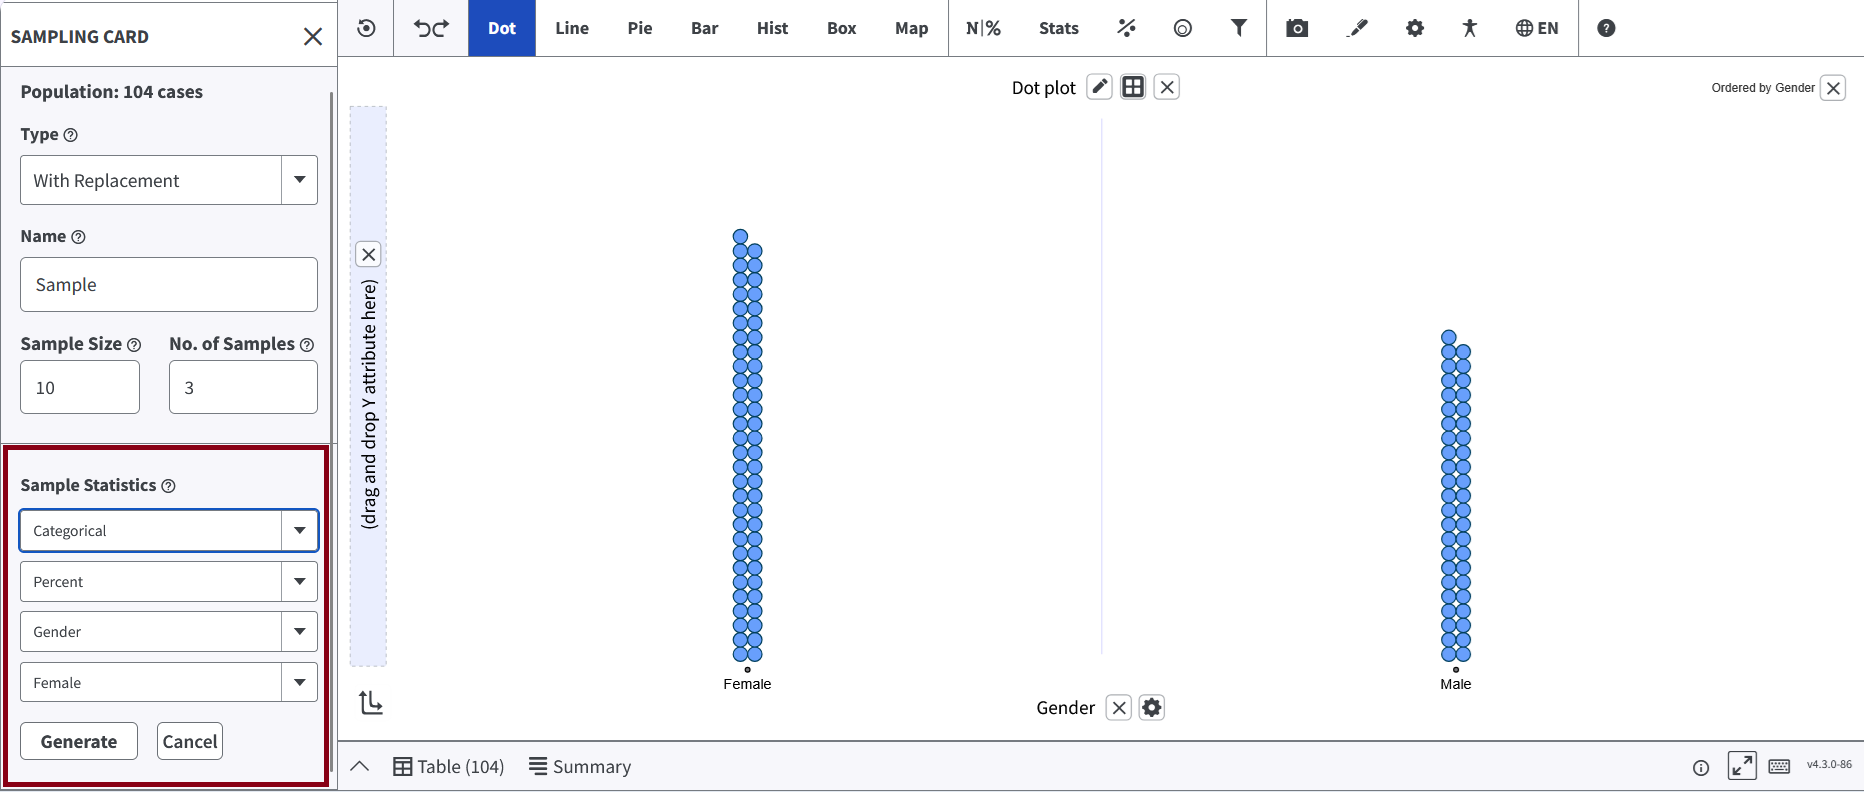
Open the Sampling Card. A new Attribute Type dropdown lets you switch between
Numerical and Categorical modes.
-
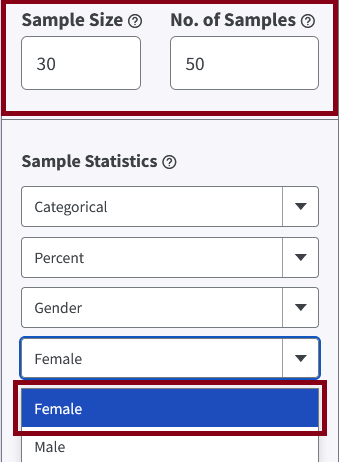
In Categorical mode, choose the category of interest (for example, "Female")
and set your sample size and number of samples.
-
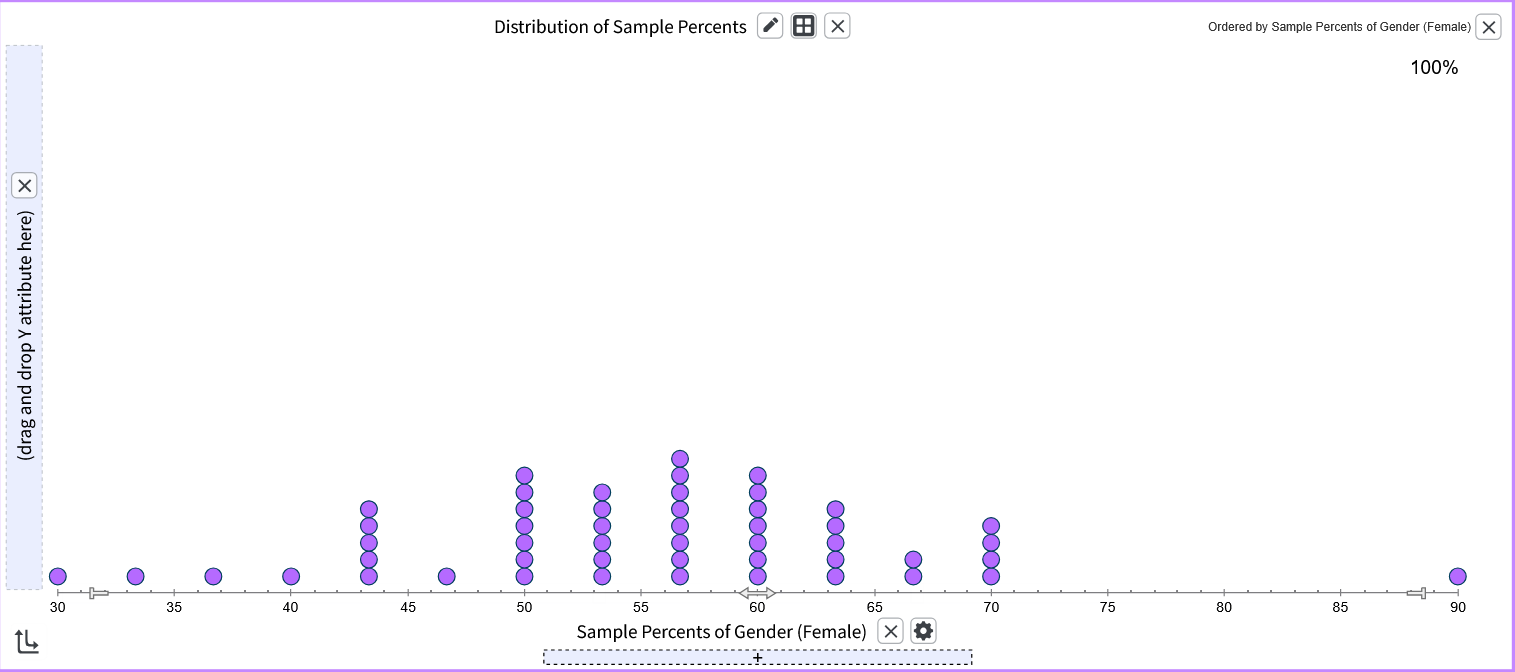
Click Generate. The tool draws samples and builds a distribution of sample
proportions, showing how that category's share varies from sample to sample.
-
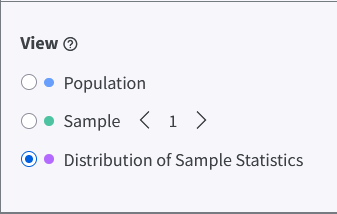
Population, Sample, and Distribution views all work the same as in numerical
sampling.
-
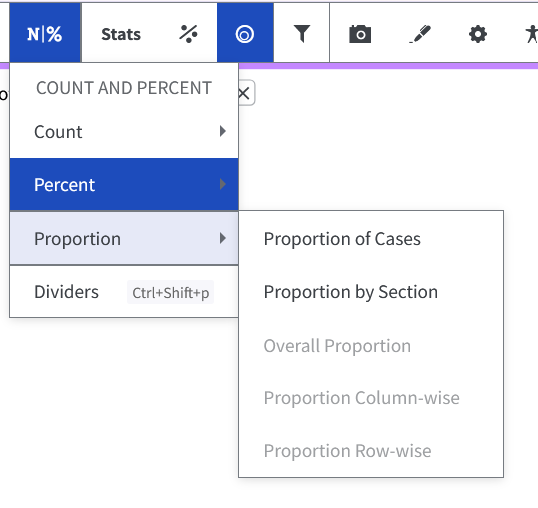
Three new Proportion statistics, Overall Proportion, Proportion Row-Wise, and
Proportion Column-Wise, are now available alongside the existing Percent options
in the N|% menu.
-
In the Stats menu, two new statistics called the Population Proportion and
Population Percent are added.
-
Drop a categorical attribute (such as Gender or Species) on an axis. The Sampling
menu becomes available.
-
Annotation Card:
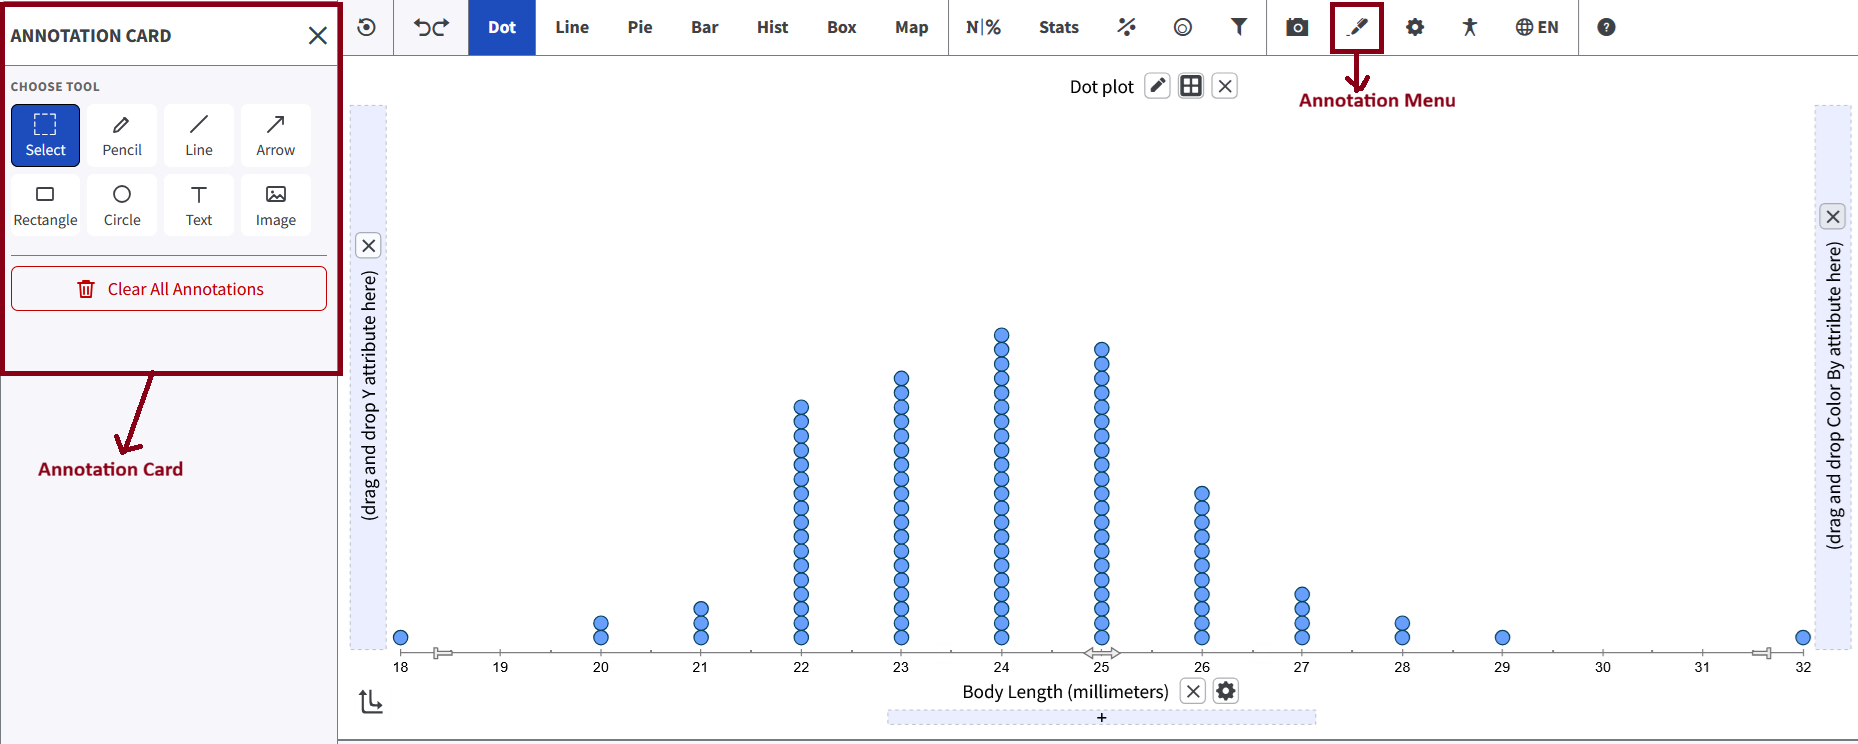
Annotation tools now live in a dedicated Annotation Card rather than a nested menu,
making them faster to access and use:
-
Opening the Annotation tab now shows a card on the left with all drawing tools, so
you no longer need to reopen the menu after each annotation.
-
Annotations stay selected after you draw or click them. You can immediately move,
resize, or edit a shape without having to re-select it.
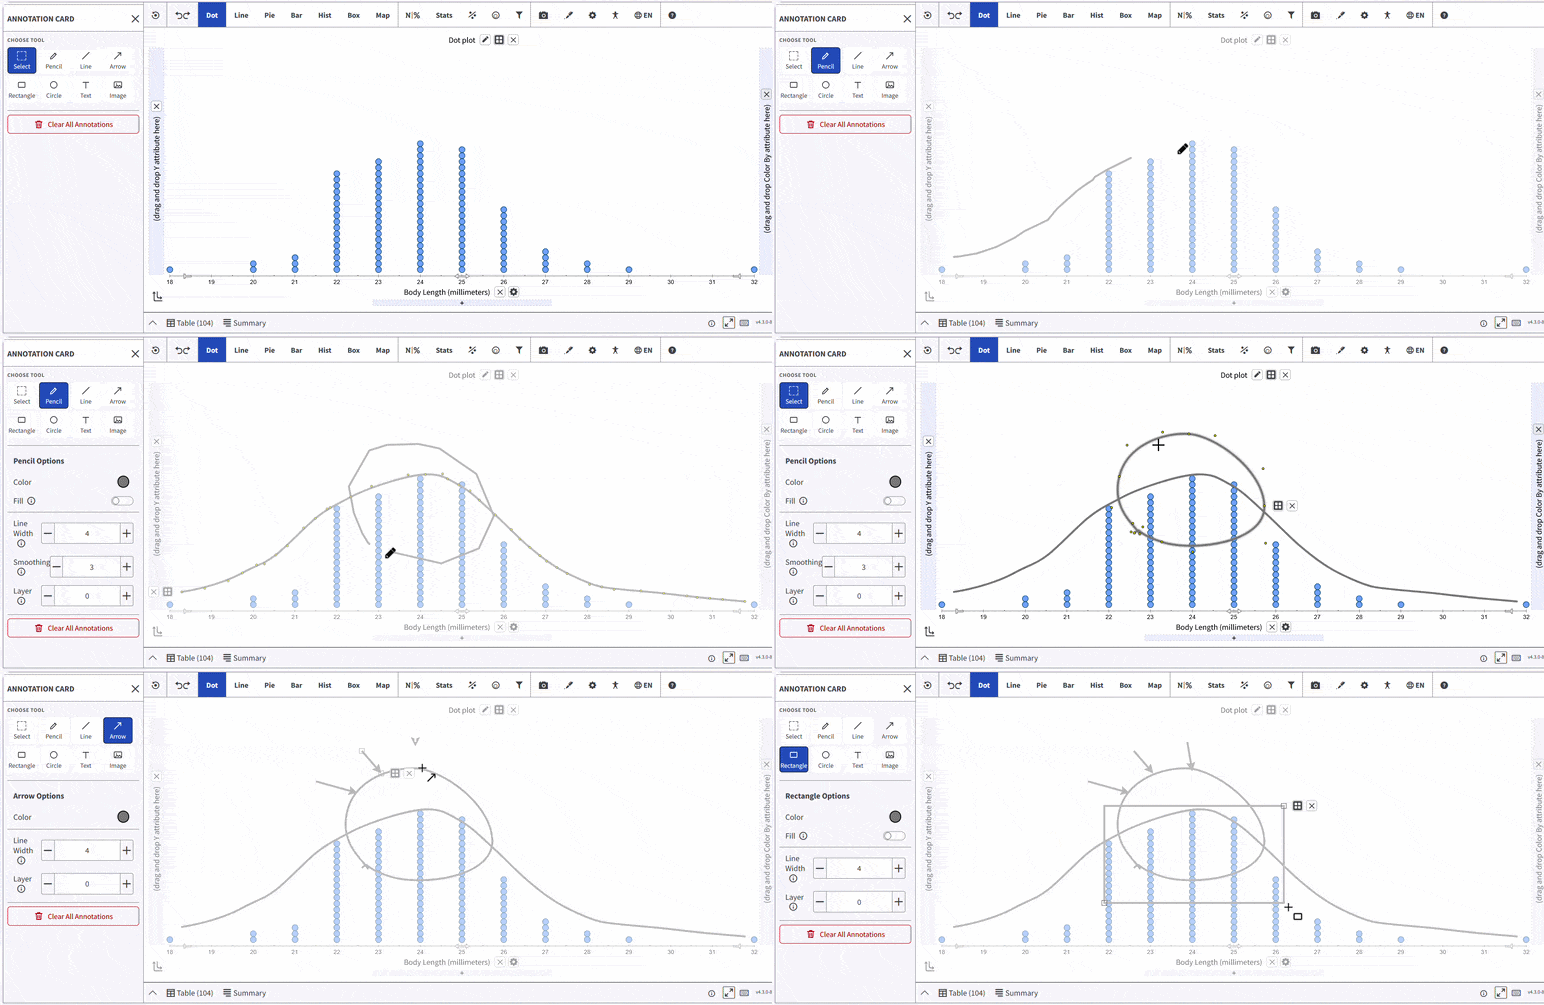
- The Annotation Card shows the properties of the currently selected annotation, such as color, line width, and layer, all in one place.
-
Opening the Annotation tab now shows a card on the left with all drawing tools, so
you no longer need to reopen the menu after each annotation.
-
Multi-Select Annotation Editing:
Multiple annotations can now be selected and edited together. Here's how:
- Drag a marquee box across the chart to select all annotations within it, or Shift-click individual annotations to add them to the selection.
- Each selected annotation shows a dashed border. The Annotation Card displays "N selected" so you always know how many are active.
- Drag any selected annotation to move the whole group at once. Arrow keys nudge all selected annotations together.
-
Changes to color, background color, line width, fill, layer, text size, smoothing,
and lock state apply to every selected annotation simultaneously.
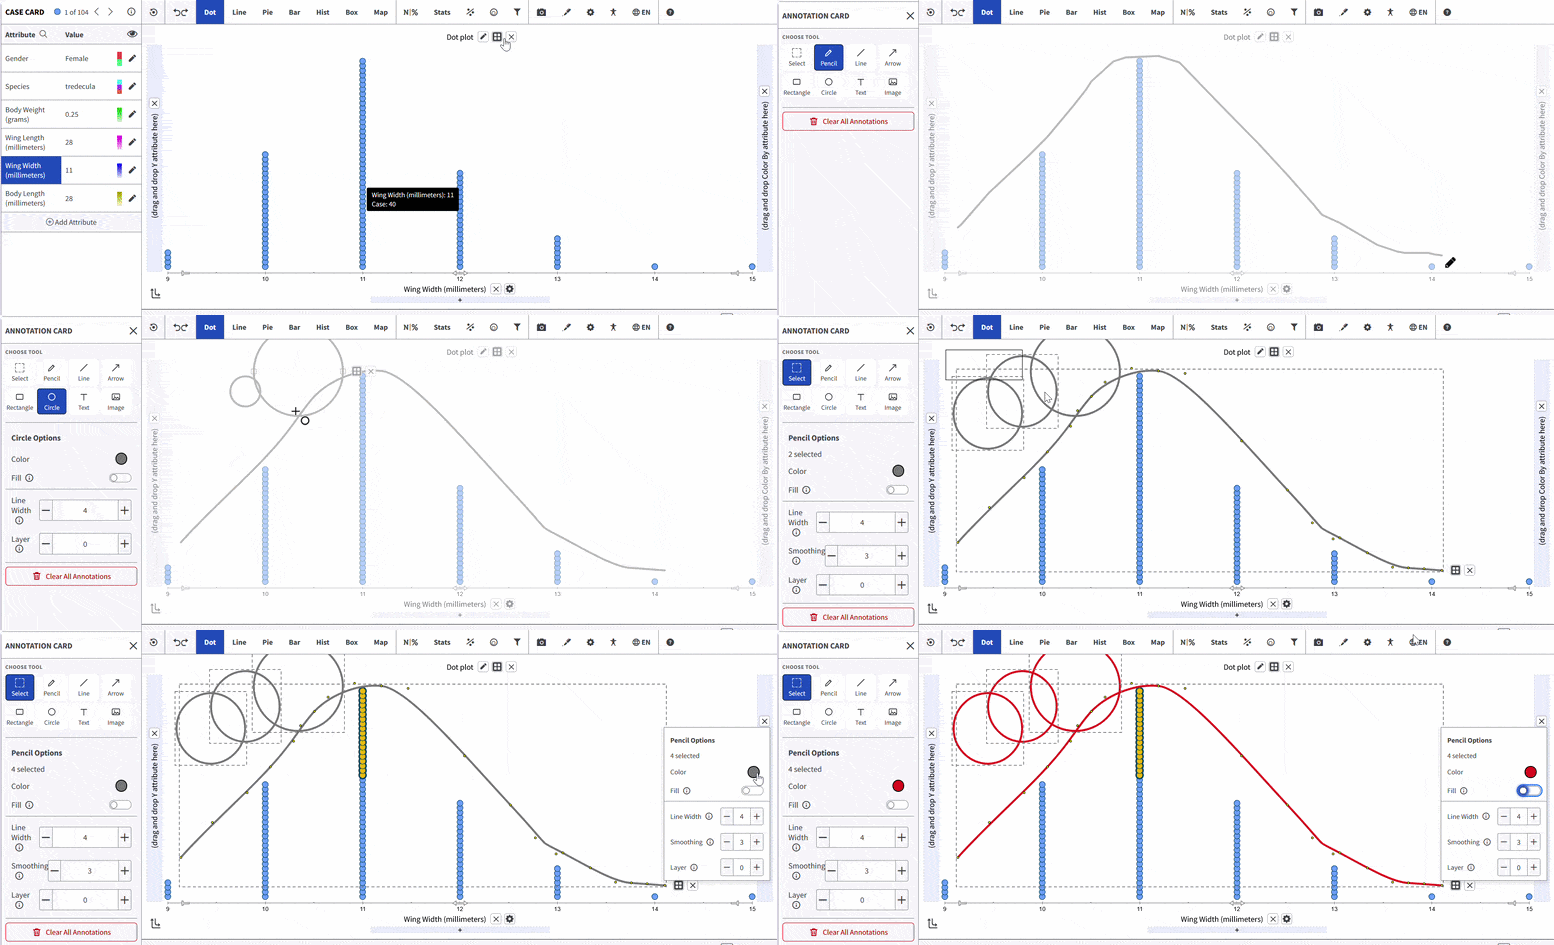
- The entire group moves or edits as a single undo step.
-
Card Stacking and Switching:
Multiple cards can now be open at the same time, so students no longer lose their work
in one card when they open another. Here's how it works:
- Opening a card, such as the Model Function Card, Plot Settings Card, or Case Card, stacks it on top of any already-open cards rather than replacing them.
- Settings and selections inside each card are preserved when you switch away and come back.
- When saving and reloading an activity, the last opened card is restored. Other cards are closed on reload.
-
Insert Data Changes:
-
Undo and Redo in Insert Data: The Insert Data table now supports
keyboard undo and redo:
- Press Ctrl+Z (Cmd+Z on Mac) to undo the last action in the table.
- Press Ctrl+Y (Cmd+Y on Mac) to redo it.
- Undo and redo work for cell edits, pastes, cuts, and multi-cell deletes.
-
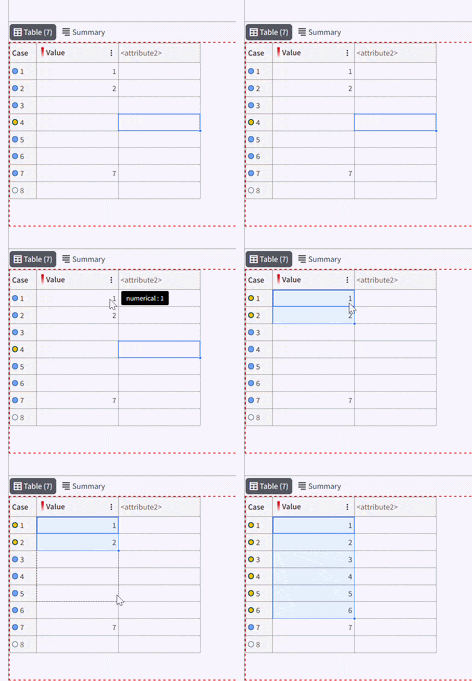
Autofill in Insert Data: The Insert Data table now supports
drag-to-fill, similar to spreadsheets:
- Select a cell that contains a value. A small fill handle appears at the corner of the cell.
- Drag the fill handle down a column or across a row to copy that value into every cell you drag over.
- The case card and plot update immediately to reflect the new cases.
-
Undo and Redo in Insert Data: The Insert Data table now supports
keyboard undo and redo:
Enhancements
-
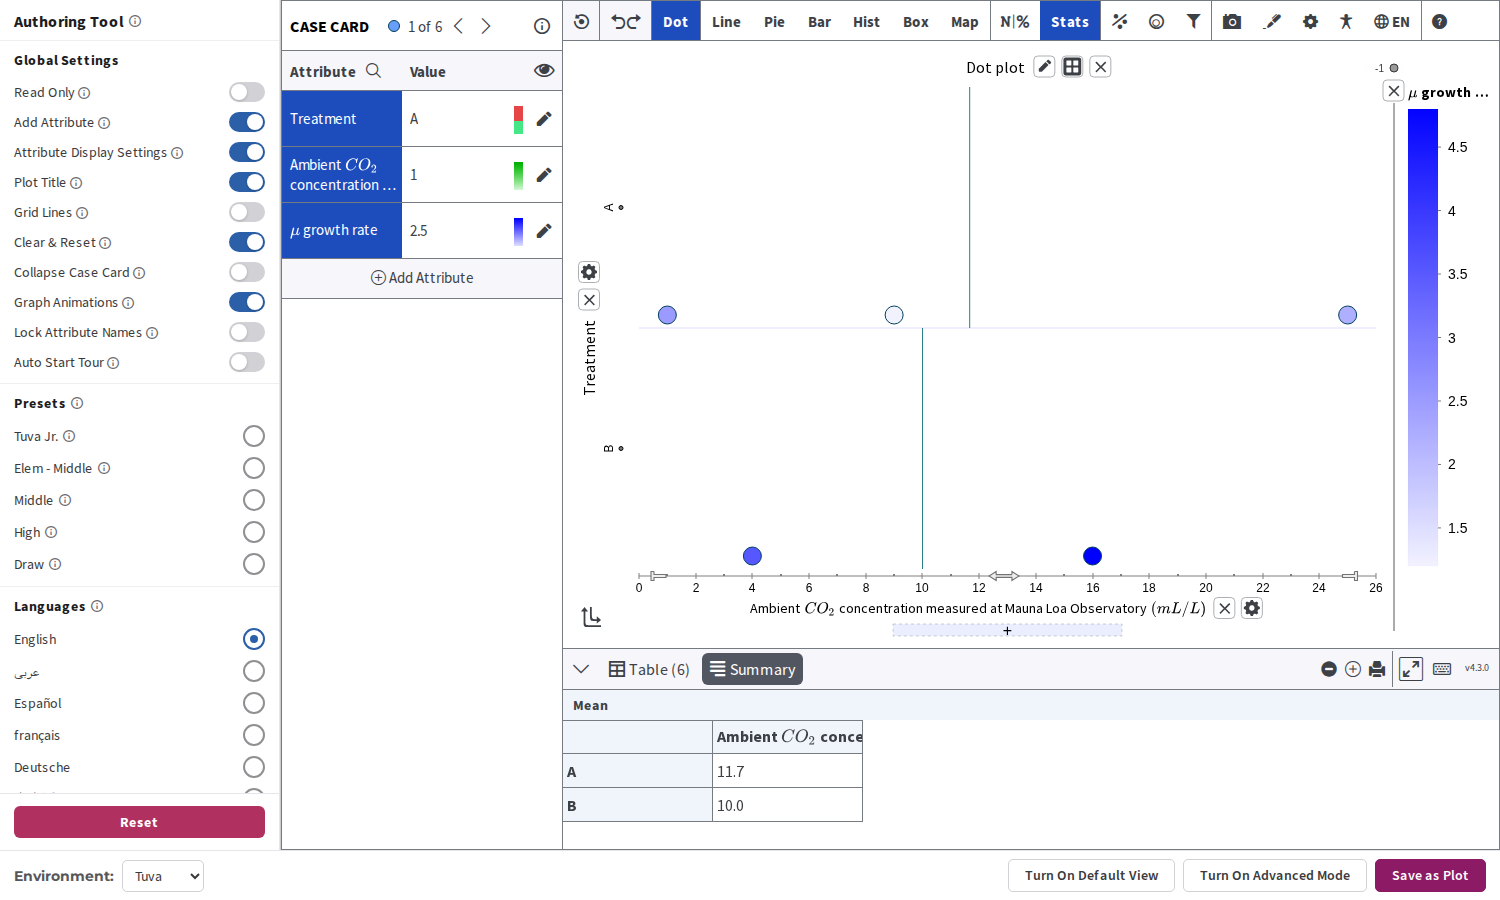
MathJax Attribute Names:
Attribute names that use mathematical notation, such as the Greek letter mu or
x-squared, now render correctly throughout the tool, including in the legend and the
Summary view.
-
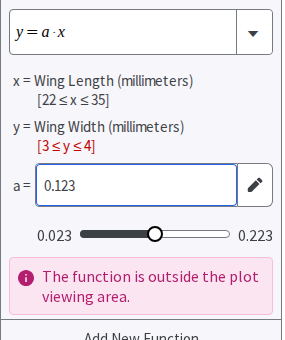
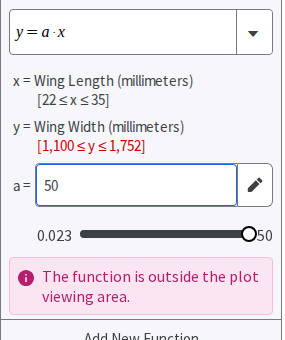
Model Function Slider Range Scales with Typed Value:
When you type a parameter value in the Model Function Card and the step size
automatically adjusts, the slider's minimum and maximum range now scale down
proportionally and center on the typed value. Previously, the slider range stayed
fixed at its defaults, making it difficult to use at small scales.
Small Values Shrink the Range
Large Values Expand the Range
- Derived Attribute Decimal Places: Derived attributes now default to two decimal places, rather than an unnecessarily large number. Changes to decimal precision also apply correctly when the attribute is edited after it was first created.
-
Extracted Number Detection Improvements:
The Extracted Number auto-detection is now more precise, preventing several cases
where categorical values were incorrectly converted to numbers:
- Values whose prefix or suffix varies across cases (for example, some say "cm" and others say "in") now stay categorical instead of converting.
- Values whose prefix or suffix contains digits (such as "A-1-01") no longer auto-convert.
- Attributes with mixed formats (for example, some values formatted as "$12" and others as "12 cents") stay categorical.
- Numbers with decimal points embedded in a string (such as "M1.5") are now extracted correctly as 1.5 rather than truncating to 0.5.
-
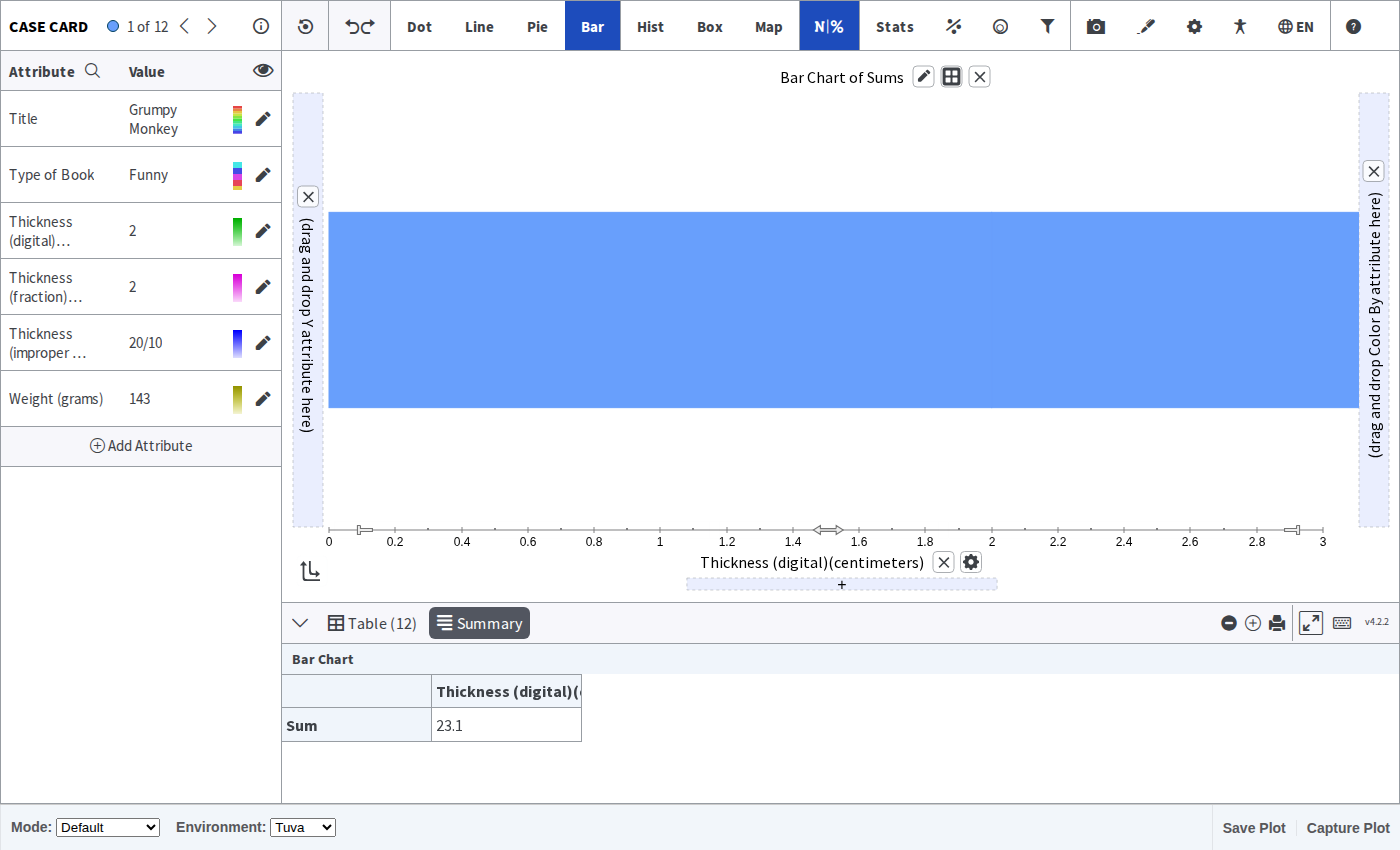
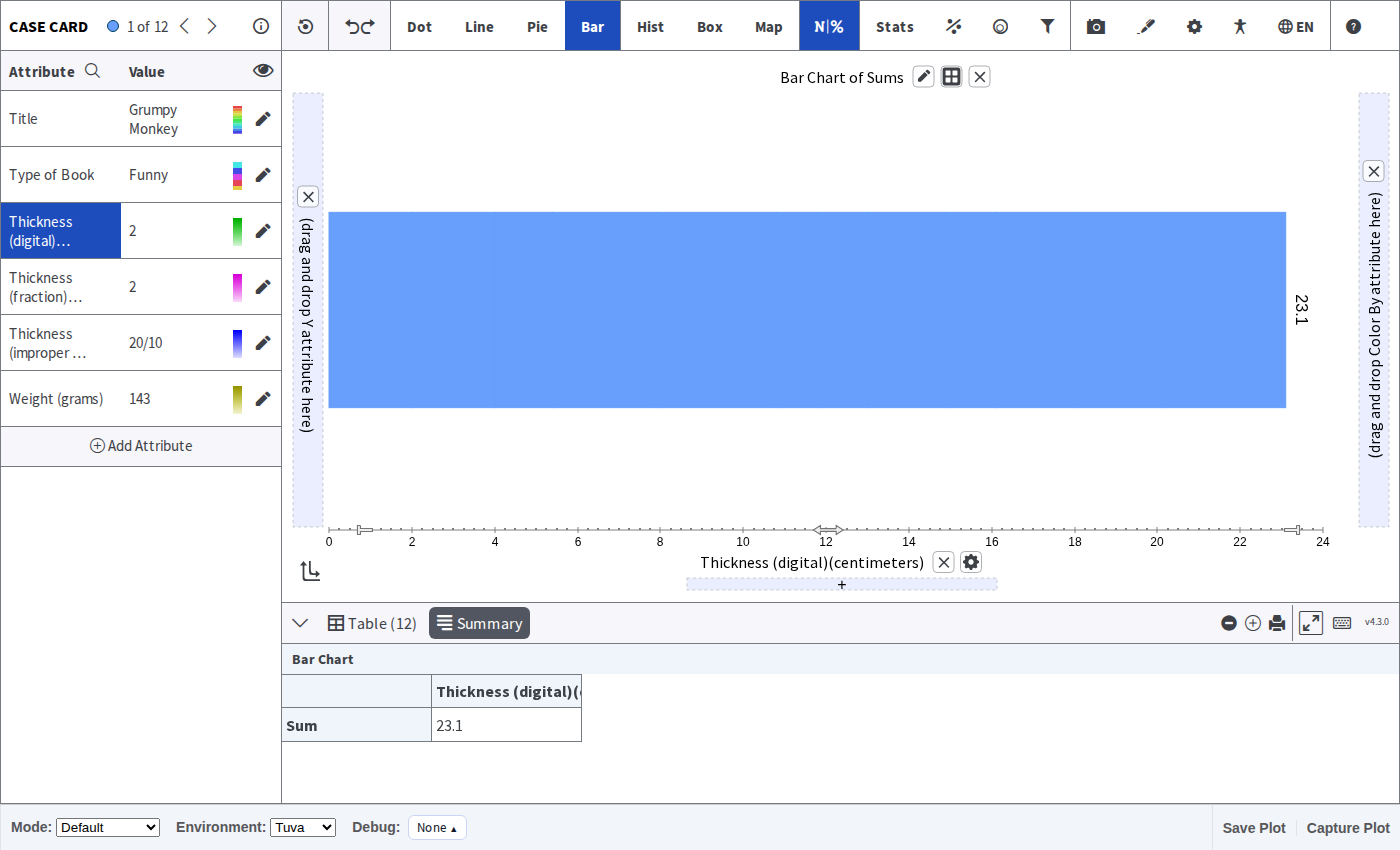
Bar Chart of Sums: Corrected Axis Scaling:
The axis in a Bar Chart of Sums now scales to the total sum of the values, so bars are
never cut off. Previously, the axis used the attribute's maximum value instead of the
sum, causing bars to overflow. A related scaling issue in Bar Charts of Frequencies
with metadata attributes was also fixed.
Before
After
-
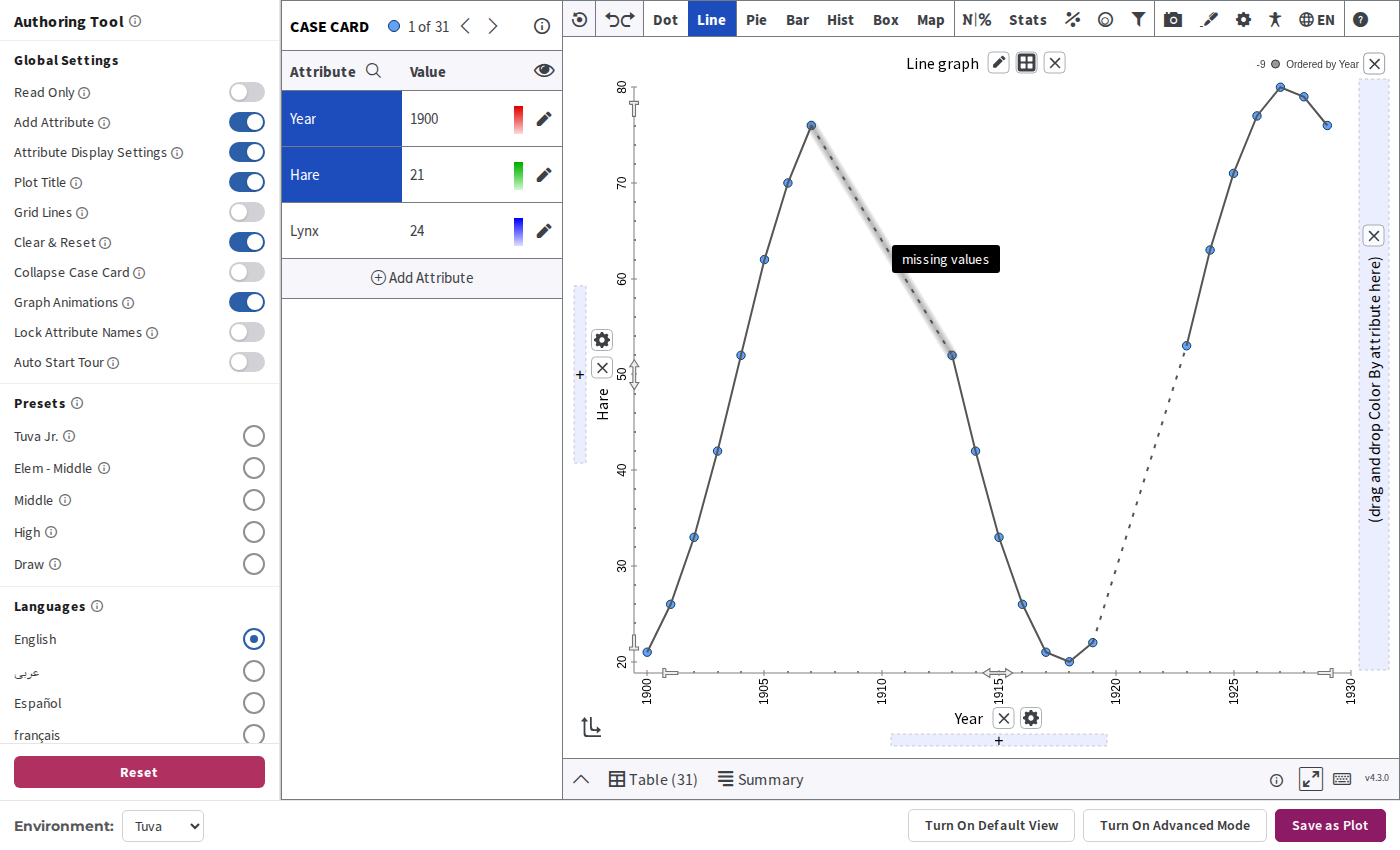
Hover Tooltip on Dotted Line:
Hovering over the dotted line that connects data points across missing cases now shows
a tooltip indicating missing values.
- Localization: Sample Statistics: All Sample Statistics labels, axis prompts, and accessibility text are now translated in all 10 supported languages.
Accessibility
- Category Keyboard Interaction: Categories shown on axes and in the legend are now fully keyboard accessible. They have ARIA roles, labels, and tab index, and respond to arrow keys, Enter, and Space to select, deselect, and navigate between them. Screen readers announce selections correctly.
- Plot Summary: More Elements Described: The plot's accessible summary now describes reference lines, rulers, dividers, counts, and percentages. Previously these elements were absent from the description, so screen reader users had an incomplete picture of the chart.
- Skip to Main Content: A skip navigation link now appears as the first focusable element in the tool. Keyboard users can activate it to jump directly past the toolbar to the plot area, rather than tabbing through every toolbar control.
- Sonification Controls: ARIA Labels: The Play, Pause, Stop, and Restart buttons and the Speed and Volume sliders in the Audio Trace panel now have proper ARIA labels. Changes to speed and volume are announced to screen readers via an aria-live region.
-
Tab Order Fixes:
Two tab order issues were corrected:
- The Order By close button now appears immediately after the filter icon in the keyboard tab order, matching its visual position next to it.
- The plus and minus zoom buttons on Map plots now appear in the correct tab order alongside the other map controls, before the cases.
- Color Picker: Keyboard Focus: The color picker no longer closes unexpectedly when you type a hex color value. Tab now cycles through all controls inside the picker rather than closing it, and Esc closes it and returns focus to the color swatch that opened it.
Bug Fixes
- Table, Case Card, and Plot Sync: Selecting a case in the Case Table, Case Card, or plot area is now synchronized correctly across all three views. Previously, selections made in one view were not reliably reflected in the others.
- Case Table: Sampling Case Circle Colors: Case circles in the Case Table now show the correct color for every case when sampling, regardless of case number. Previously, cases with higher numbers could appear with an incorrect transparent background.
- Case Table: Case Column Width: The "Case" column in the Case Table is now wide enough to display four-digit case numbers without clipping.
- Crash Fix: Closing Y-Axis on Embedded Plots: Fixed a crash that occurred when closing the Y-axis on an embedded plot and then resizing the window or triggering a save. This affected hundreds of users across partner integrations.
- Plot Title Alignment After Deletion: After deleting a plot title and clicking the edit icon to enter a new one, the text field and save button are now properly aligned.
- Plot Title Buttons Clickable Above Legend: The plot title edit, close, and reload buttons are now always clickable, even when the legend is positioned behind them.
- Order By Label Overlap: The Order By label no longer overlaps the plot title when Color By is not in use.
- Dividers with All Missing Cases: Dividers no longer cause errors when all cases are missing from the numeric axis, for example when switching to the Distribution view in the sampler with a categorical Y-axis.
- Sampling with Replacement: Case Table Bug: Fixed a bug where sampling with replacement caused duplicate keys in the Case Table, which could produce inconsistent behavior.