Tuva Tools v4.2.0
Released 7/20/2026 Latest
Tuva Tools 4.2.0 is a release centered on polish and consistency. Right-click context menus now cover every chart element, and labels across bar charts and pie charts behave predictably no matter how much data a graph contains. Date and time axes have gotten smarter, a number of longstanding bugs were fixed, and the underlying MathJS library was brought up to date.
As in every release, 4.2 continues Tuva's commitment to accessibility, with improvements to keyboard tab order and to how content is exposed to assistive technology.
New Enhancements
-
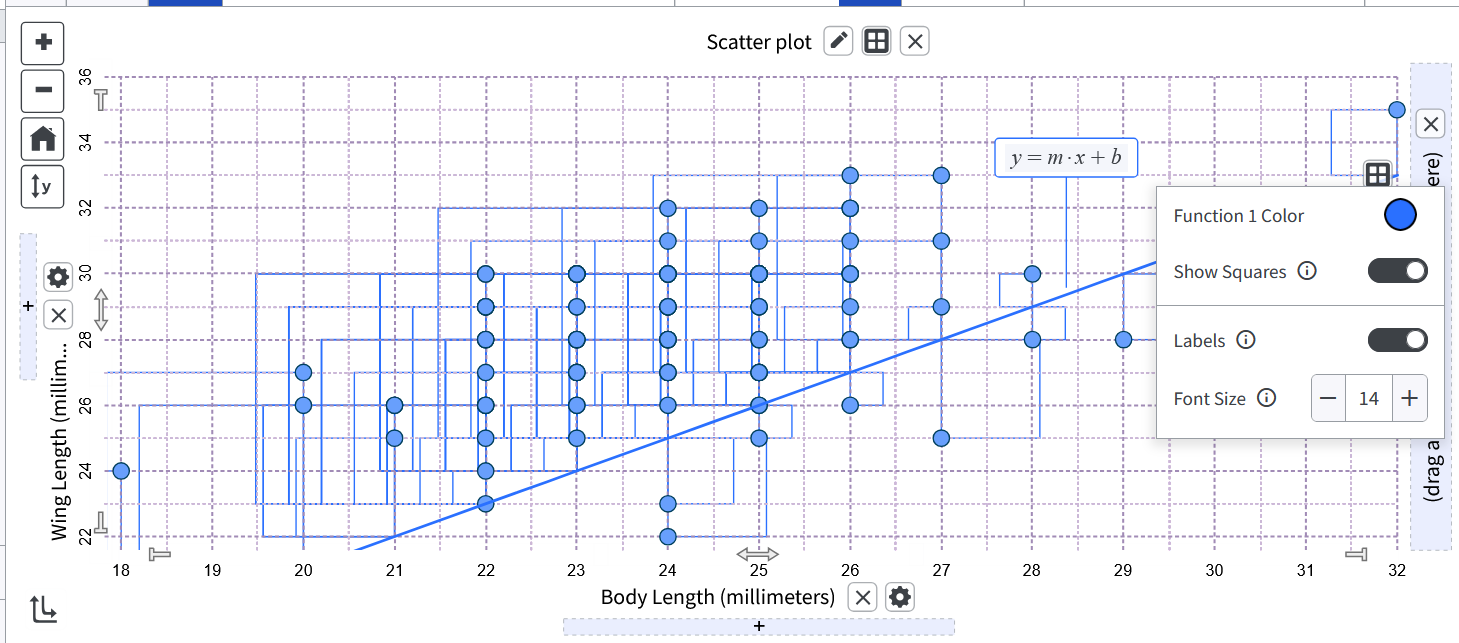
Model Functions Context Menu:
Every chart element now has a right-click context menu, including model functions.
Right-clicking a model function line brings up options to change the line color and
toggle Show Squares. This brings model functions in line with Movable Lines and Least
Squares Lines, so the experience is the same no matter which type of line you're
working with.
-
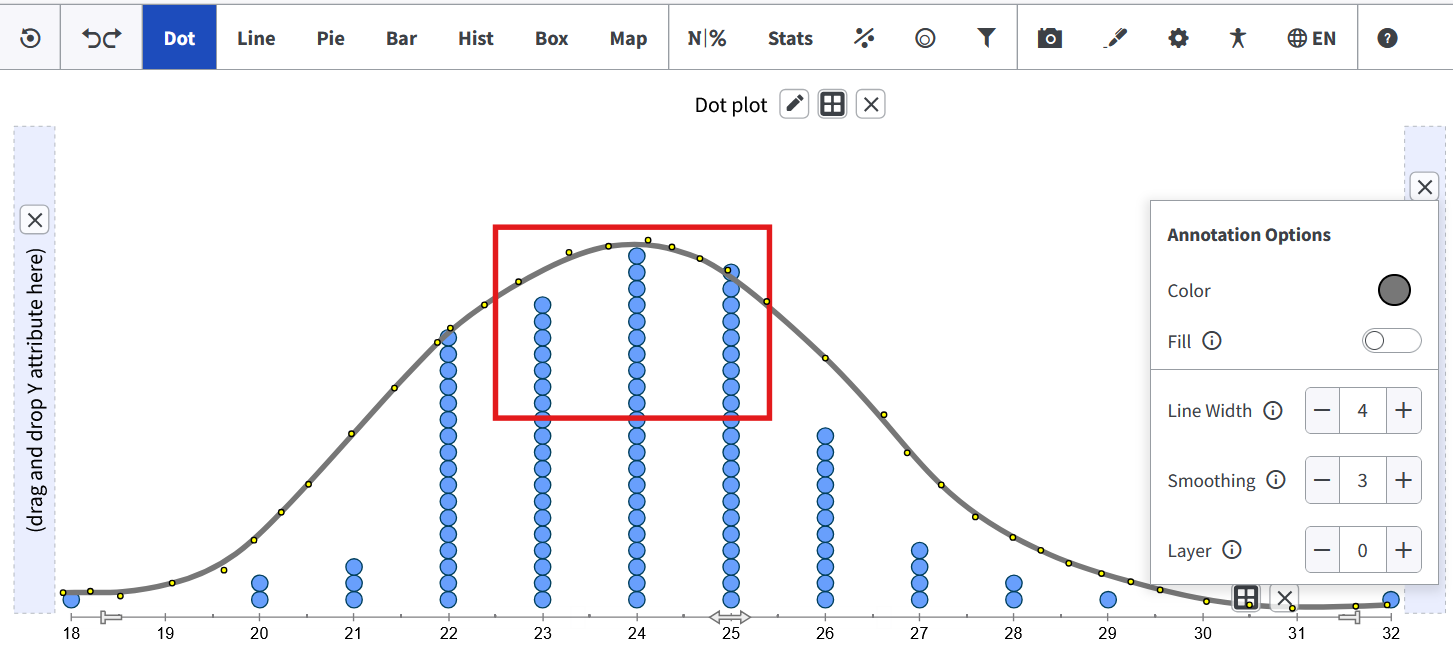
Annotation Context Menu:
Annotations and drawn shapes now have their own right-click context menu, completing
full context menu coverage across the tool.
-
Chart Label Rotation Consistency:
Label rotation is now consistent across bar charts and pie charts.
-
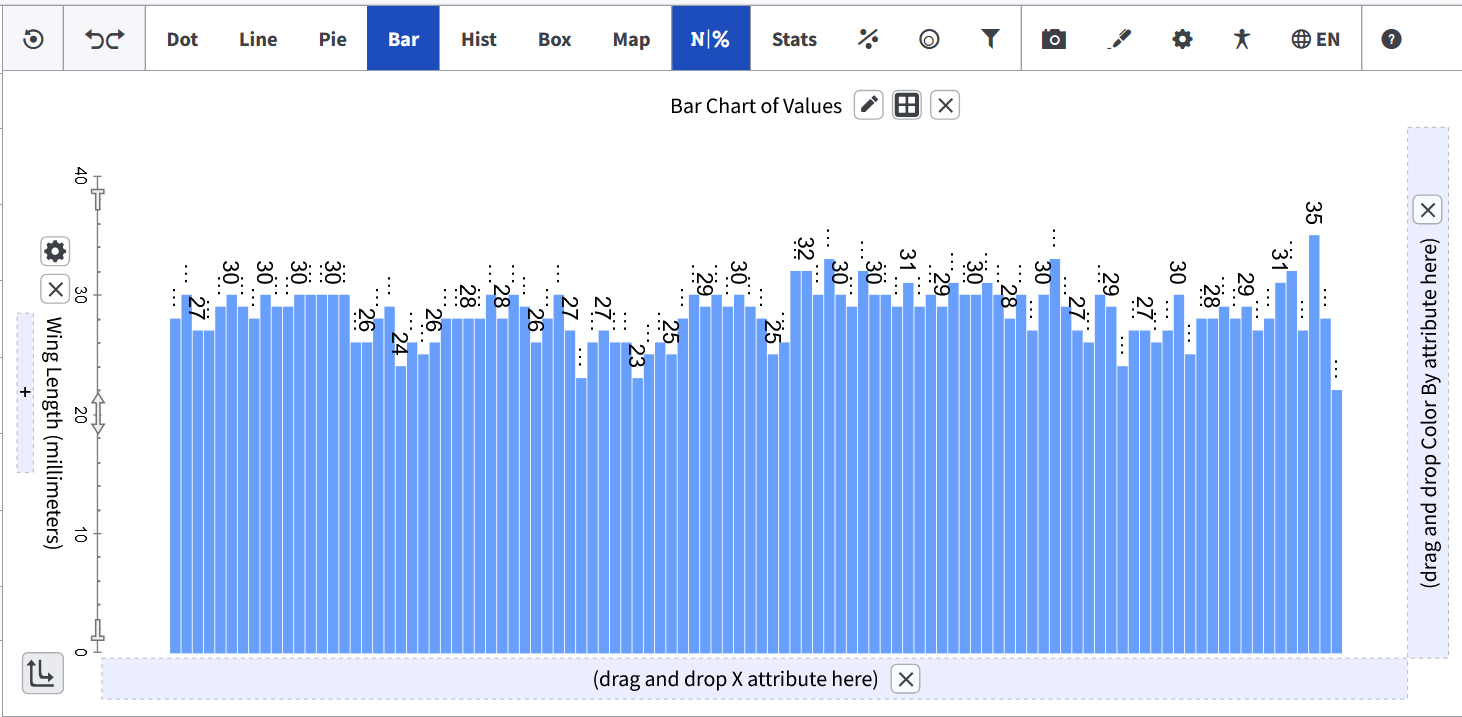
Bar charts: Count and percent labels now rotate the same way as
the axis labels, so nothing ends up pointing in a different direction. When a Bar
Chart of Values has many categories, value labels used to pile up and become
unreadable; labels now rotate automatically when they are too wide to fit side by
side. When the chart is too dense to show every label, some are replaced with an
ellipsis, and the full value appears when you hover over them.
-
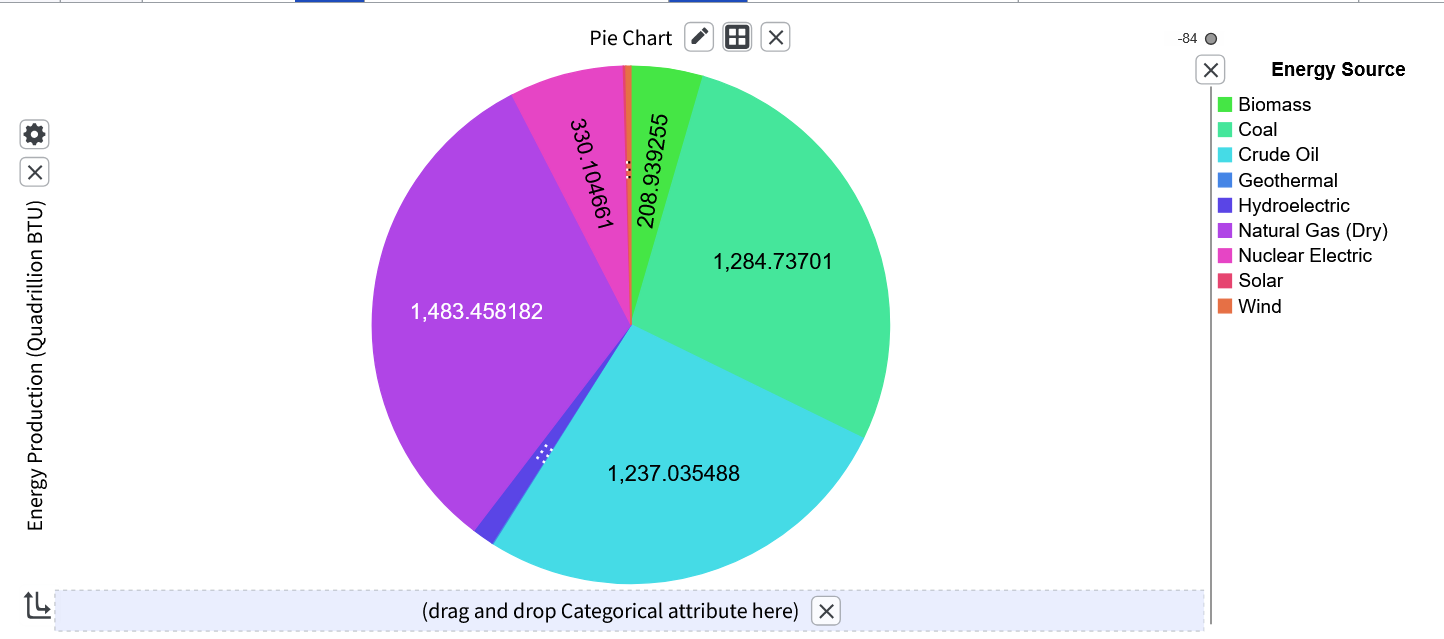
Pie charts: Label text defaults to 16pt, stays horizontal when it
fits a slice, rotates to run parallel to the slice edge when it doesn't, and is
replaced with an ellipsis ("…") when it still doesn't fit.
-
Bar charts: Count and percent labels now rotate the same way as
the axis labels, so nothing ends up pointing in a different direction. When a Bar
Chart of Values has many categories, value labels used to pile up and become
unreadable; labels now rotate automatically when they are too wide to fit side by
side. When the chart is too dense to show every label, some are replaced with an
ellipsis, and the full value appears when you hover over them.
-
Smarter Date and Time Axes:
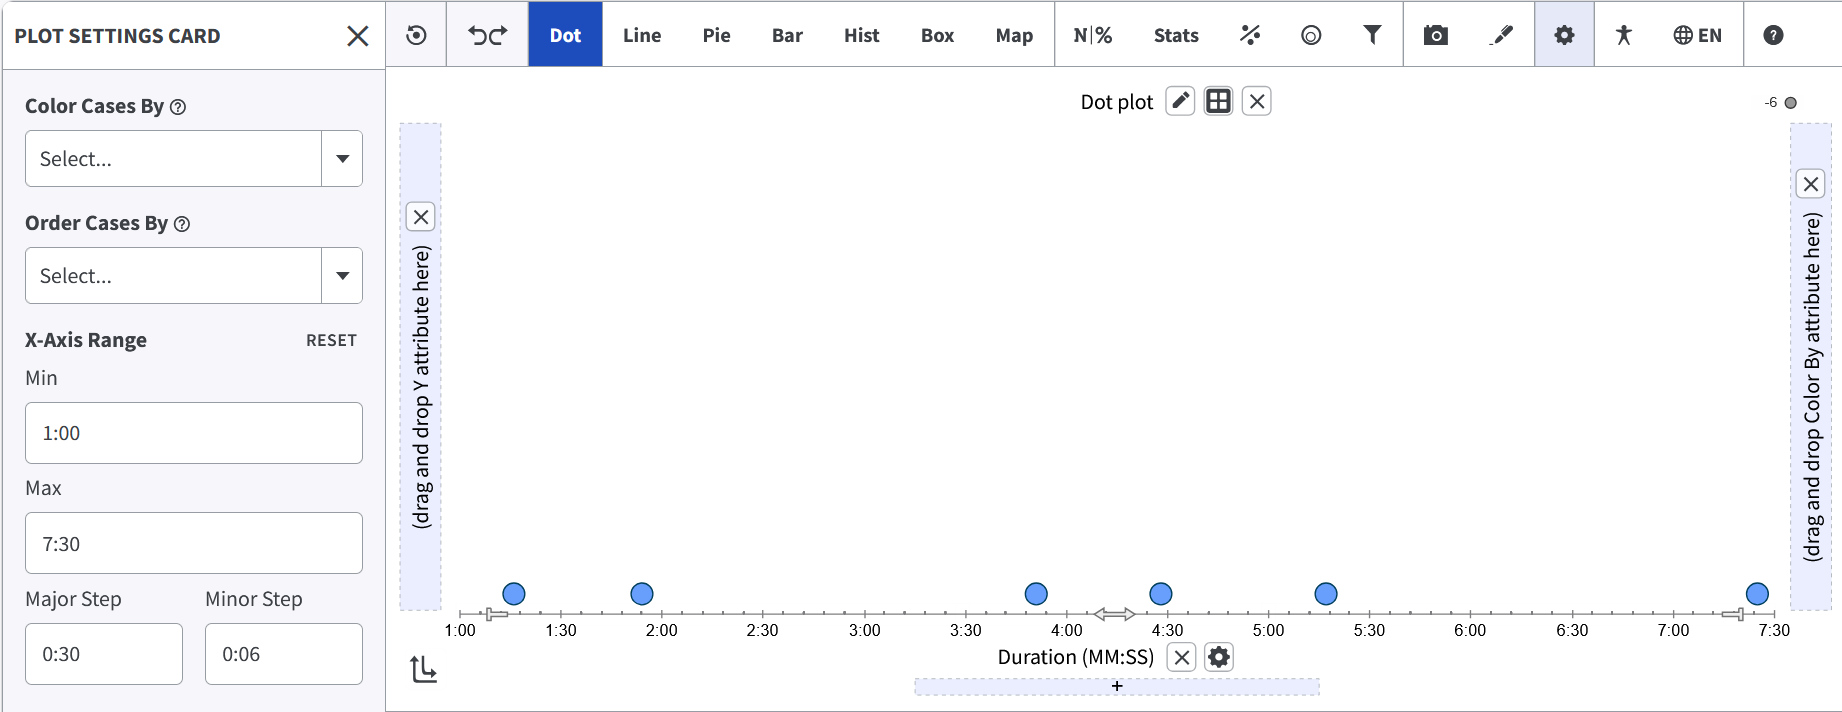
Date and time axes now snap to natural, easy-to-read intervals instead of odd
mathematical ones. A chart spanning a school day no longer shows ticks at 1:23 or 2:46
— it shows 1:00, 2:00, 3:00. Here's what changed:
- Time and Duration axes now land on hour and minute boundaries.
- Date and Date-Time axes align to year and month boundaries, so a multi-year dataset shows January 1st of each year as a major tick.
- Year-Month and Month-Year data is now handled according to its own format rather than being treated as a plain number.
- Fixed a histogram bug where Day of Week data only spanned Sun to Sat (6 intervals) instead of a full week, Sun to Sun (7 intervals).
-
Reset Button for Axis Range Controls:
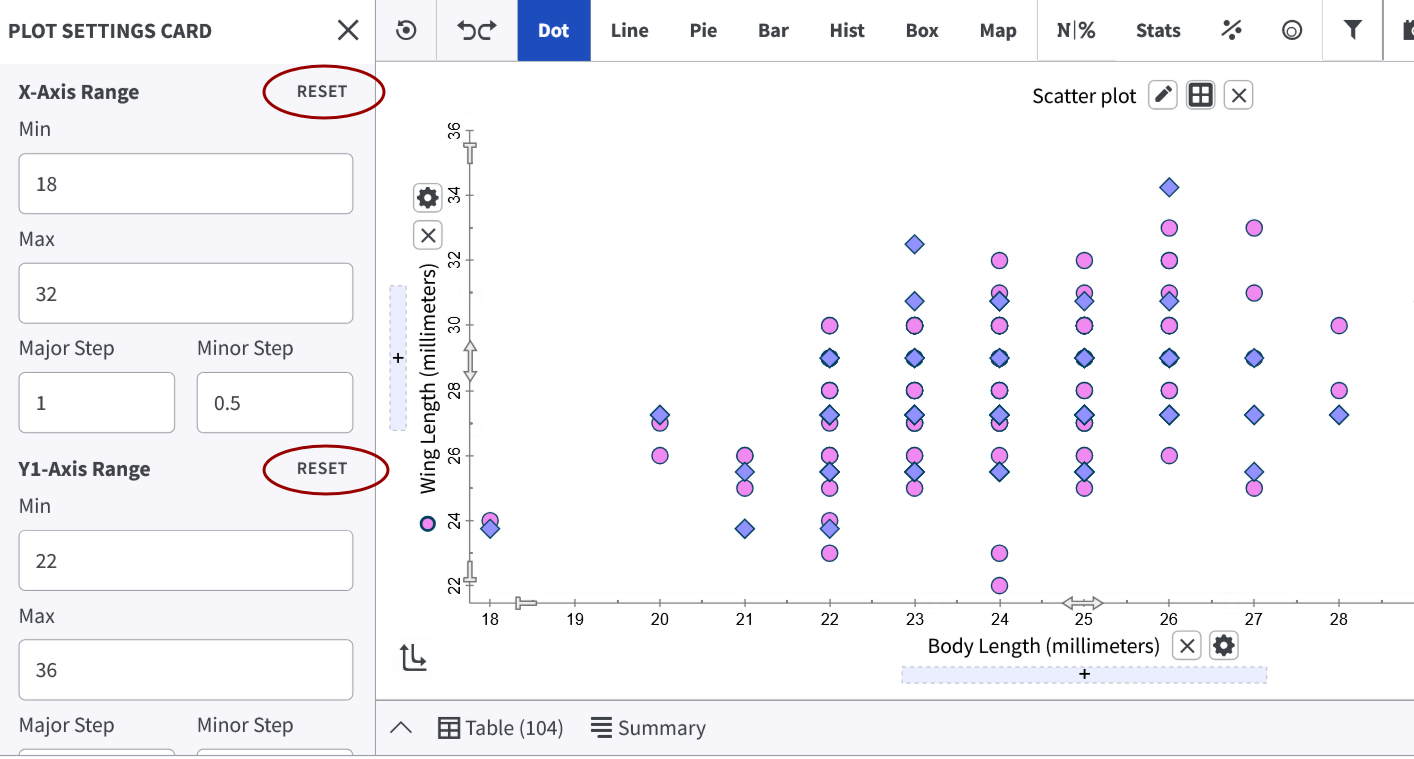
A new Reset button now appears next to the X-Axis Range, Y-Axis Range, and Y2-Axis
Range controls in Plot Settings. One click brings the axis back to its default
settings, undoing any manual adjustments to the min, max, major step, and minor step
values. This makes it much easier to start fresh after experimenting with axis settings.
-
Annotation and Draw Layer Ordering:
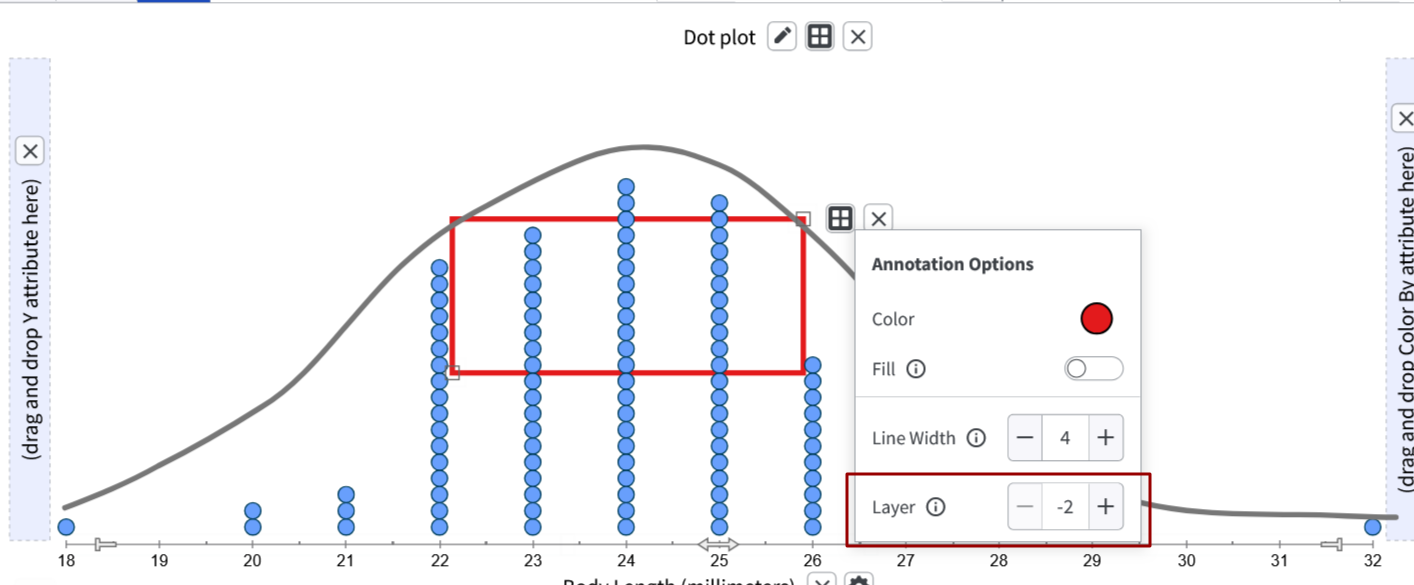
Annotations and drawn shapes no longer get buried behind case icons unexpectedly. The
layer system now runs from −2 to 4, giving you precise control over how
annotations stack relative to data. Use negative layers to deliberately place shapes
behind case icons, or higher layers to keep them on top.
- MathJS Library Update: The MathJS library was updated to the current version. This resolved compatibility issues and improved formula evaluation reliability across the tool.
Accessibility
4.2 continues Tuva's ongoing work to make the data exploration tool fully usable for all learners, with improvements to keyboard tab order and to how content is exposed to assistive technology.
- Tab Index Order Fix for Map Plot Controls: On map plots, the Home, Select Cases, and Drag Map buttons now appear in the keyboard tab order before the cases, matching their visual position on screen.
- Categorical Attribute Settings Card — CSS Content Fix: Several icons and labels in the Categorical Attribute Settings Card were rendered using CSS alone, which meant their meaning was lost for users with CSS disabled or those relying on assistive technology. This included the question mark tooltip icons, the Sort label, color picker labels, and the plus and minus icons on the Decimals control. These are now represented in HTML, so their meaning is always available regardless of how the page is rendered.
Bug Fixes
- Case Icon Positions on Restored Plots: Case icons on line graphs were showing up slightly offset from their correct positions when a saved plot was first restored. They would snap back into place as soon as you resized the window or interacted with the chart. This is now fixed: icons appear in the right place right away.
- Case Table — Attribute Type Changes: If you changed the type of an attribute while a cell was being edited in the Case Table, the table didn't update to reflect the new type. This is now fixed: changing the attribute type closes the active edit first and then updates the table correctly.
- Attribute Settings Card and Edit Data Cleanup: The Attribute Settings Card now handles attribute changes more reliably. If you deleted an attribute while the card was open, it now closes properly and the attribute is removed from any plot axes. The card also updates dynamically while you edit data in the table.
- Histogram Count Label Overlap: In histograms with a numeric X-axis and a categorical Y-axis, count labels could overlap with the category above them. This has been fixed.
- Crash Fixes: A number of errors that could cause the tool to crash unexpectedly were fixed. These covered scenarios such as restoring a saved plot, resizing chart elements, and working with the case table under certain conditions.