Tuva Tools v3.1.2
Released 6/14/2024
Version 3.1.2 of Tuva Tools packs some exciting features and enhancements across the Tuva data tools, Tuva Jr., and the Draw mode.
Enhancements to the Tuva Tools:
-
Stretched Bar Chart Enhancements: We have introduced the ability to copy annotation elements directly within the Data Exploration environment as well as in the Draw mode. This update allows both the author of an annotation and the end user to efficiently select and duplicate previously created annotation items.
-
Changed Default Display:
We have switched to displaying counts instead of percentages for the bar sections in stretched bar charts.
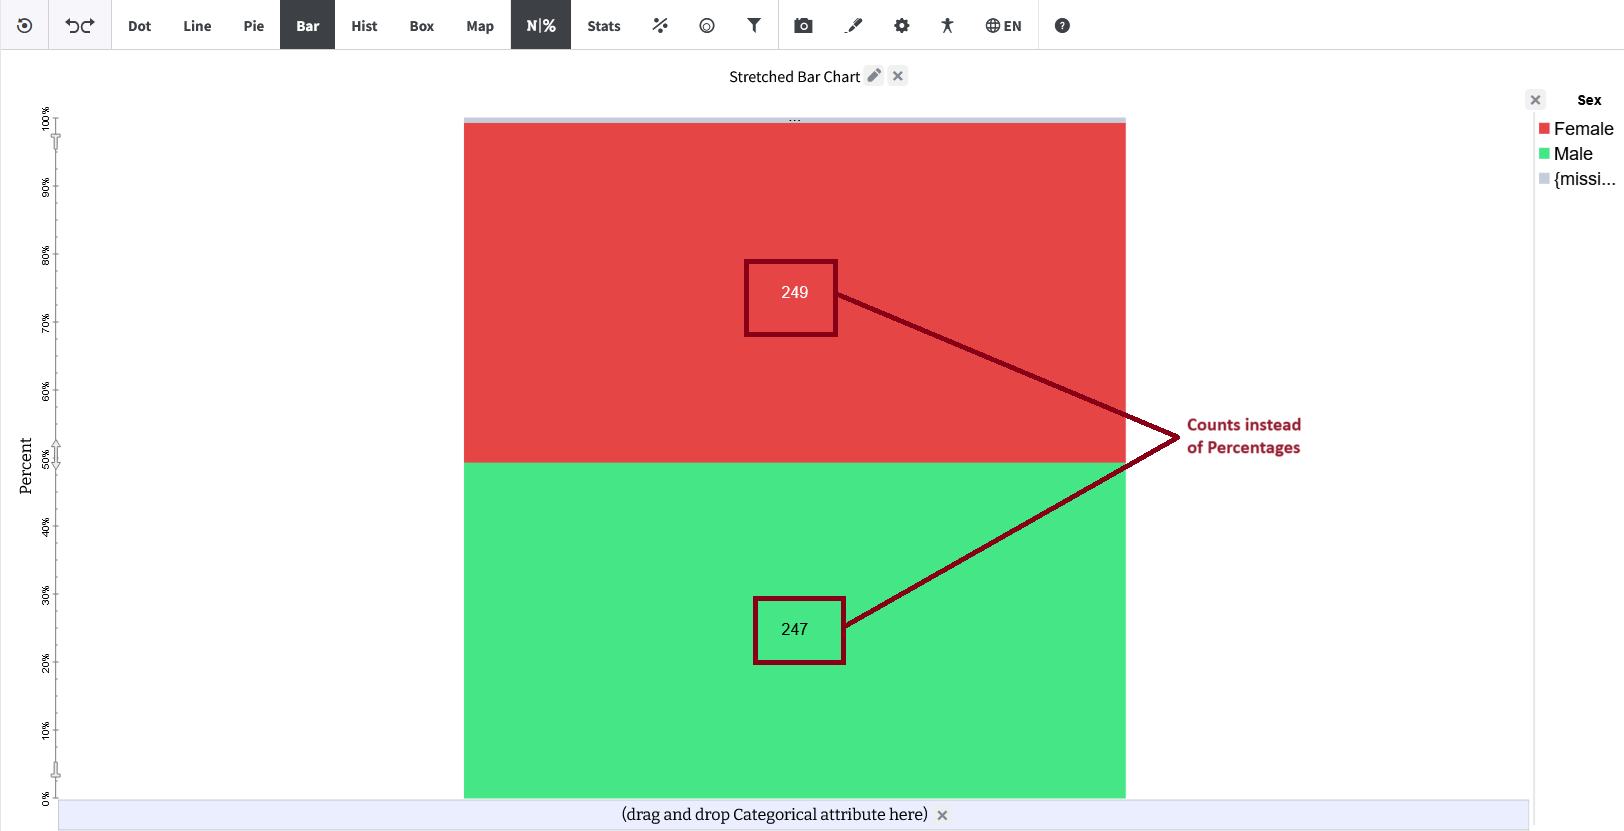
This enhancement ensures consistency with the default behavior of other aggregate graphs, such as pie charts. Additionally, by displaying absolute numbers, users can more intuitively estimate part-to-whole ratios and proportions. Users who prefer to view percentages can still enable this option manually. -
Revised Font Size Heuristics:
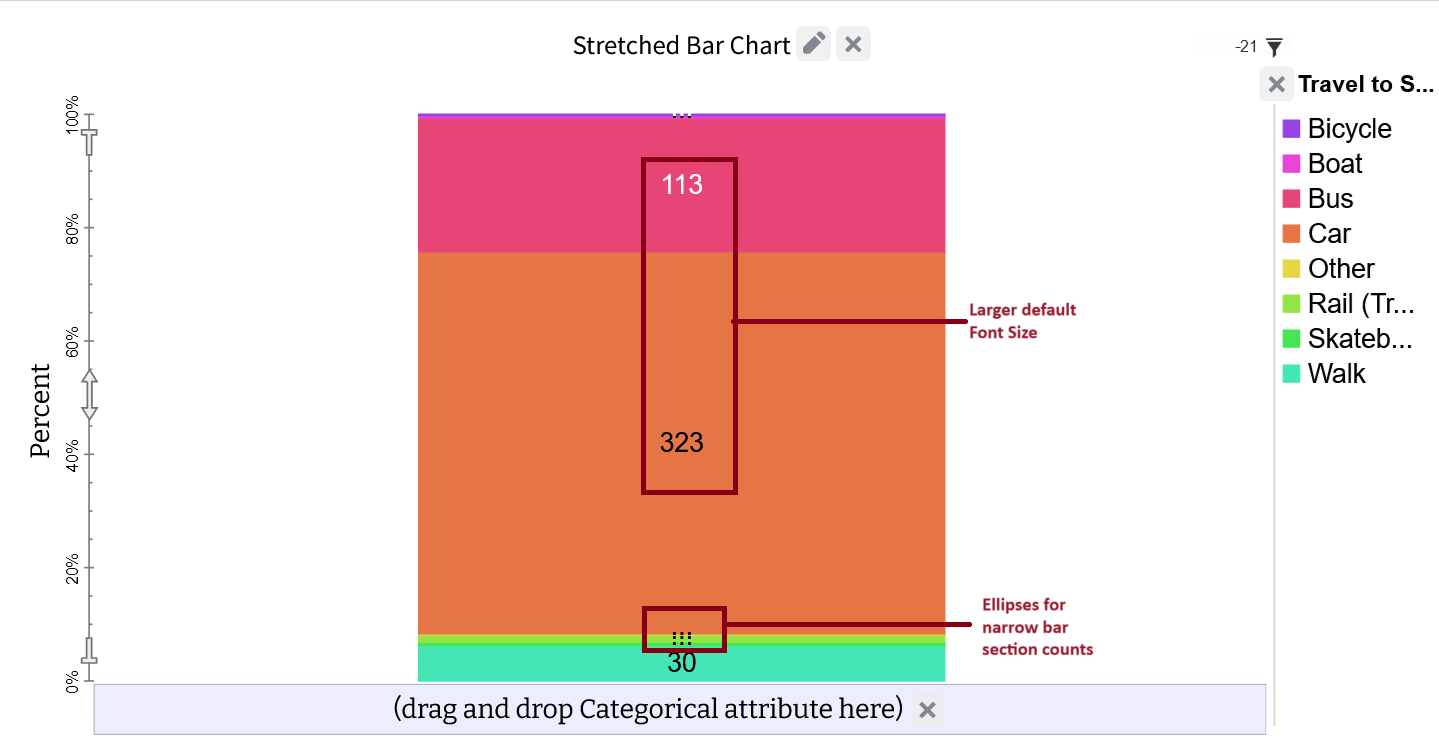
We have revisited our font size heuristics for stretched bar charts to enhance readability and reduce clutter. The default font size for counts has been increased for larger bar sections, while counts for very narrow bar sections are now hidden and replaced with ellipses to prevent visual crowding. However, users can hover over the narrow bar sections to read the counts in the tooltip.
-
Changed Default Display:
We have switched to displaying counts instead of percentages for the bar sections in stretched bar charts.
-
Enhanced Grid Lines Visibility:
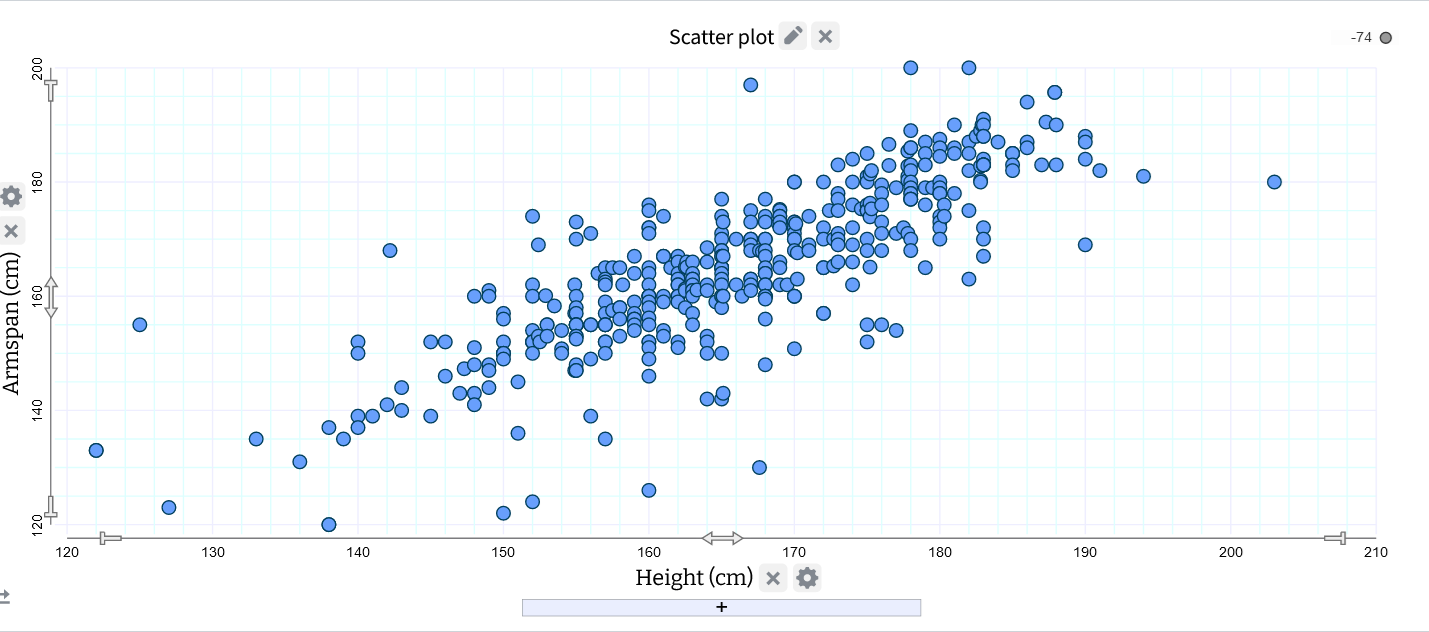
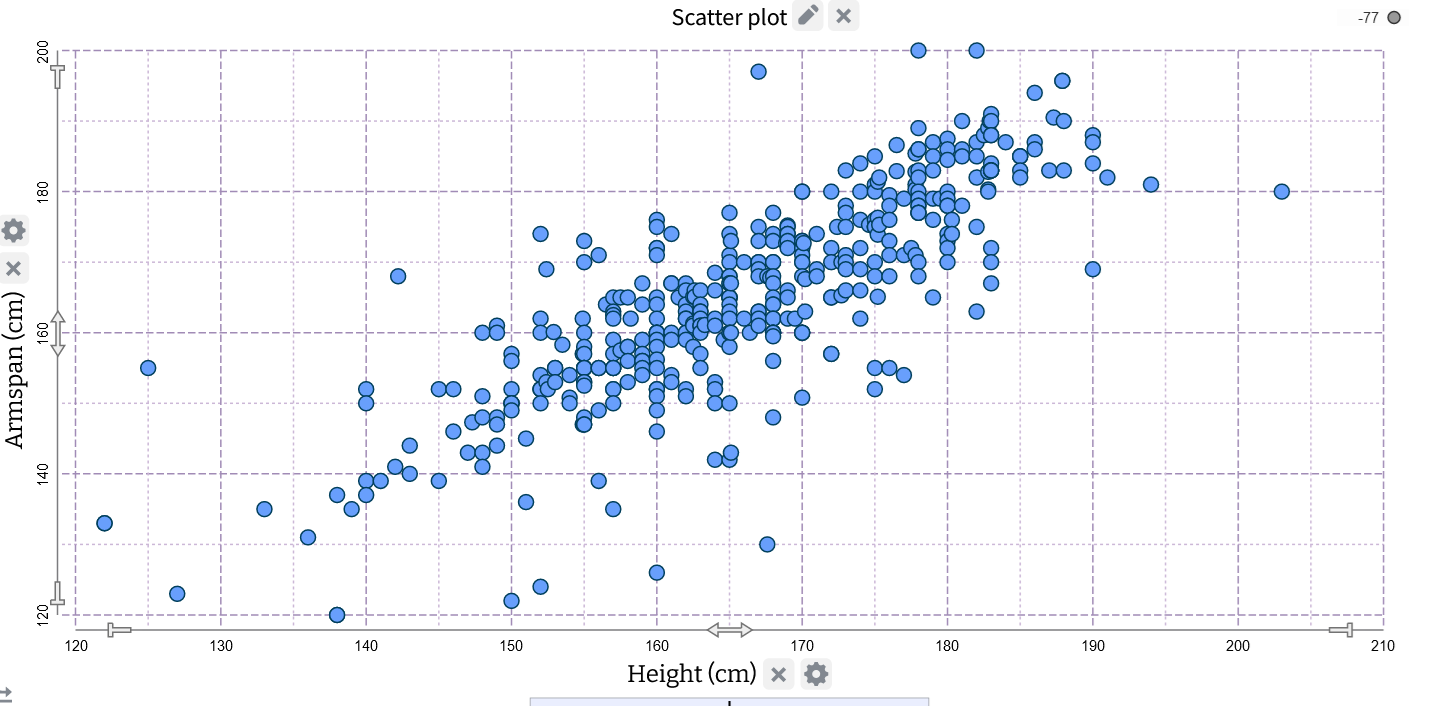
We have updated the color scheme for the major and minor grid lines to enhance their visibility against a white background.
Before
After
Enhancements to the Tuva Jr.:
-
Added Support for Fractions:
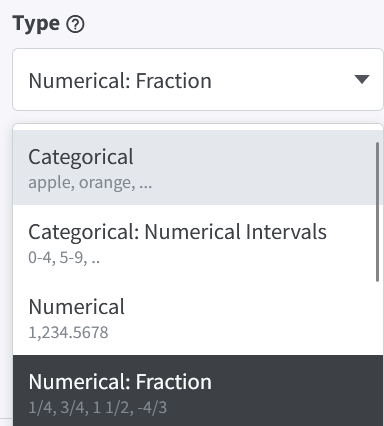
We have added support for recognizing and displaying fractional values for attributes by introducing "Numerical: Fraction" as a data type. This allows the system to automatically recognize and plot case values as numerical fractions.
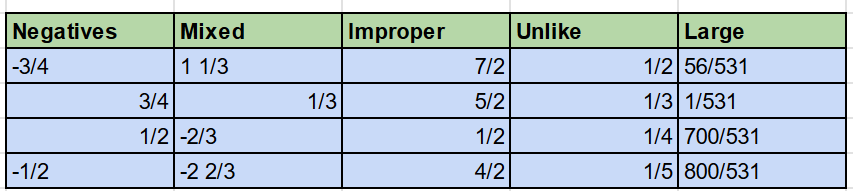
The tool can recognize and automatically display the following formats inputted in spreadsheets:- Negative Fractions (e.g., -a/b)
- Mixed fractions (e.g., a b/c)
- Improper Fractions (e.g., a/b where a > b)
- Unlike fractions (e.g., a/b and a/c)
- Large fractions
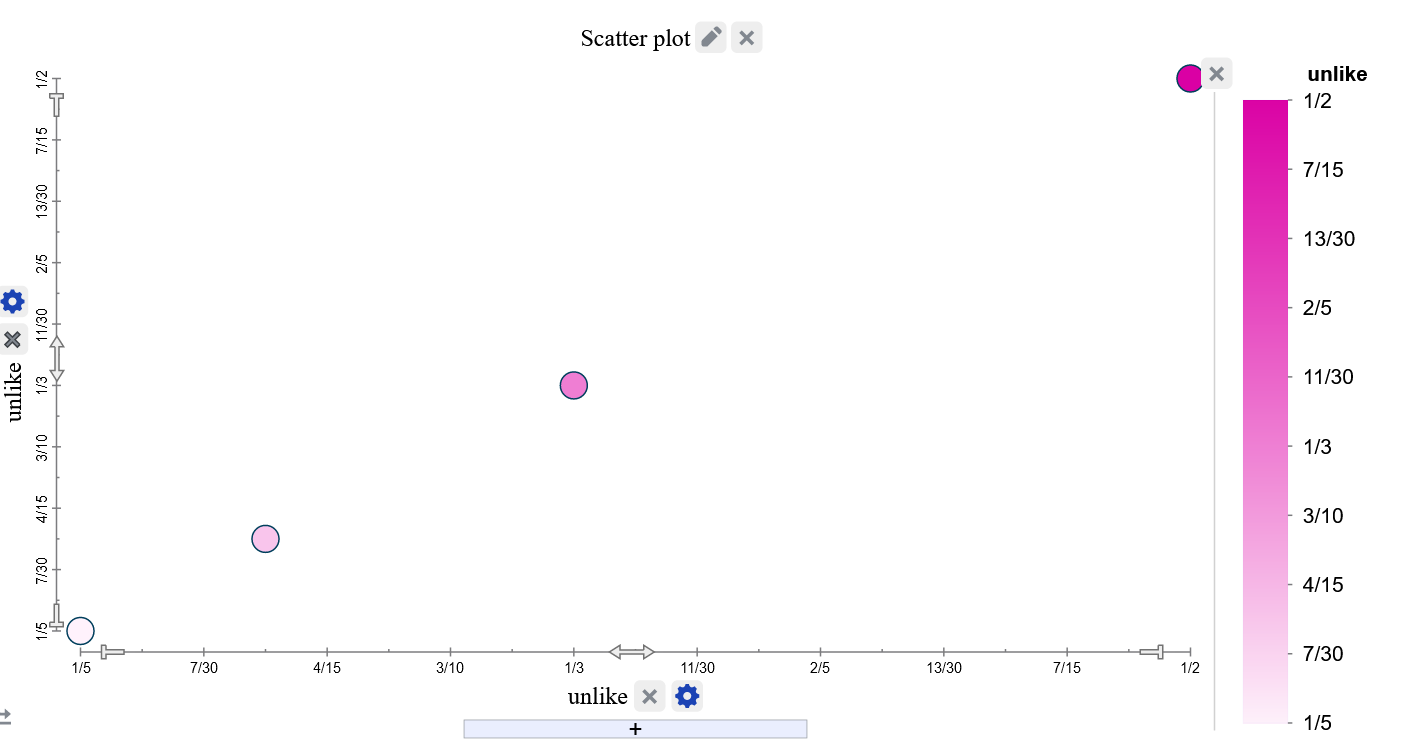
We added the support because number lines offer a broader understanding of fractions, providing a more accurate and effective method for teaching fraction concepts and laying a solid foundation for complex operations.
It is a work in progress and we will continue to iterate on it in the future releases.
Enhancements to the Draw Tools:
-
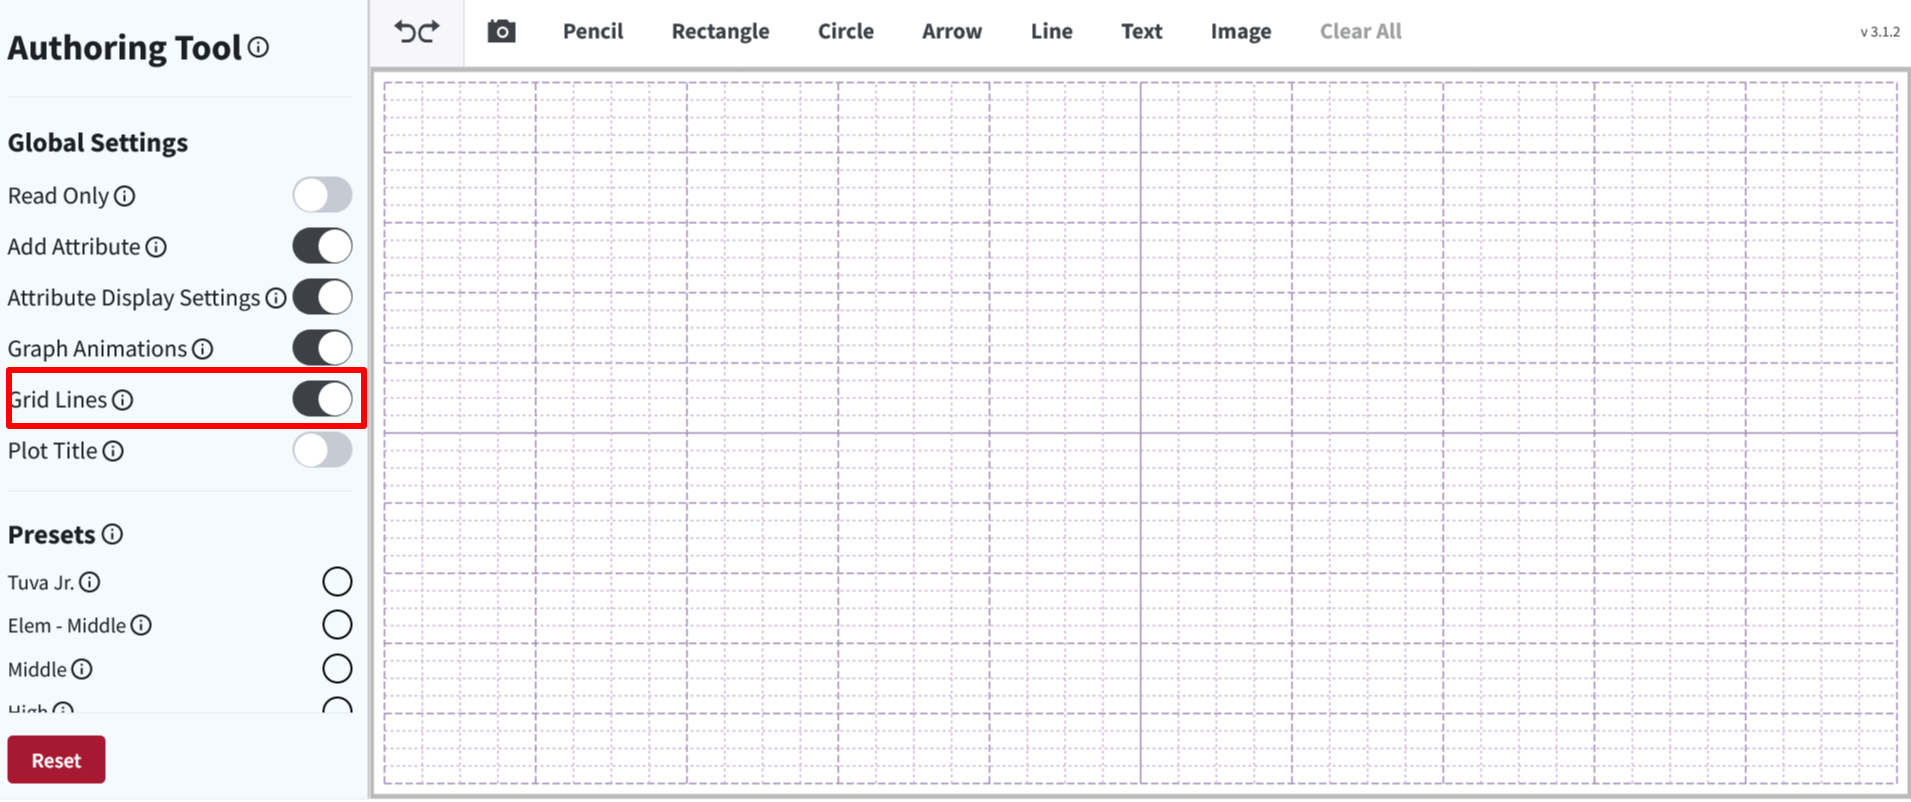
Grid Lines Display Toggle:
We have added a toggle in the Authoring environment to enable the gridlines for the Draw mode to allow for greater precision in drawing as well as creating the support for autograding in future iterations.
-
Fill Shapes Toggle:
We have added the option to fill closed shapes such as circles and rectangles in the Annotations context menu.
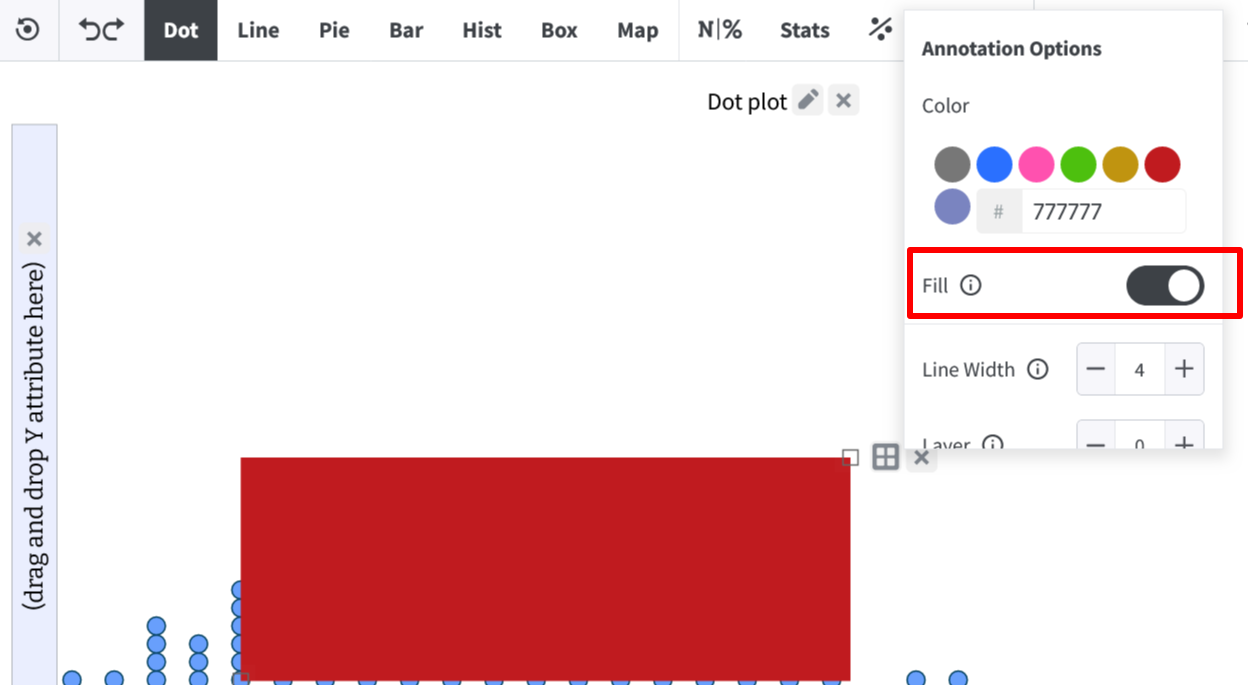
- Context Menu Update: We have removed the following options that were not relevant from the context menu in the Draw mode: (a) Labels and (b) Case Size.
Accessibility Enhancements:
As part of our ongoing commitment to accessibility, Tuva is conducting a comprehensive accessibility audit. The following items were identified and addressed in this release:
-
Reflow Legend Text on Zoom:
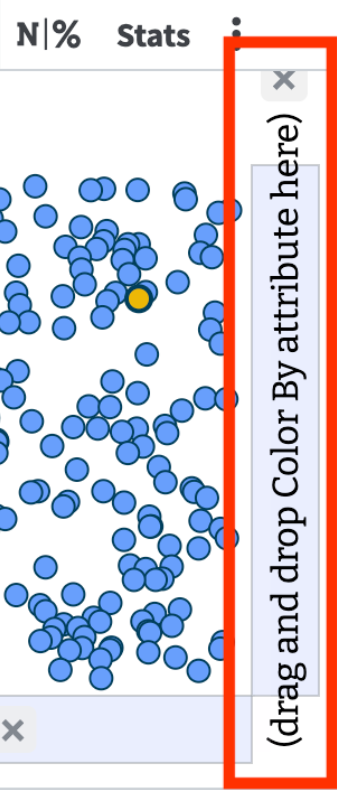
We have enhanced the drag-and-drop instructional text in the X, Y, and Legend drop areas to ensure it is always contained within the rectangle. After zooming in to 200%, the text for the X, Y, and Legend axes now reflows to fit within their containers.
-
Mandatory Text Fields:
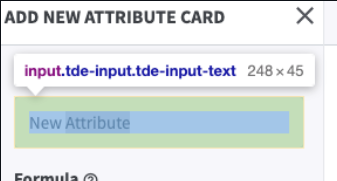
We have added the Required attribute to various text fields that require user input before proceeding. For example, the "Add New Attribute" card now has mandatory name and formula fields.
- ARIA Disabled Attribute for Menu Items: We have added the HTML tag attribute aria-disabled=true or false for menu items throughout the tools. This allows text-to-speech software to indicate whether the focused item is disabled or not.
-
ARIA Label for Info Icon:
We have added an ARIA label to the info icon that provides a summary about the dataset.

Bug Fixes:
- Stretched Bar Chart Display Issue: We found and fixed an issue in the Electricity Generation in the US dataset. The bug caused the stretched bar chart to visually display the 3rd bar as greater than 100%, even though its constituent sections correctly added up to 100%.