Tuva Tools v3.4.0
Released 3/10/2025
Version 3.4 of Tuva Tools brings significant enhancements to both Tuva's data tools and Tuva Jr. A key highlight of this release is the introduction of data insertion support in Tuva Jr. Additionally, this update reinforces Tuva's commitment to accessibility with improved contrast between interface elements and enhancements to keyboard navigation and focus.
Tuva Jr.:
-
Data Insertion in Tuva Jr.:
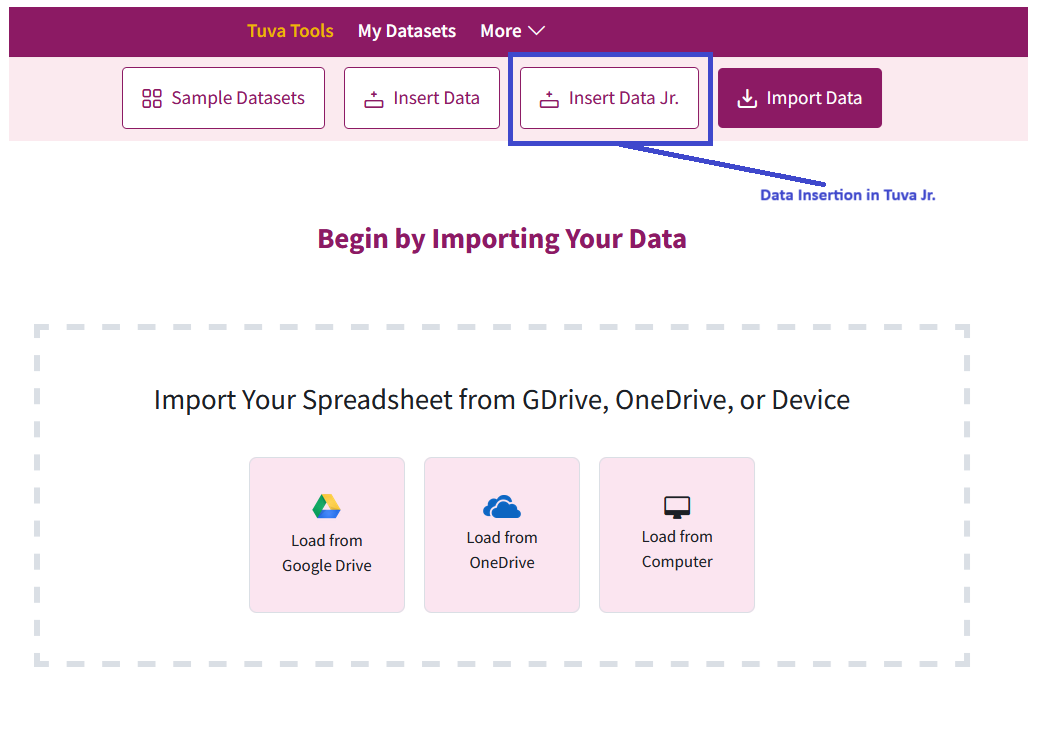
Recognizing that collecting and inputting data introduce several key concepts-such as data collection standards, data management, and organization-at an early stage for elementary students, we have added support for data insertion in Tuva Jr. Users can access this feature by clicking on the Insert Data Jr. tab.
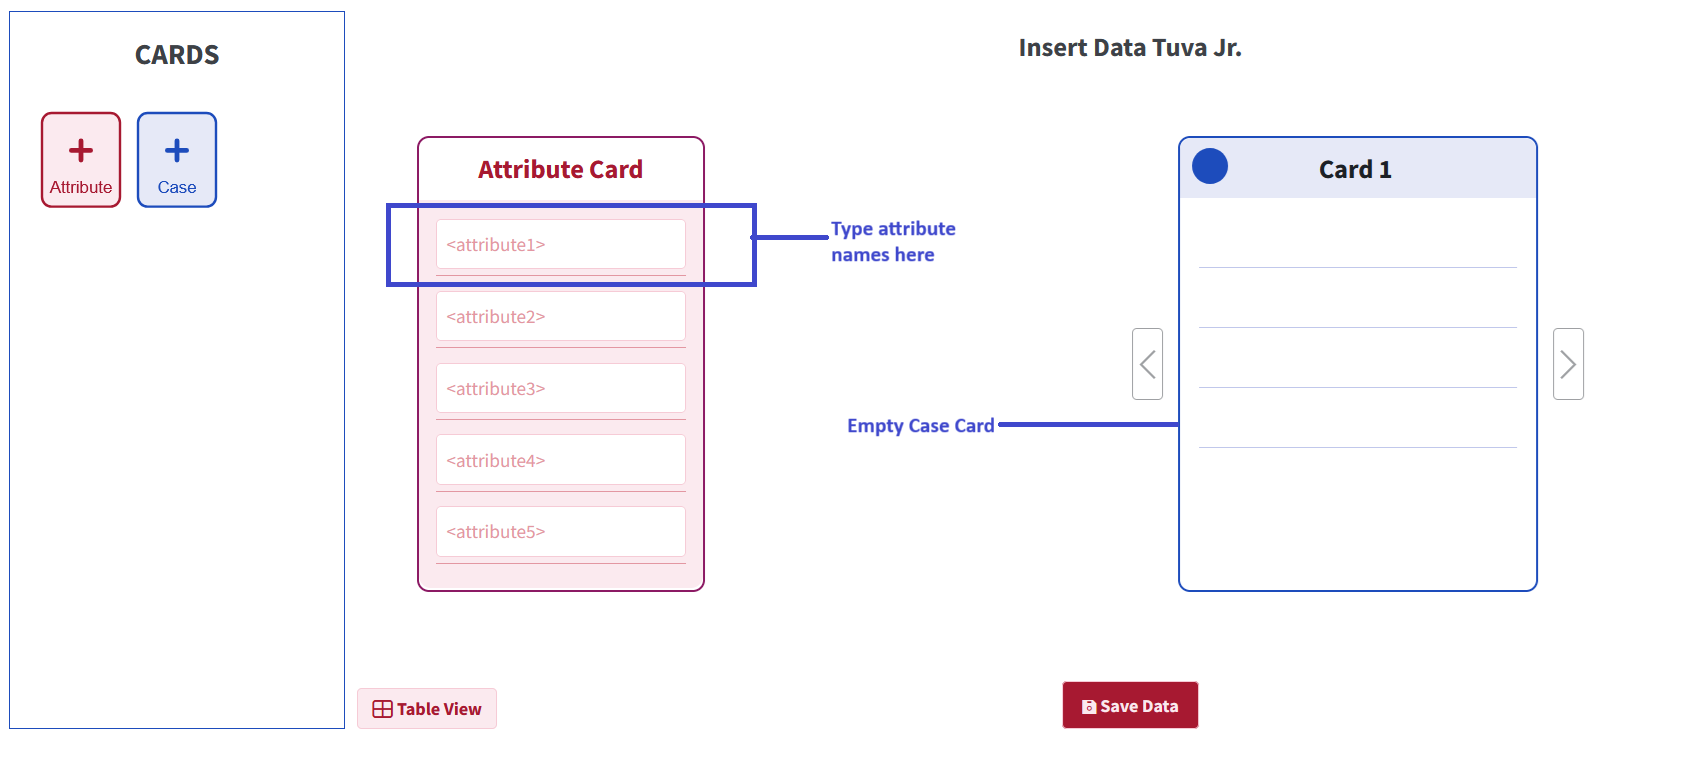
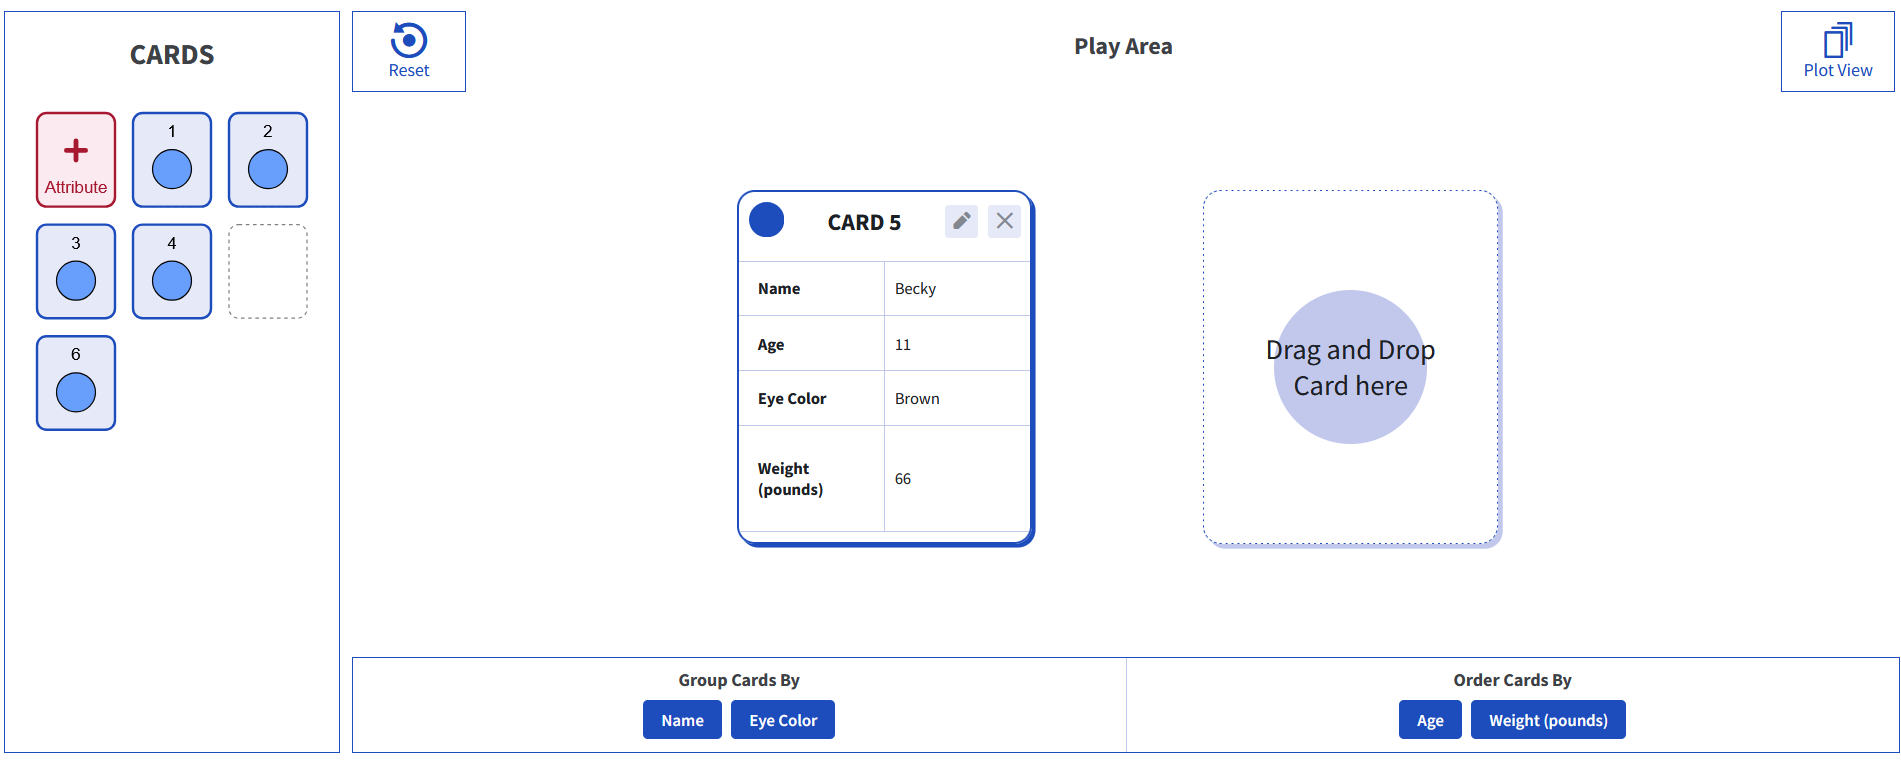
Once the user selects Insert Data Jr., the Play View loads with an Add Attributes card for entering attribute names, along with an empty case card.- The left panel (Home) displays icons for the Add Attributes card and the Case Card.
- The Table View and Save Data buttons appear at the bottom of the screen.
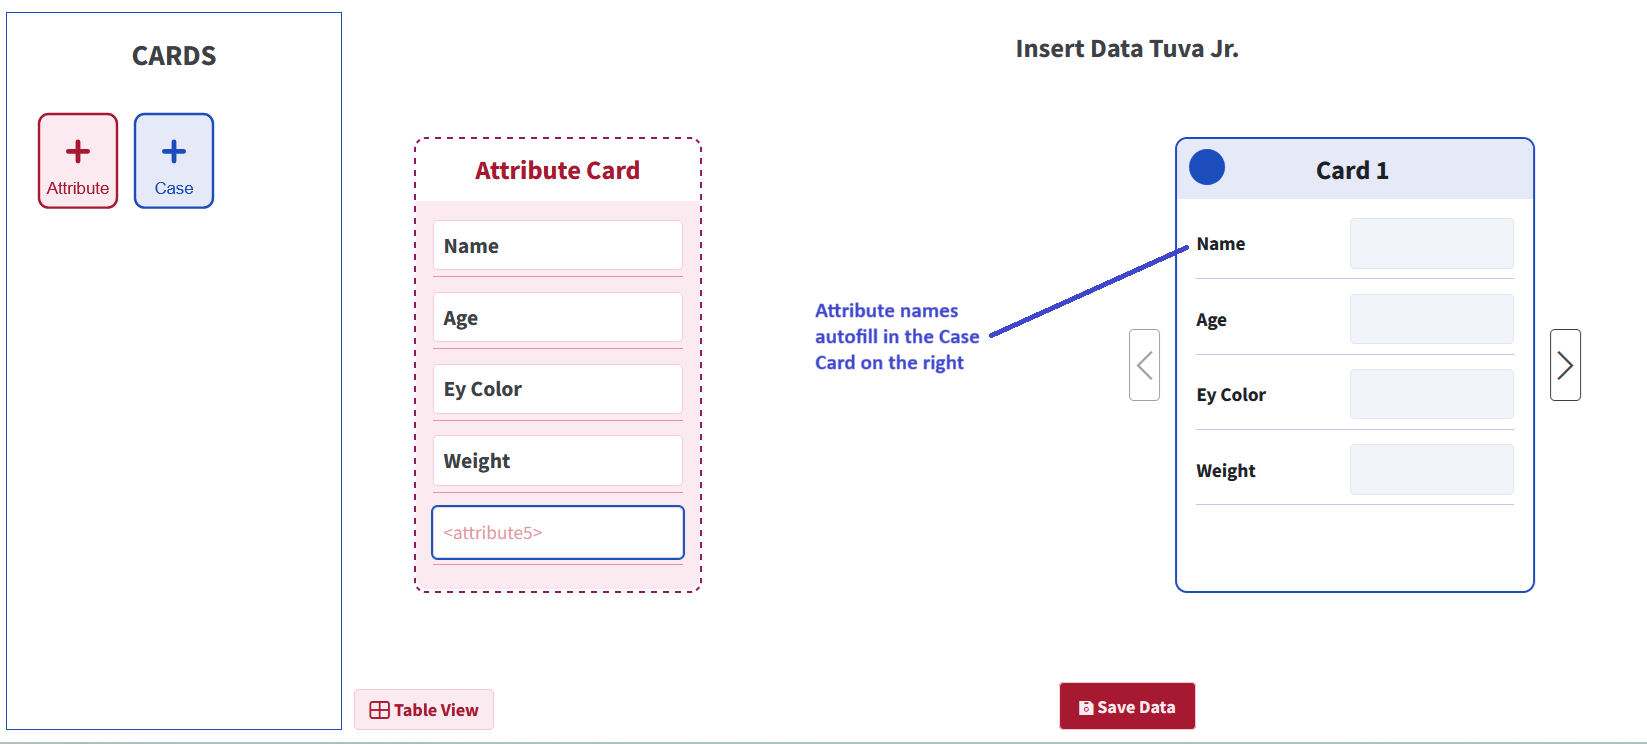
As the user begins inputting attribute names, the empty case cards on the right get autofilled with the same attribute names.
Adding a New Case Card: A new, empty Case Card can be added in two ways:- Click the Case button in the Home (left panel) to create a new Case Card.
- Use the carousel arrows to navigate to a new, empty Case Card.
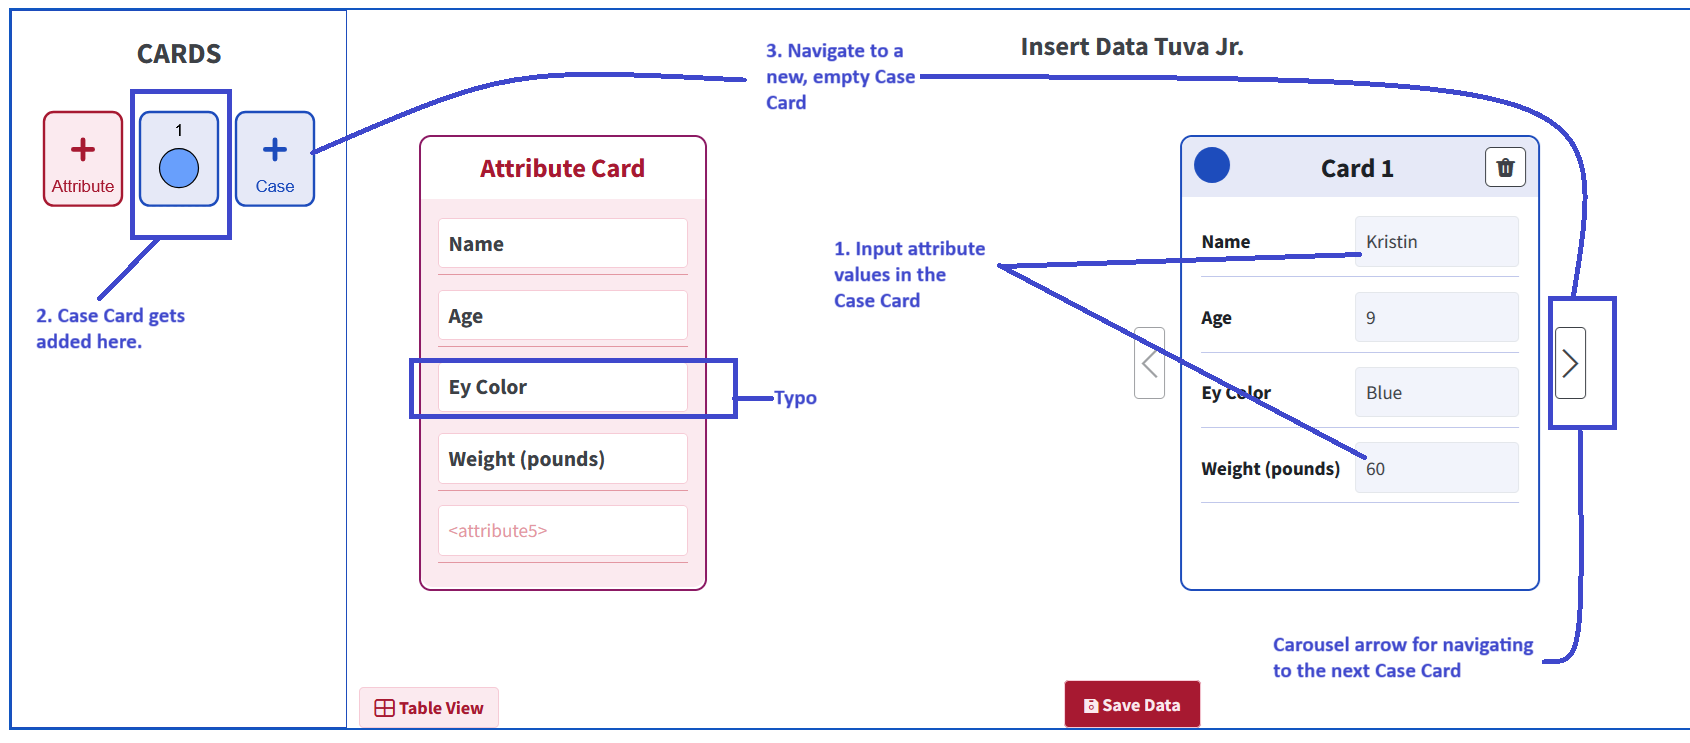
The user can update attribute names at any time during data entry. For example, in the case above, there is a typo in the third attribute name, which can be corrected as needed.
The user can navigate to the table view by clicking the Table View icon at the bottom left and continue entering data directly in the table.
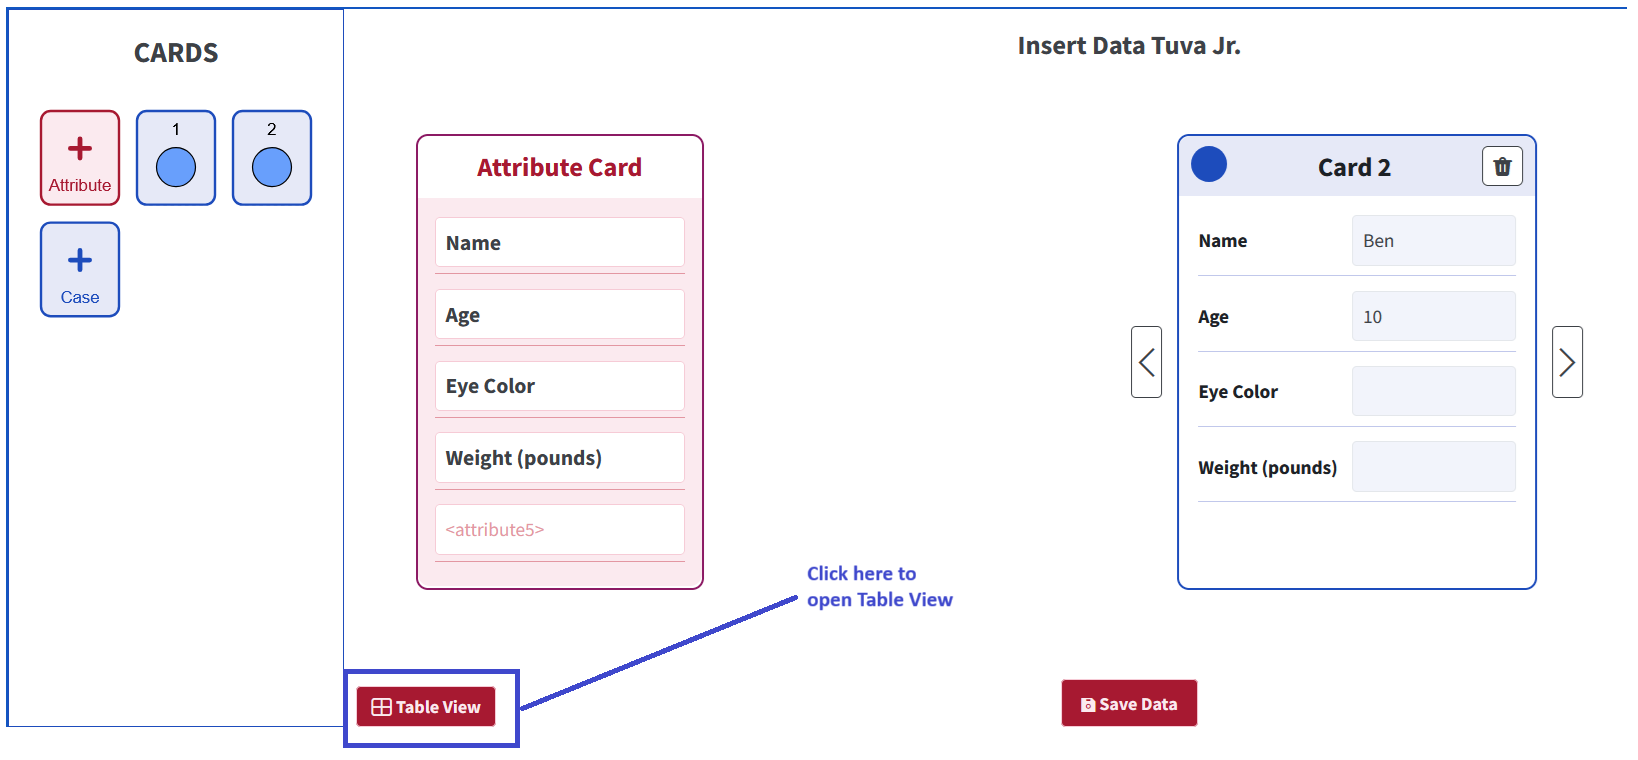
Clicking the button opens the Table.
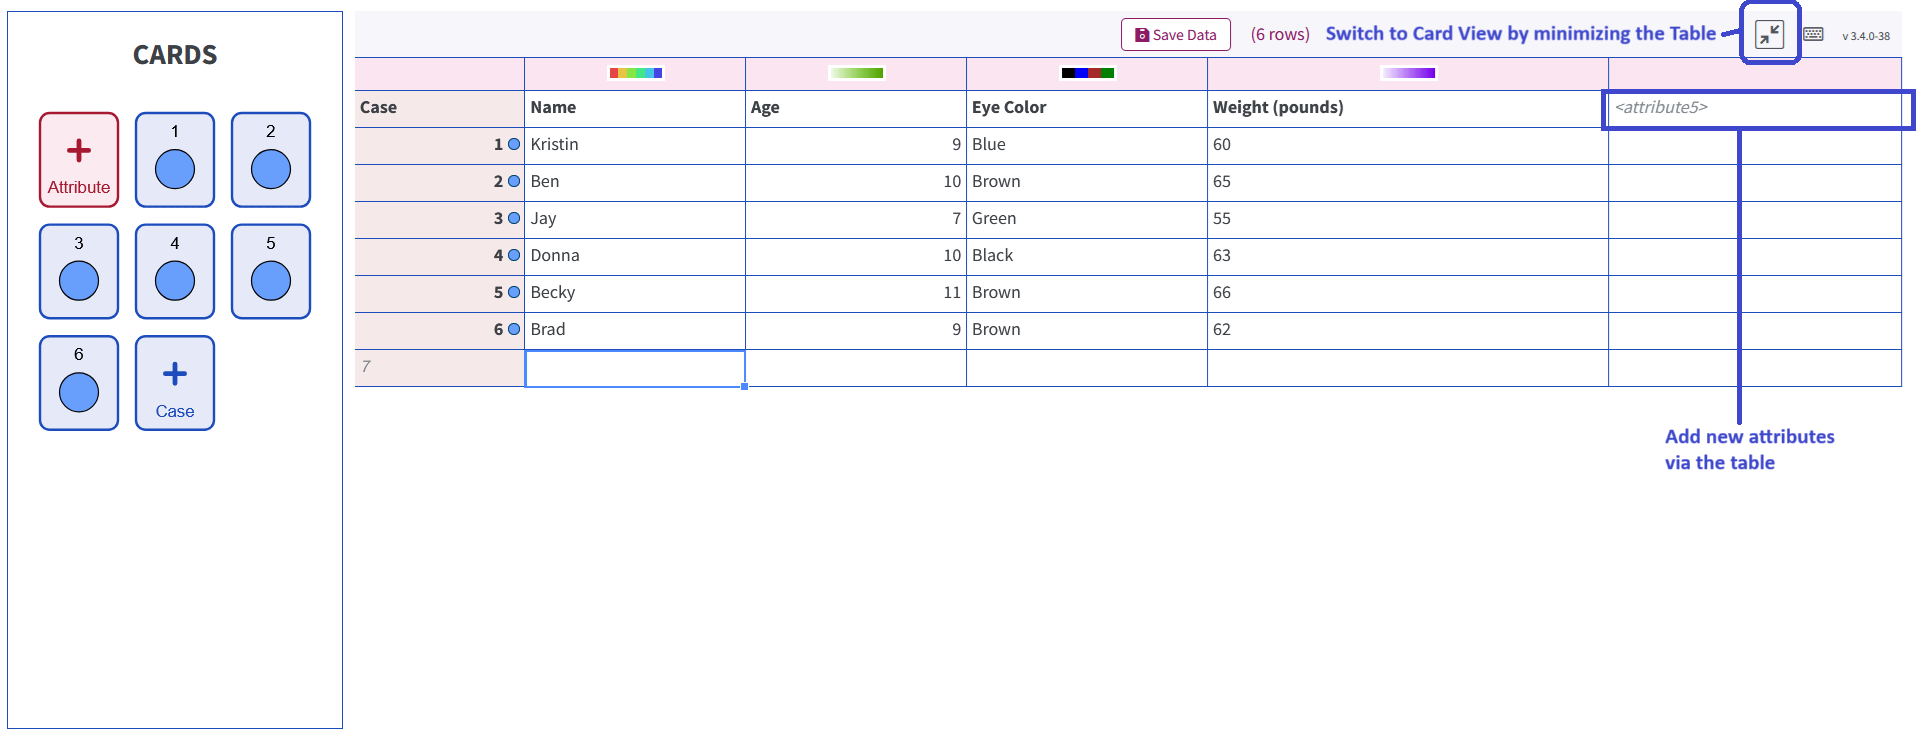
Users can seamlessly switch between the Card and Table views by minimizing the table.
After completing data entry, users can click the Save Data button, which is accessible from both the Card View and Table View.
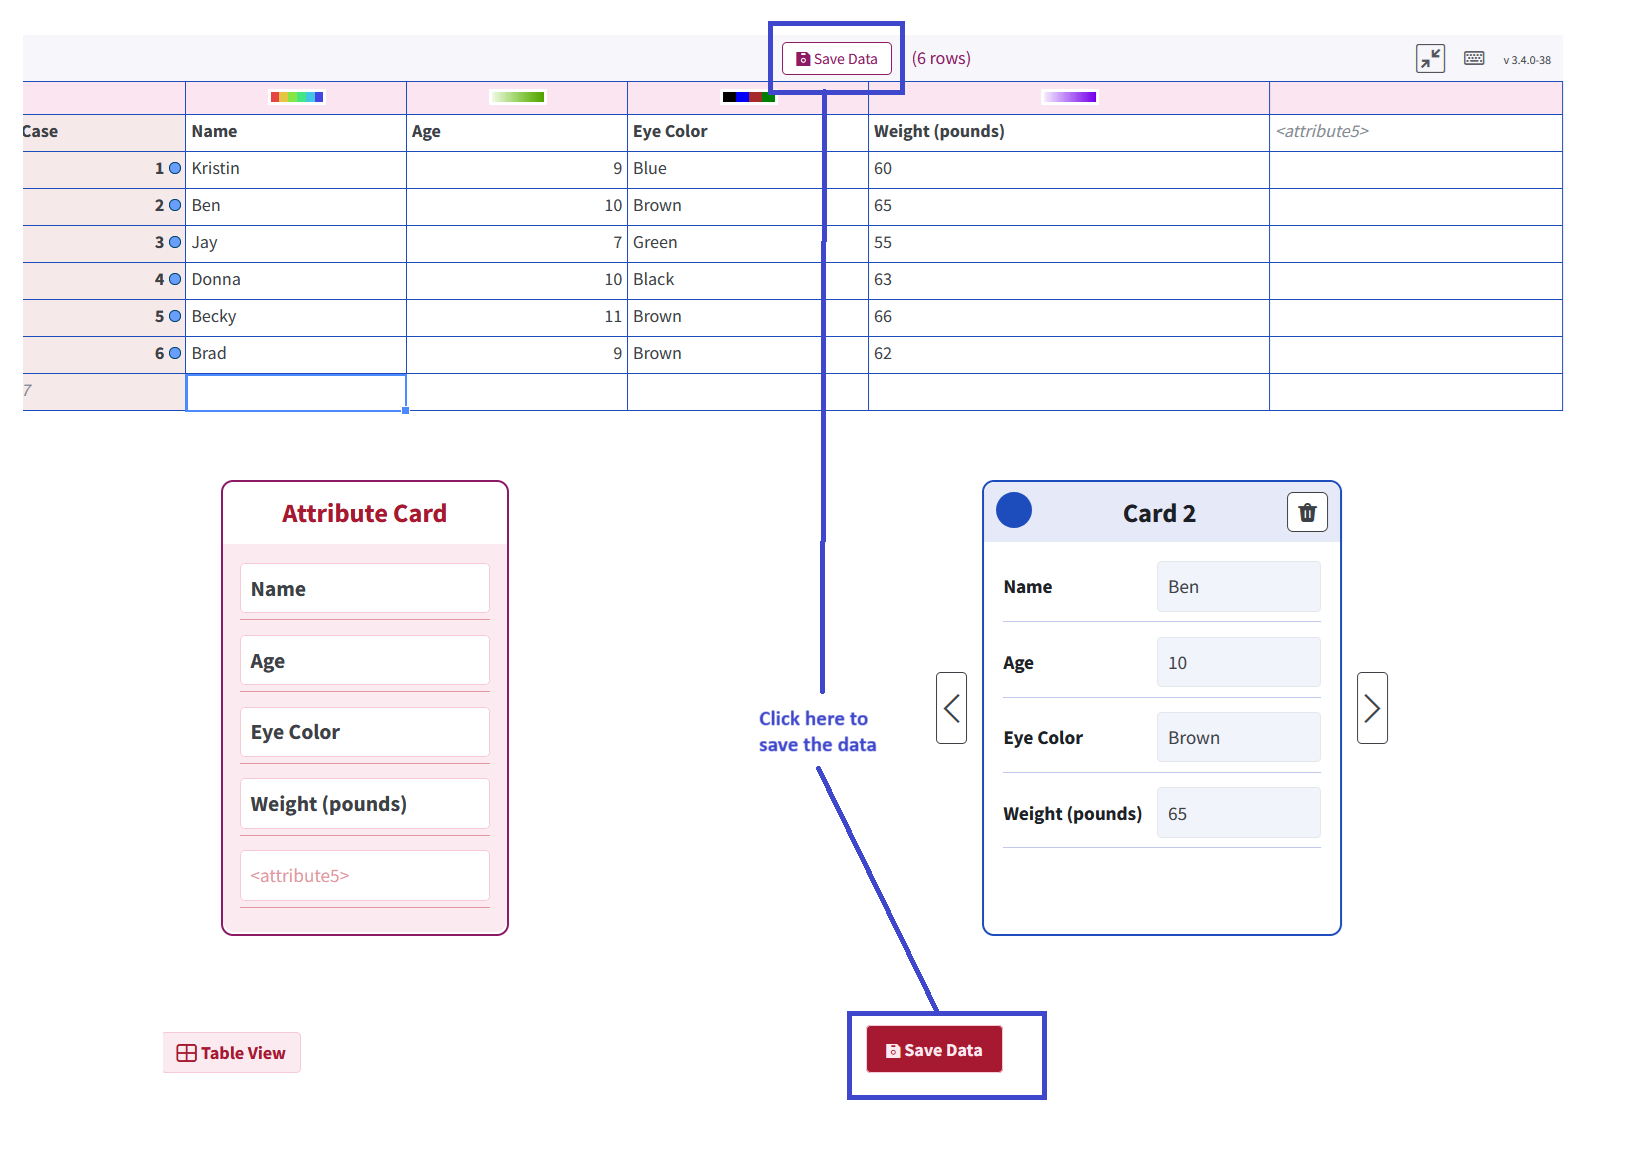
Clicking the Save Data button takes the user to the Review Page, where they can enter a dataset name, provide a description, and choose privacy settings. Once done, they can click the Import button to save the details.
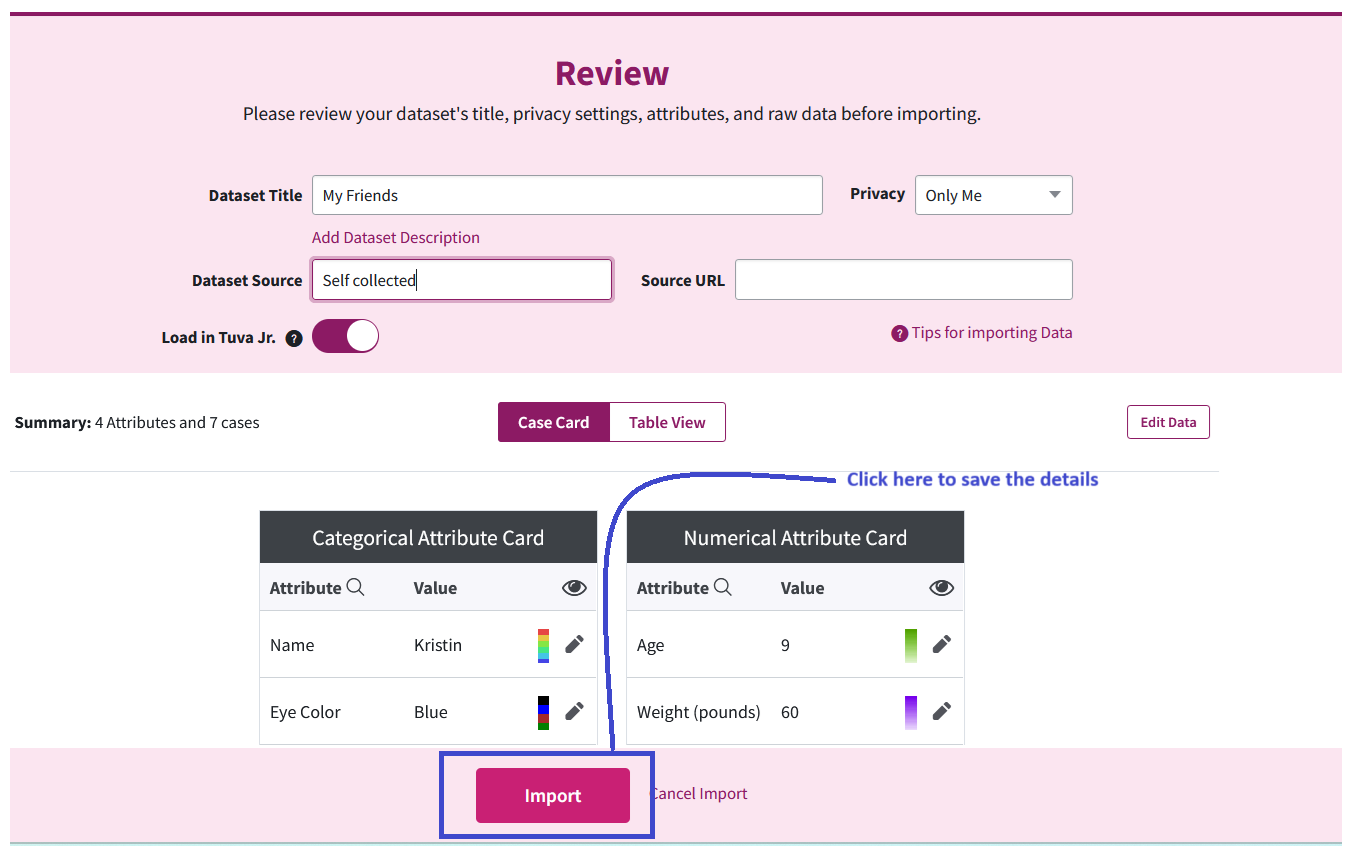
Clicking Import redirects the user to the Play View, where they can start exploring and visualizing their data.
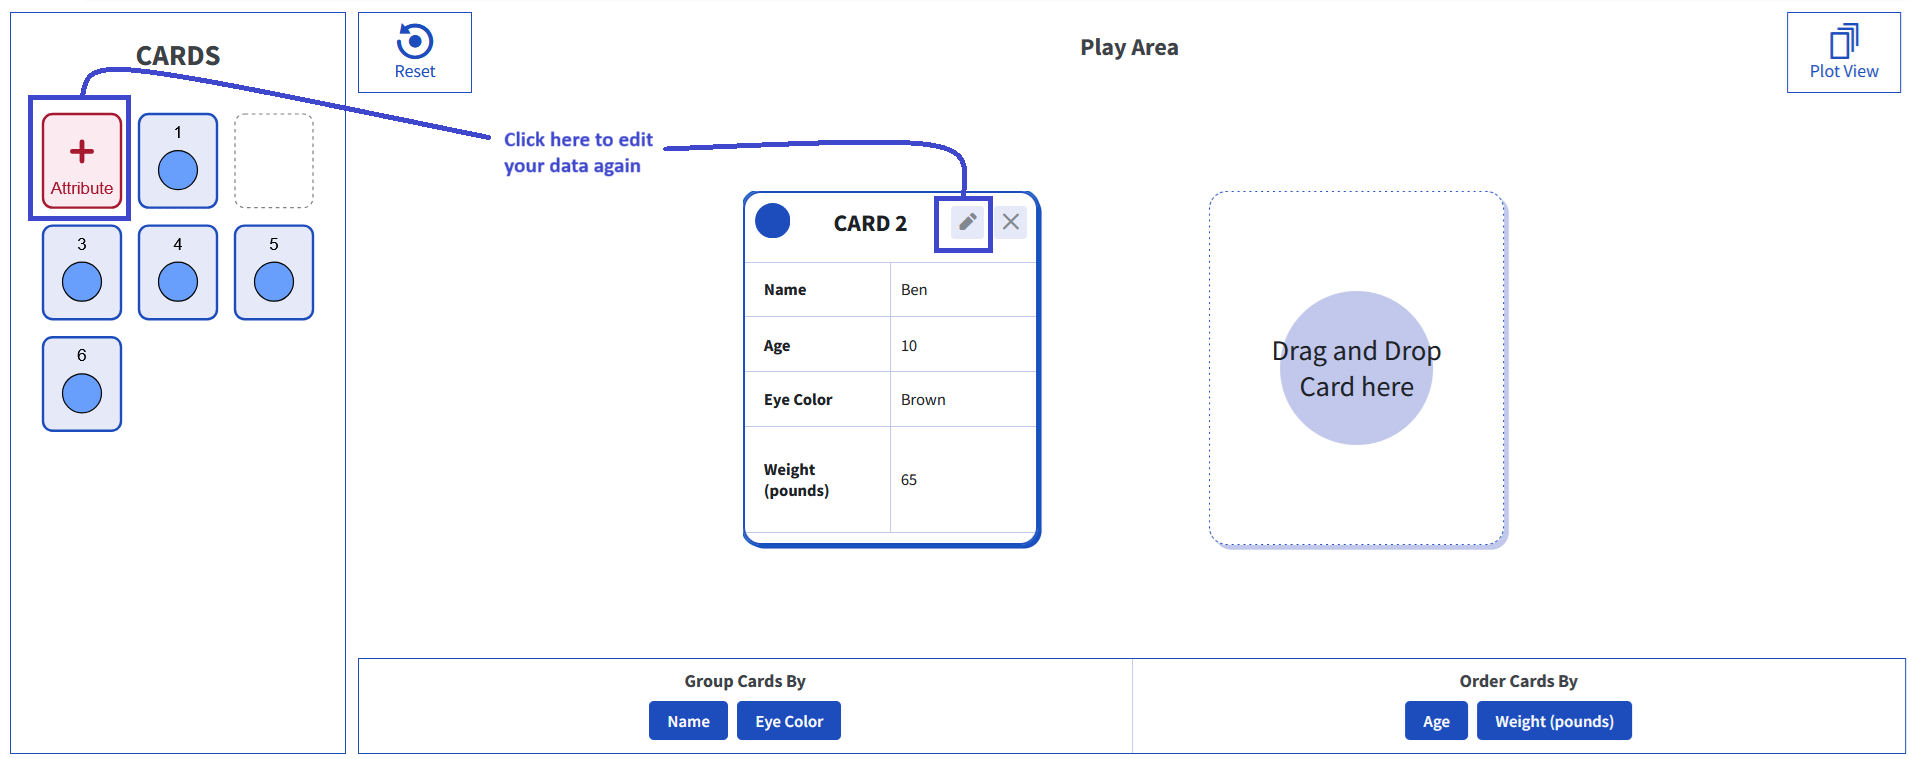
Users can enter Edit Mode by clicking the Edit button on the Case Card or selecting the Attributes Card icon in the Home panel.
Tuva Data Tools:
-
Order By Drop Zone:
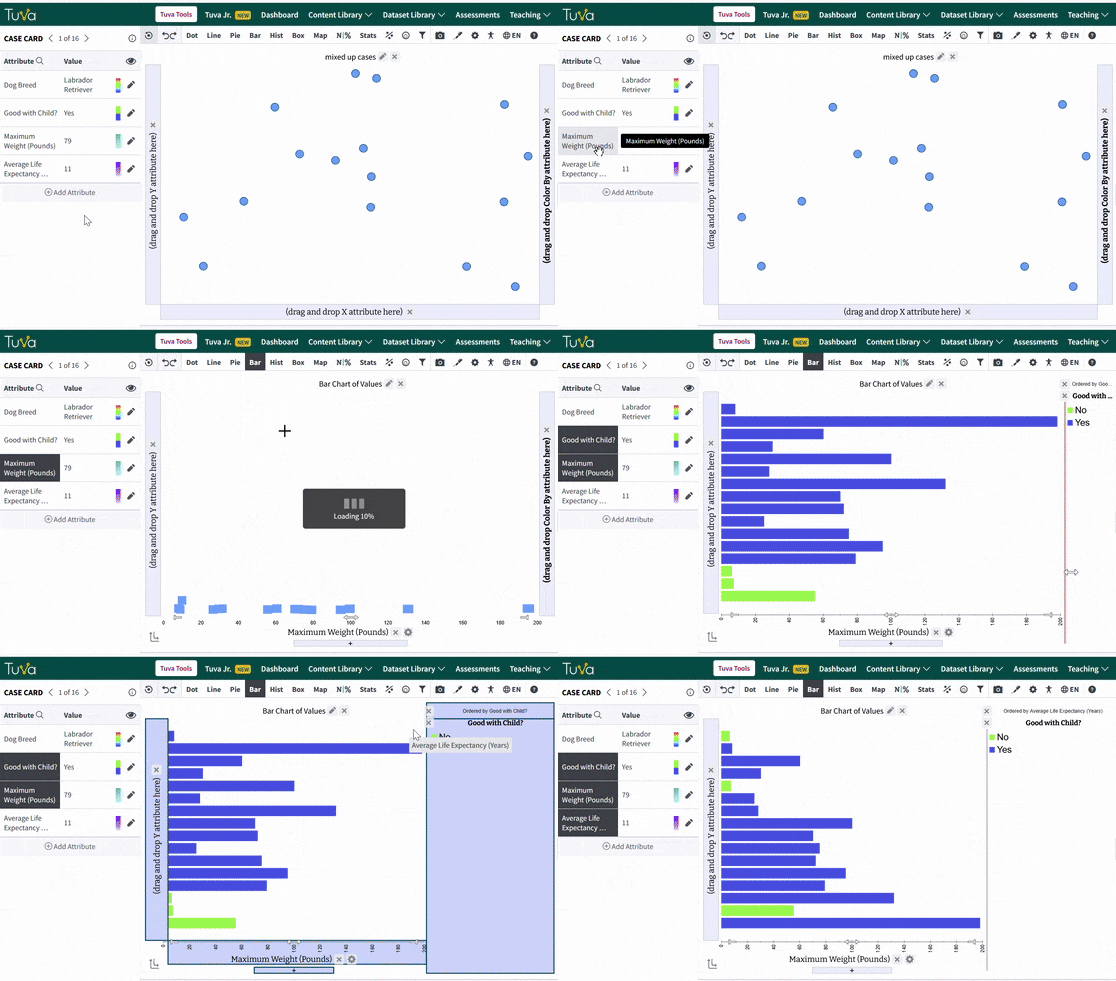
Previously, the Order By feature was hidden within the Plot Settings Card. Now, for all plot types that support the Order Cases By option, the Order By display above the legend functions as a drop zone. Users can simply drag and drop an attribute from the Case Card into this zone, improving usability and accessibility.
-
Improved Summary View for Model Functions f(x):
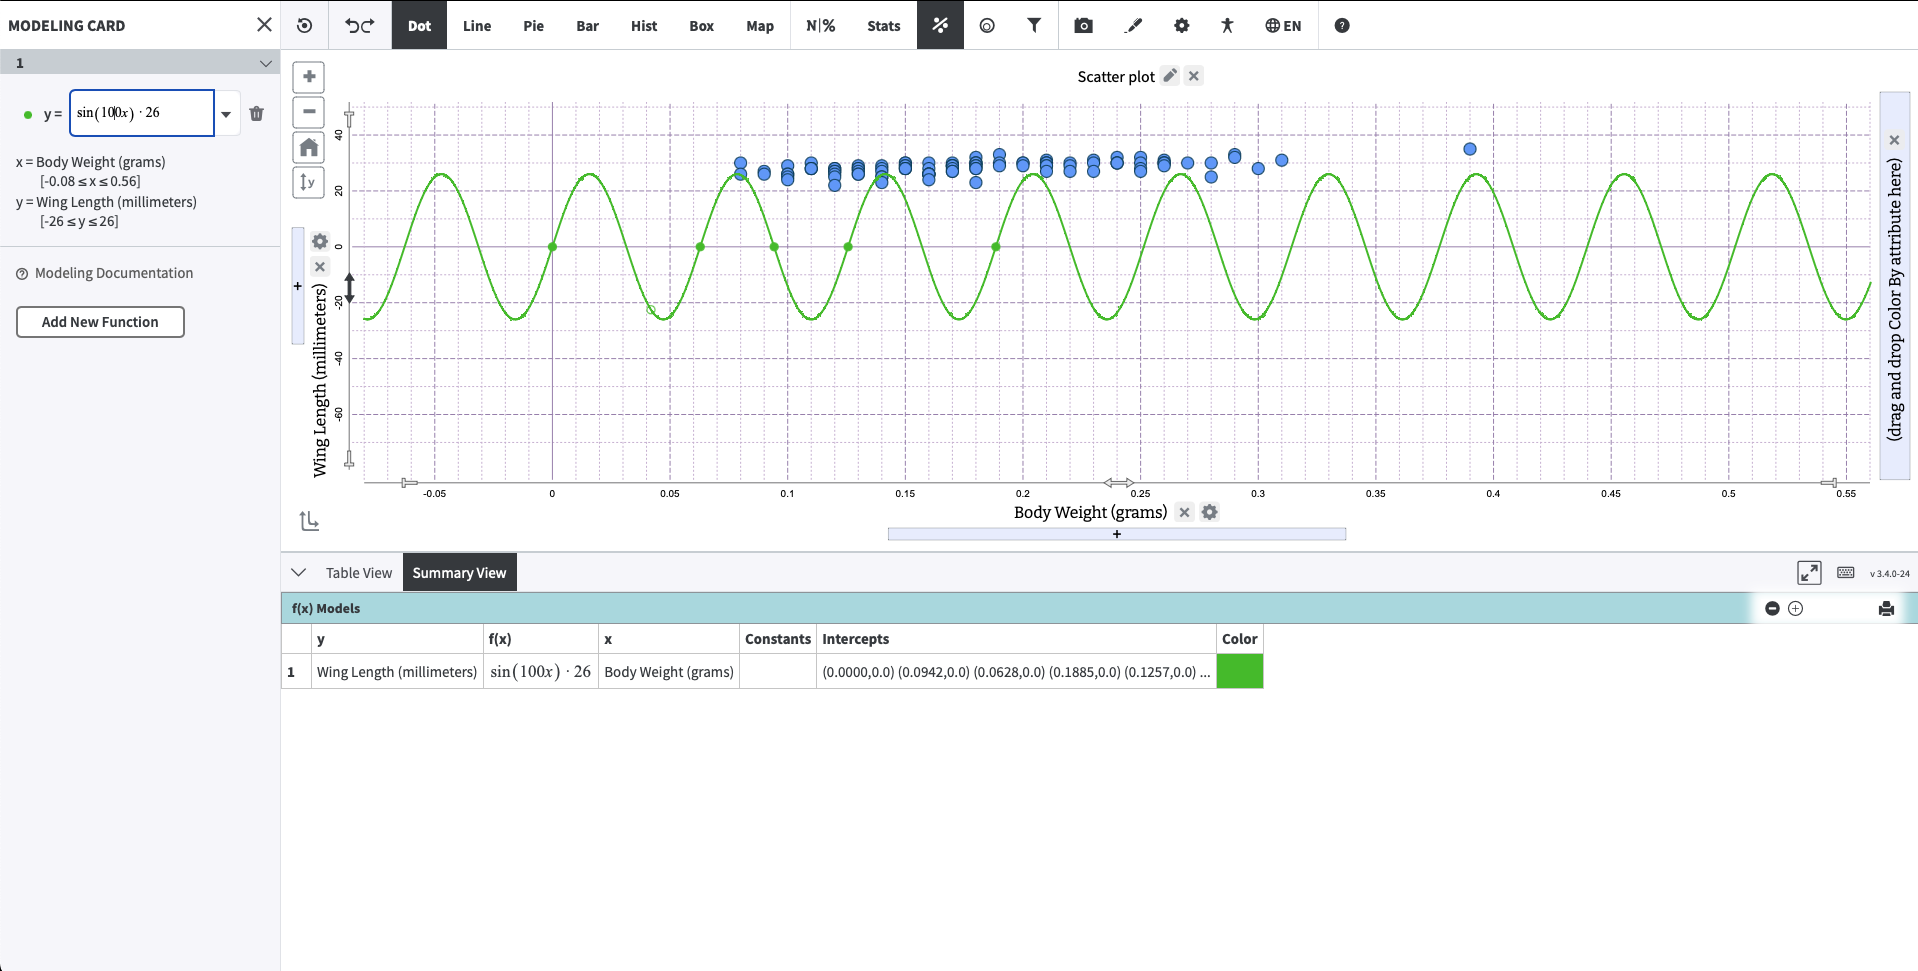
To improve usability for cyclical functions like sin(), where there are infinitely many correct values but only a small subset is generated:
- An ellipsis (…) will be added to indicate more possible values.
- Values will be limited to those within the visible axis range if at least five are visible.
- If more than five values fall within the visible range, only the first five will be shown.
-
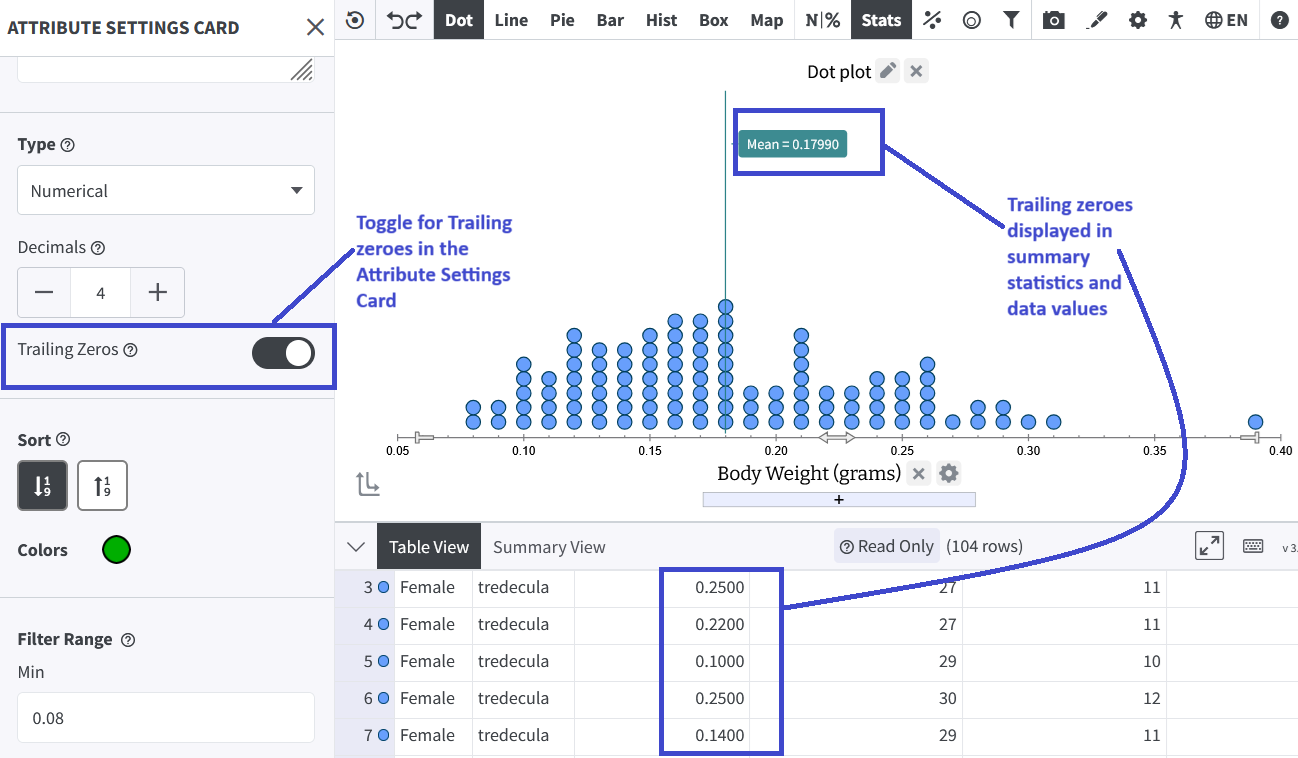
Display Trailing Zeroes:
Previously, the display of significant digits was unclear when trailing digits were removed. To improve clarity:
- Trailing zeros will now always be shown in all calculated numbers across the Plot View, Summary View, and Summary Statistics, including statistics and model data values (e.g., F(x) and Movable Line).
- A "Show Trailing Zeros" toggle has been added to the Attribute Settings card for numeric attributes, located next to the Decimals setting. This gives dataset authors explicit control over the display of trailing zeros.
-
Enhancements to Draw Mode and Annotations:
- Undo/Redo Improvements: The undo/redo functionality has been expanded to support all edit actions available in the Annotation context menu, including changes to color, line width, and other modifications. Additionally, users can now undo or redo image pasting, making the editing process more flexible and efficient.
- Optimized Save/Restore: The save and restore process for images, text, and points has been optimized to use less storage while maintaining performance. Repeated actions are now consolidated into a single undo/redo step, reducing unnecessary steps and improving efficiency.
- Bug Fix: A bug has been fixed where dragging an image rectangle for the first time did not expand correctly to match the drawn rectangle. With this fix, image rectangles now behave consistently with other objects in the draw mode.
Accessibility:
-
Improved Contrast for Different Elements:
- Stats Label Text Adjustment: The text color for Mean, Mode, Standard Deviation, and Variance has been adjusted to improve readability.
- Improved Contrast for Category Selection and Legend Elements: When selecting categories on the Legend, X-Axis, or Y-Axis, a background rectangle now appears with reverse contrast to enhance visibility. Additionally, the Legend Separator, border color, and scrollbar color have been updated to improve contrast and meet accessibility standards.
- Minor Gridline Contrast Update: The minor gridlines have been adjusted to achieve the desired contrast level, enhancing clarity without overwhelming the main gridlines.
- Support for Keyboard-friendly Annotations: Pressing Enter on the keyboard now adds the annotation directly to the plot area and automatically selects it, ensuring immediate focus for easy modification.