Tuva Tools v2.12.1
Released 1/27/2022
We bring you a brand new statistic in this release: the Mean Average Deviation along with a couple of bug fixes.
Added:
-
Mean Average Deviation (MAD): You can now quantify the spread of a
distribution using a brand new statistic called the Mean Average Deviation. You can access
MAD from the Stats menu in the toolbar or by using the keyboard shortcut.
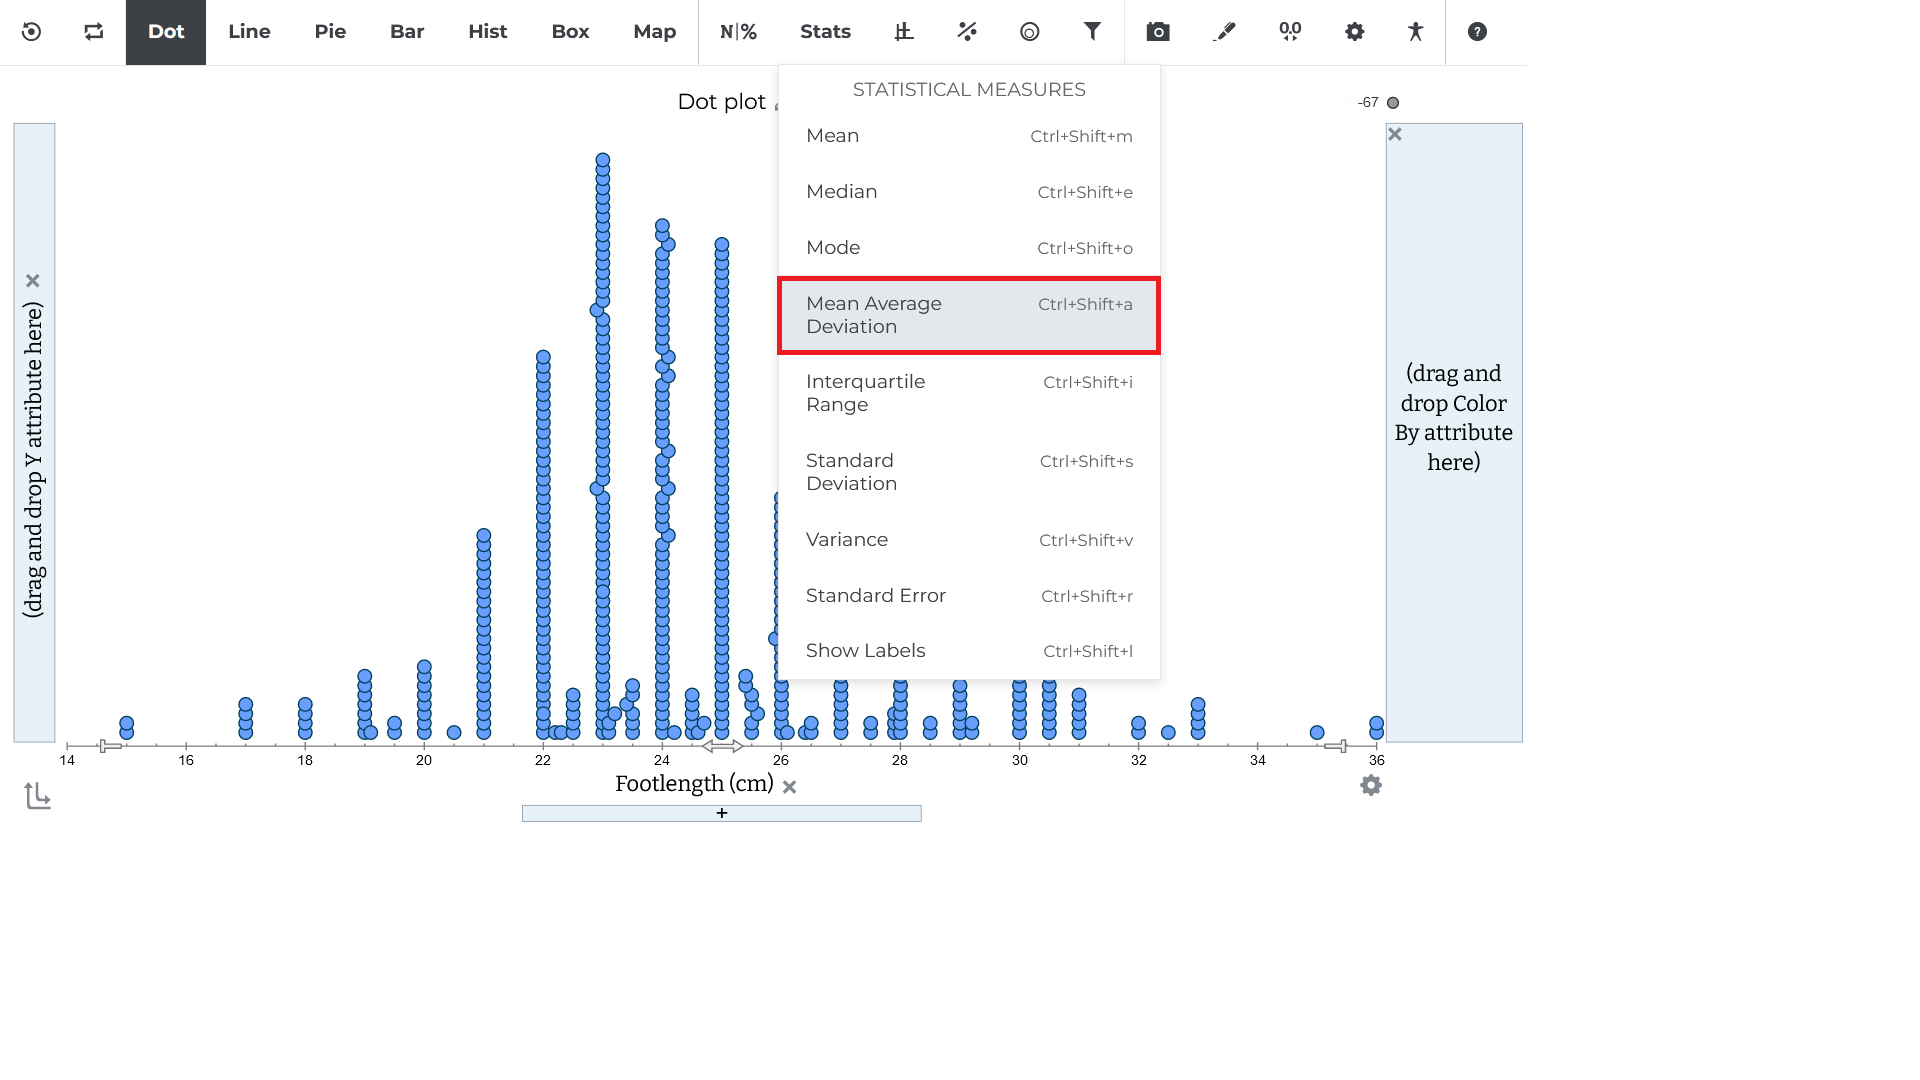
When you choose it, you will see the following display:
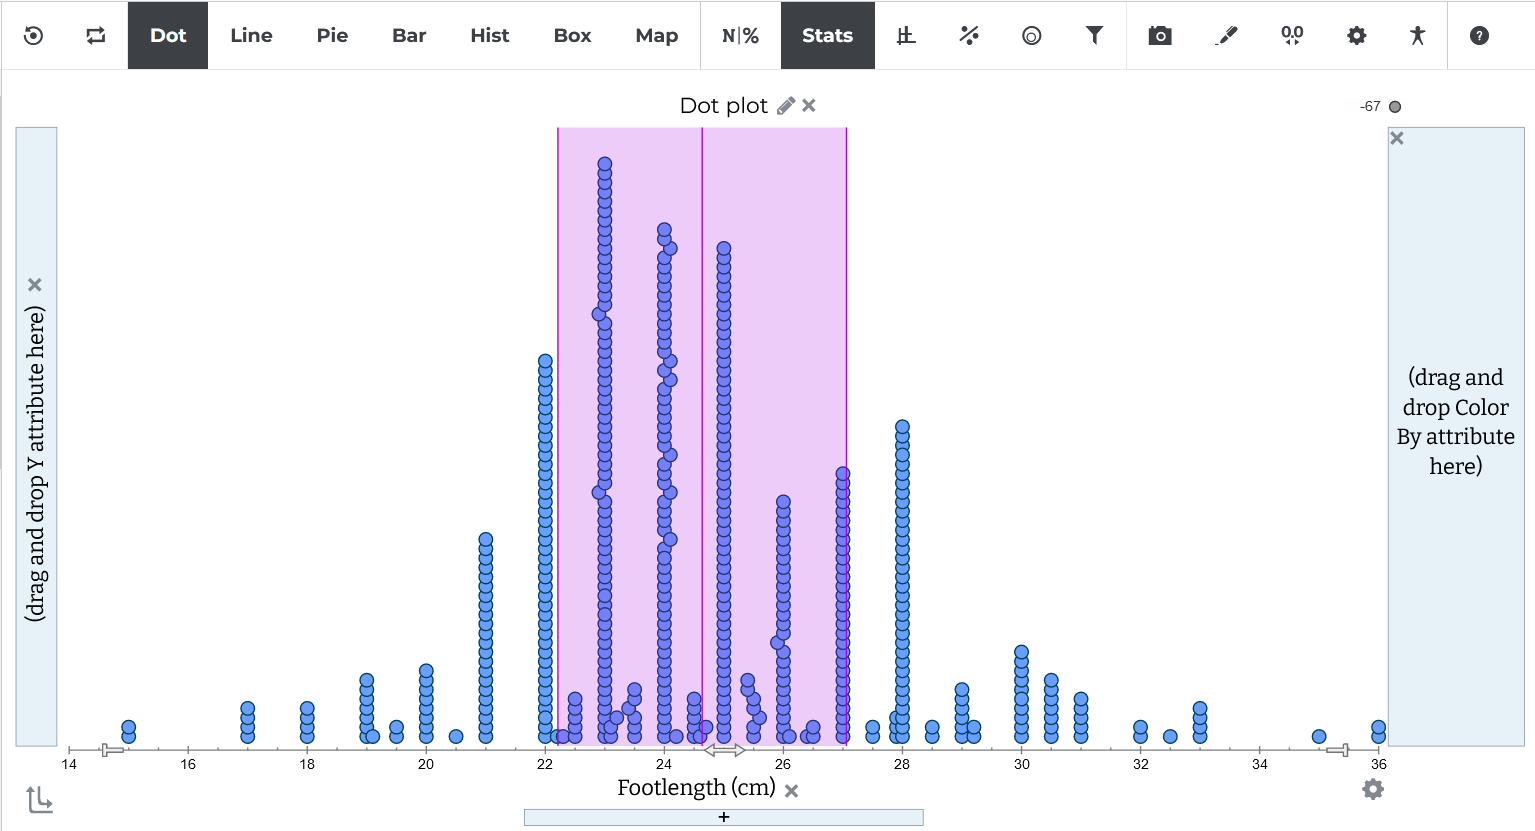
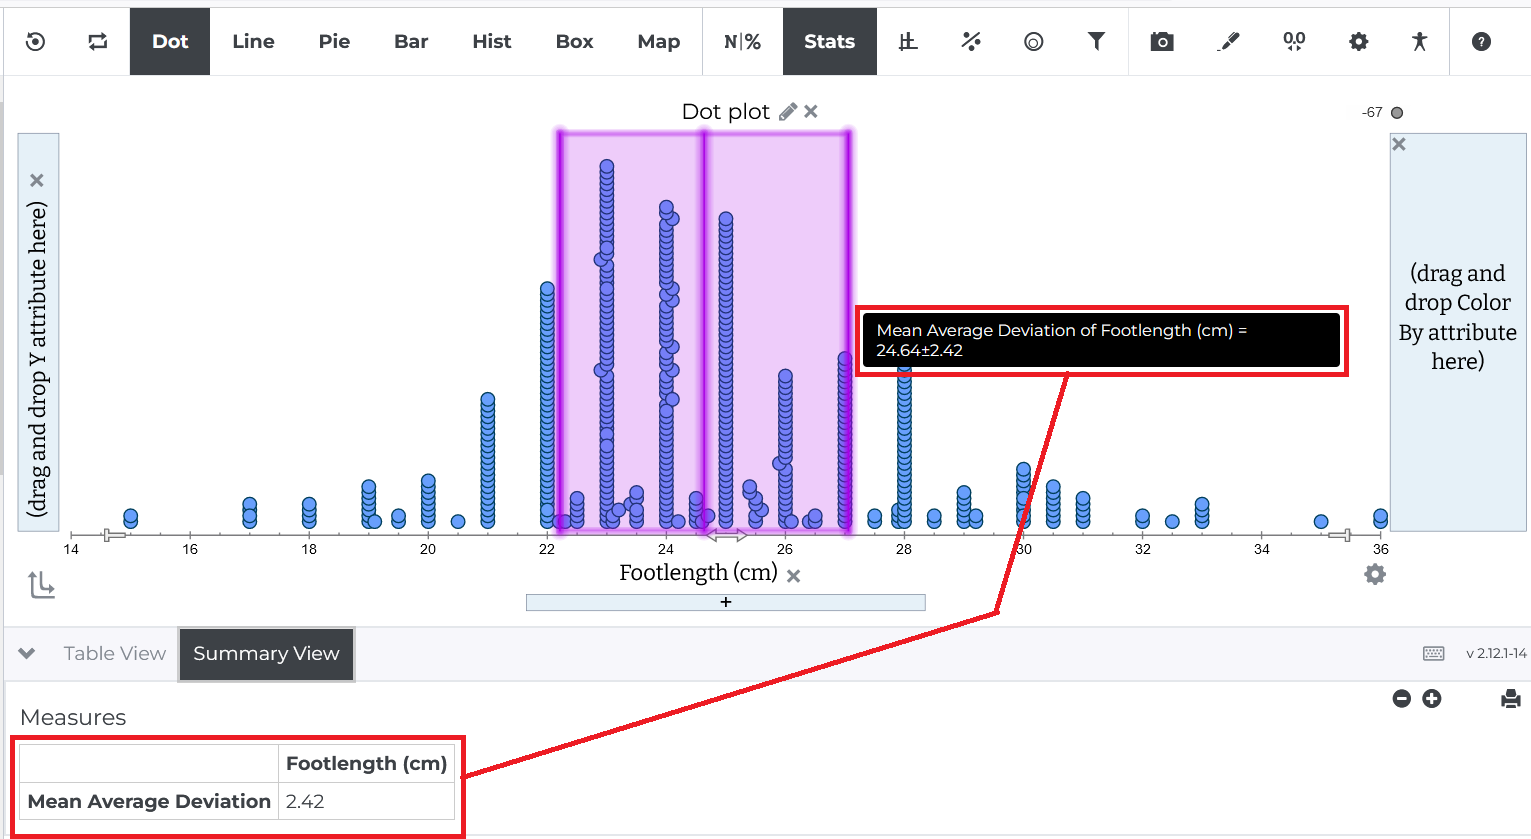
You can hover over the display to read the value of MAD in the tooltip or pull up the Summary View to do so.
Changed:
-
Summary View: We have made a few changes to the Summary View for
scatterplots fitted with a line to make it easy for you to view and read the equation of the
desired line.
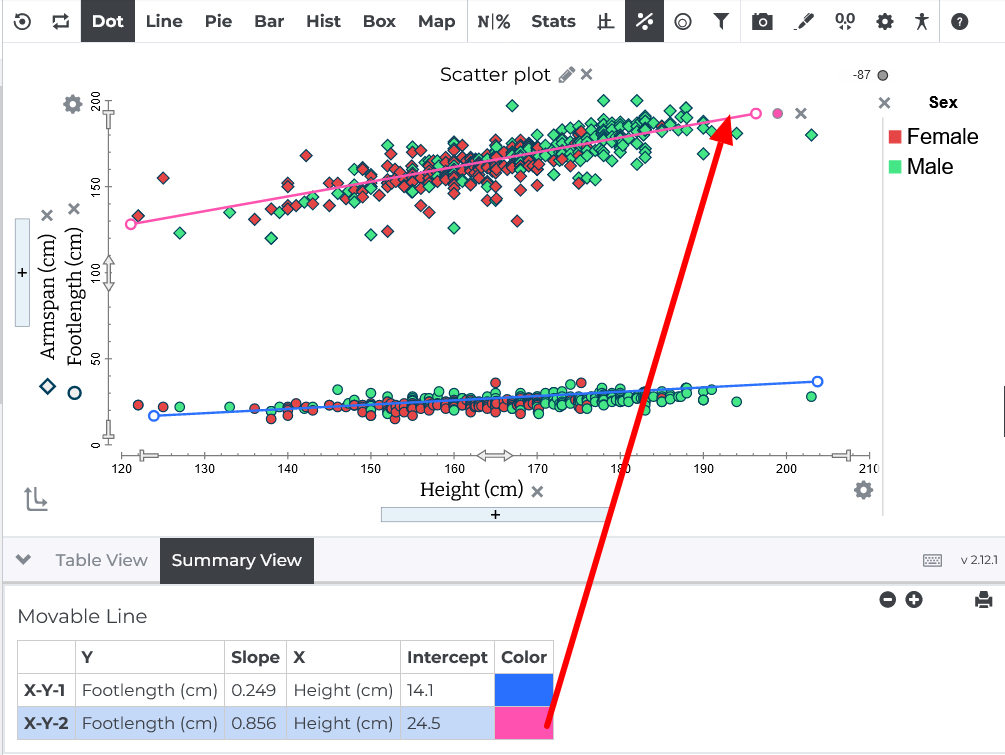
Now, when you select a Movable Line in the Plot, instead of only the first cell, the entire row in the summary view gets highlighted.
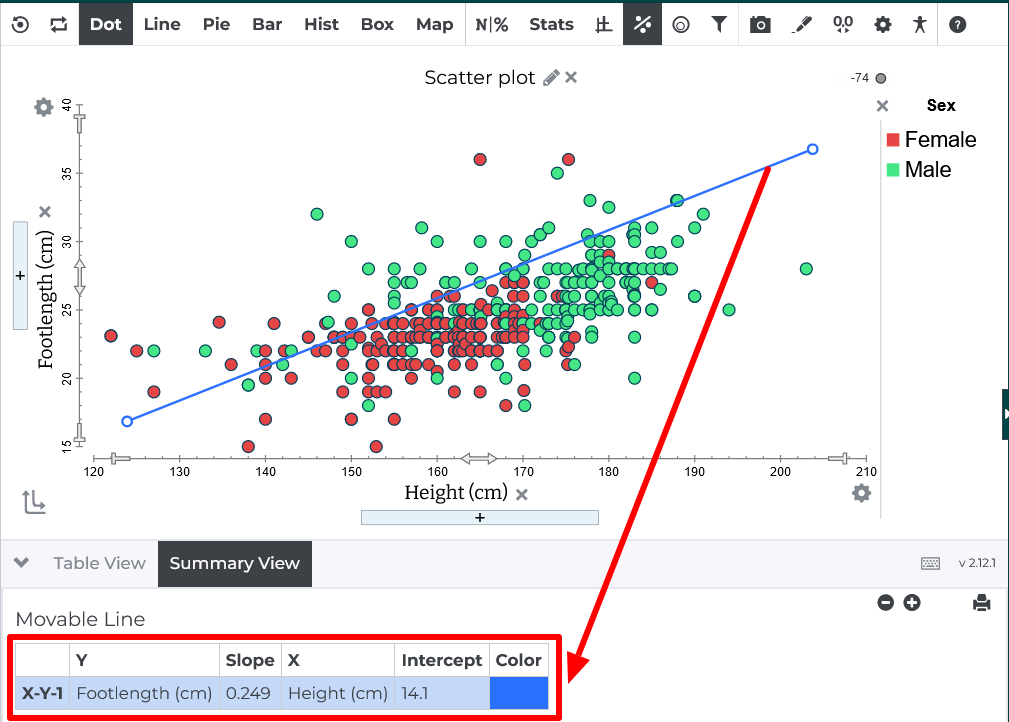
Further, if you select a row in the Summary view, the corresponding line in the plotting area gets selected.
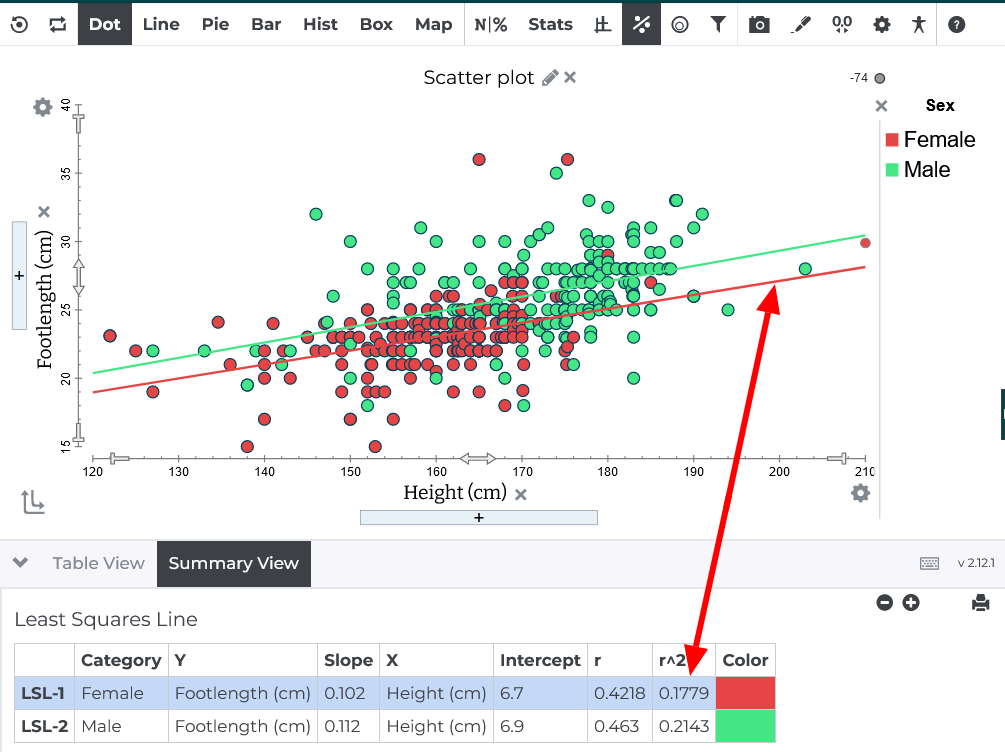
This works in the same way for the Least Squares Regression Line (LSRL), that is, if you select the LSRL in the plot, the corresponding row in the Summary View gets highlighted and vice versa.
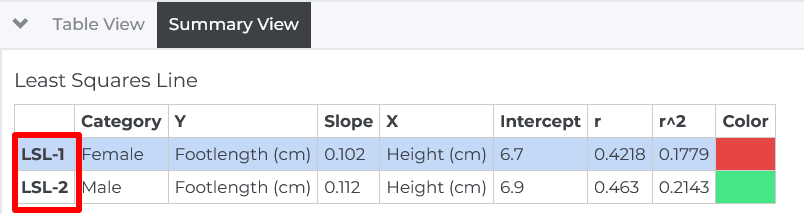
You will also see that each LSRL has a unique identifier or label in the Summary View to help you better distinguish between them.
Bug Fixes:
- Plot State: We fixed two bugs associated with restoring a saved plot state. Now, when you restore a saved plot state the annotations scale properly and any adjustments you make to the thickness of the legend before saving the plot is honored on restore.