Tuva Tools v4.1.0
Released 6/11/2026
Tuva Tools 4.1.0 brings a significant capability to the data exploration experience: right-click context menus across every chart type and overlay. Where actions with several graphs and objects previously required finding the right controls buried in submenus and cards, they are now accessible directly from the element students are working with. This release also improves visual consistency across plot elements, strengthens the formula editor with a new keypad, and resolves a set of bugs affecting charts and table behavior.
As in every release, 4.1 continues Tuva's commitment to accessibility, with improvements to keyboard focus behavior, screen reader support, and assistive technology compatibility across the tool.
New Enhancements
-
Context Menus Across All Chart Types:
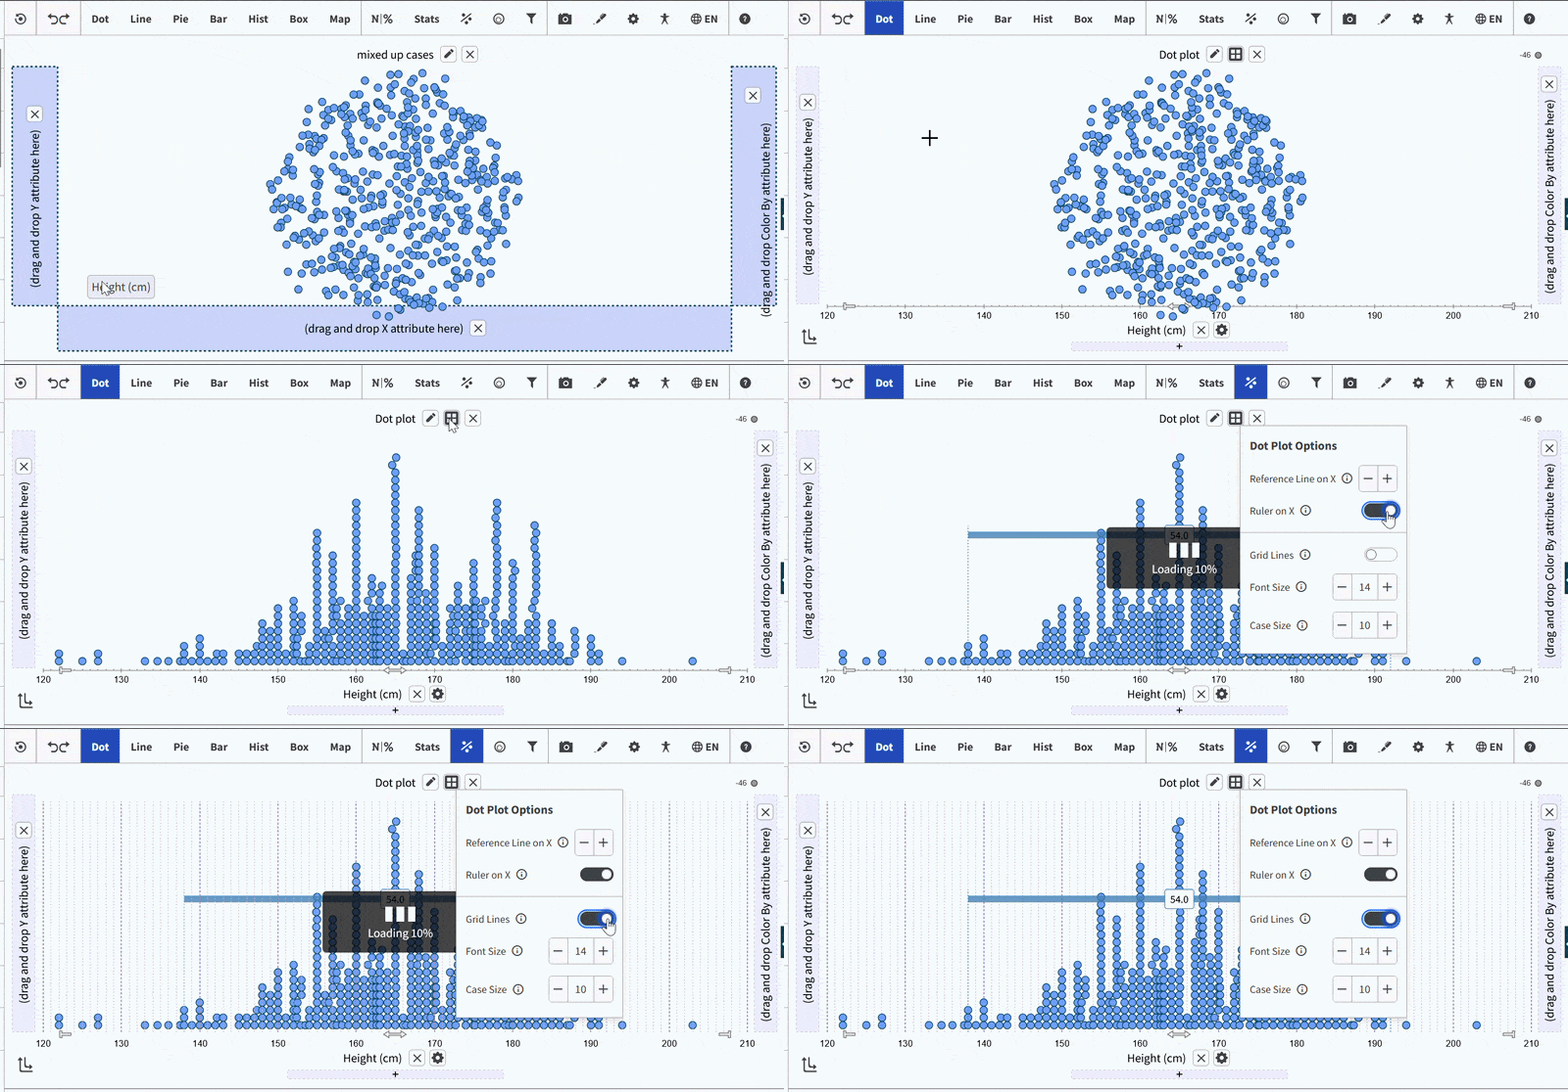
Every chart type in the data exploration area now has a right-click context menu that
surfaces relevant actions directly on the graph. Previously, many of these actions were only
accessible through the toolbar or through cards on the left, locations that weren't always
obvious, particularly for students new to the tool. The context menu brings those actions to
where students are already looking, reducing the need to hunt for controls and making the
tool's capabilities more discoverable. Context menus are available on:
- Charts: Dot Plot, Line Graph, Pie Chart, Scatterplot, Bar Chart, Box Plot, and Map Plot.
- Overlays and tools: Movable Lines, Reference Lines, Rulers, Standard Deviation bands, and Annotations.
-
Formula Editor Improvements:
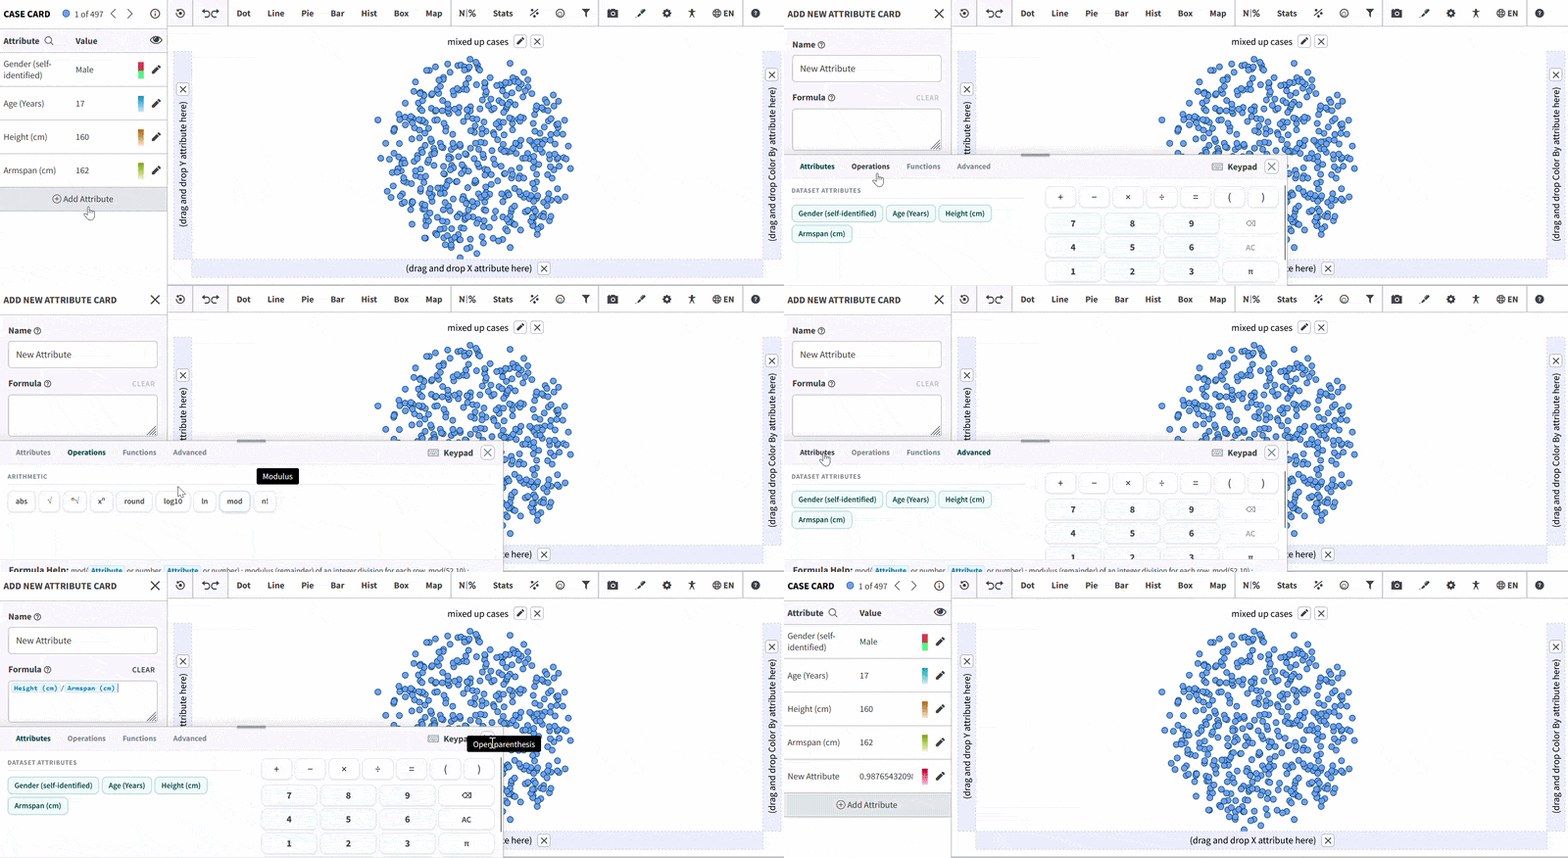
The attribute formula editor has been meaningfully upgraded in 4.1. A dedicated keypad lets
students insert formulas, constants, and attribute references by clicking rather than typing
them manually, lowering the barrier for students who are less comfortable with formula
syntax. The editor also includes richer editing controls overall, making it easier to build
and adjust computed attributes.
- Improved Text Sizing in Plots: Font sizes across plot elements have been standardized, giving graphs a cleaner, more consistent appearance. Pie chart labels in particular have been updated to consistently display at 16pt and rotate uniformly across sections — fixing a long-standing inconsistency where label sizes and angles would vary depending on the data.
Accessibility
4.1 continues Tuva's ongoing work to make the data exploration tool fully usable for all learners. This release includes improvements to keyboard focus behavior, screen reader labels, and assistive technology support across several parts of the interface.
- Info Icons Now Have Accessible Labels: Info icons throughout the interface now include proper ARIA labels that match their tooltip text. Screen readers can now describe what each icon means, rather than announcing a generic or empty label.
- Tooltips in Attribute Settings Cards Are Now Keyboard-Accessible: Tooltips in the Attribute Settings Cards and Add New Attribute Cards can now be triggered by keyboard users, not just mouse users.
- Missing Visible Labels Added: Several interactive elements that lacked visible labels have been updated. These elements are now correctly labeled both visually and for assistive technology.
- Categorical Attribute Settings Card Label Fix: The label in the Categorical Attribute Settings Card was not programmatically associated with its input field. It is now correctly linked, so screen readers announce the label when the field receives focus.
- Focus Returns to Parent After Closing Panels: When a student dismisses a dialog or closes a panel using the keyboard, focus now returns to the element that originally opened it. Previously, focus would drop to an unpredictable location, requiring users to re-navigate.
- Focus Trap in Accessibility Settings Modal: The Accessibility Settings modal now correctly traps keyboard focus while it is open. Previously, keyboard users could inadvertently navigate out of the modal to content behind it.
- Slider Values Announced Correctly on Windows 10: On Windows 10, screen readers were announcing slider values that were slightly off from what was displayed on screen. The announced values now match the visual display.
Bug Fixes
- MathJax in Attribute Names Broke Dataset Tooltips: When an attribute name included MathJax notation, the dataset description tooltip would stop rendering correctly. Attribute names with MathJax and dataset tooltips now coexist without conflict.
- Table View Would Not Open: In certain states, clicking to open the table view had no effect. The table now opens reliably.
- Table View Color Contrast in Reverse Contrast Mode: A color issue in Reverse Contrast mode made certain table cells difficult to read. The contrast values have been corrected.
- Attribute Description Missing on Axis Hover: Hovering over an axis label was not triggering the attribute description tooltip as expected. The tooltip now appears consistently.
- Glow Artifact Persisted After Case Selection: After selecting and deselecting a group of cases, a glowing highlight would sometimes remain visible on screen. This visual artifact has been removed.
- Missing Values in Pie and Bar Charts: Some data values were being dropped silently and not rendered in Pie and Bar charts. All values now display correctly.
- Histogram Did Not Plot Negative Numbers: Negative values were not being plotted correctly in Histograms. The issue has been resolved and negative numbers now display as expected.