Tuva Tools v2.16.0
Released 2/1/2023
This release focuses on two major items: making the insert data feature more robust and enhancing the capacity of the Formula Editor. Apart from these, we have also made several small enhancements and bug fixes to increase the usability and accessibility of the Tuva tool.
Added:
-
Support for Recognizing Aggregate Statistics: We added support for recognizing aggregate statistics in the formula editor for derived attributes for greater ease in working with formulae. The stats that are recognized by the editor along with their syntax are listed below:
Aggregate Statistics Syntax Description mean( attribute ) Mean of the numeric values of the attribute, excluding missing (blank) cases.
Note that function names must be of the correct case, mean(), not Mean() or MEAN().median( attribute ) Median of the numeric values of the attribute. iqr( attribute ) Interquartile Range of... stdDev( attribute ) Standard Deviation of... meanAvDev( attribute ) Mean Average Deviation... variance( attribute ) Variance... sum( attribute ) Sum... count( attribute ) Count of the numeric values of the attribute. For example, if an attribute has 100 cases with 5 of them blank, the result is 95. min( attribute ) Minimum numeric value... max( attribute ) Maximum numeric value... -
Attribute Color Key in Table View: We added a color key for attributes in the Table View to reinforce the connection between the column in Table View and the attribute in the Case Card.
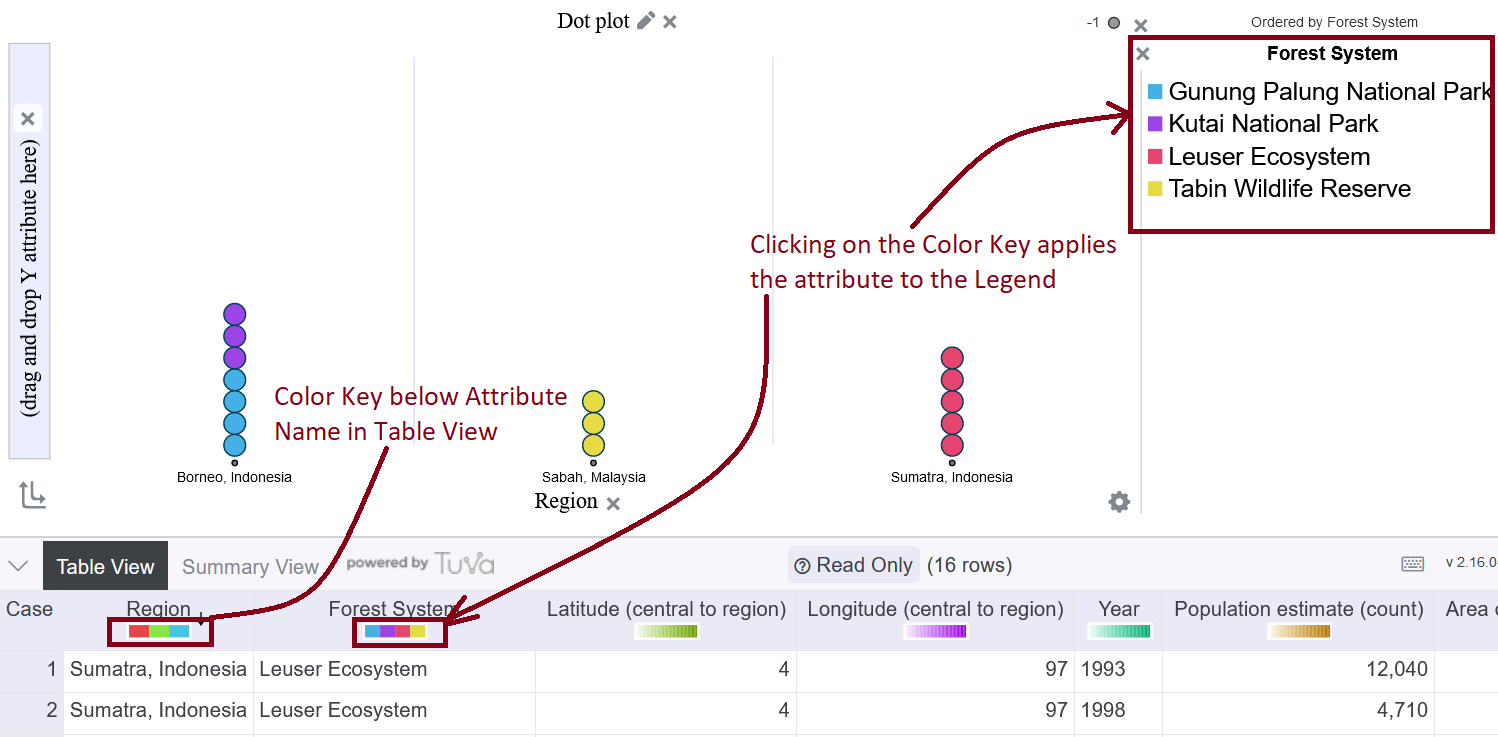
Clicking on the color key applies the attribute to the legend. The behavior has been kept consistent in the Table View and the Case Card. -
Equator Line on Map Plot: We added a default line of Equator in map plots to help students use it as a reference to identify the regions falling in the Northern or Southern hemisphere.
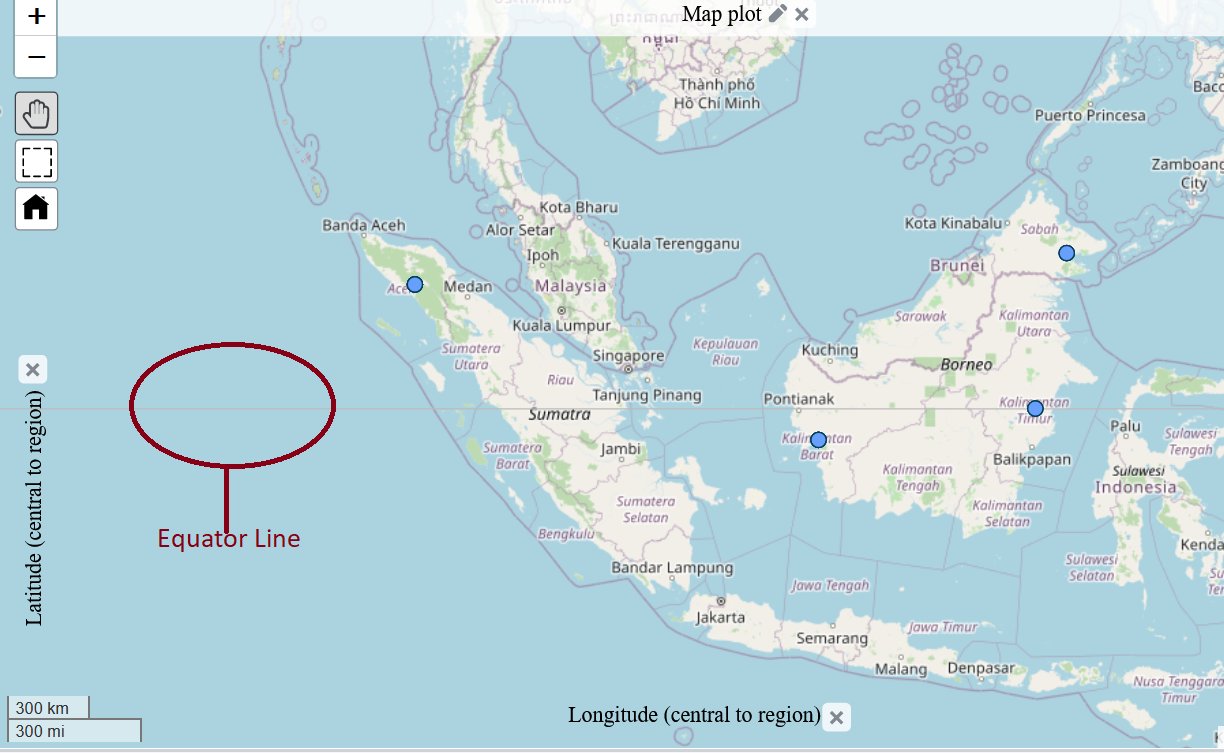
This is a work in progress as we plan to enhance the map tool more comprehensively in future iterations. - New Translations: In continuation with our effort to reach out and cater to the needs of users from diverse linguistic backgrounds, we have identified and added new translations for a number of static plot elements. Translations for dynamic plot elements are still pending and these will be tackled in the next release.
Changed:
-
Insert Data Enhancements: A big focus of this release was to strengthen and fine-tune the insert data feature to drive greater usage. The following enhancements/fixes were made to it to achieve this:
- Copy-pasting data: You can now copy and paste data from other spreadsheets directly in the empty table.
- Displaying Attribute Color Key: The Table in the Insert Data mode also displays the same color key as the case card.
- Rendering and Editing attributes with mixed Values
- Consistency in the behavior of Cell Focus across different types of attributes
- Rendering Numbers with Commas: The table in the insert data mode is able to recognize and render the commas in numbers with commas.
-
Text Box Annotation: We enhanced the text annotation tool to permit multiple lines of text to fit within an adjustable rectangular box thus allowing the user to insert captions in the graphing area.
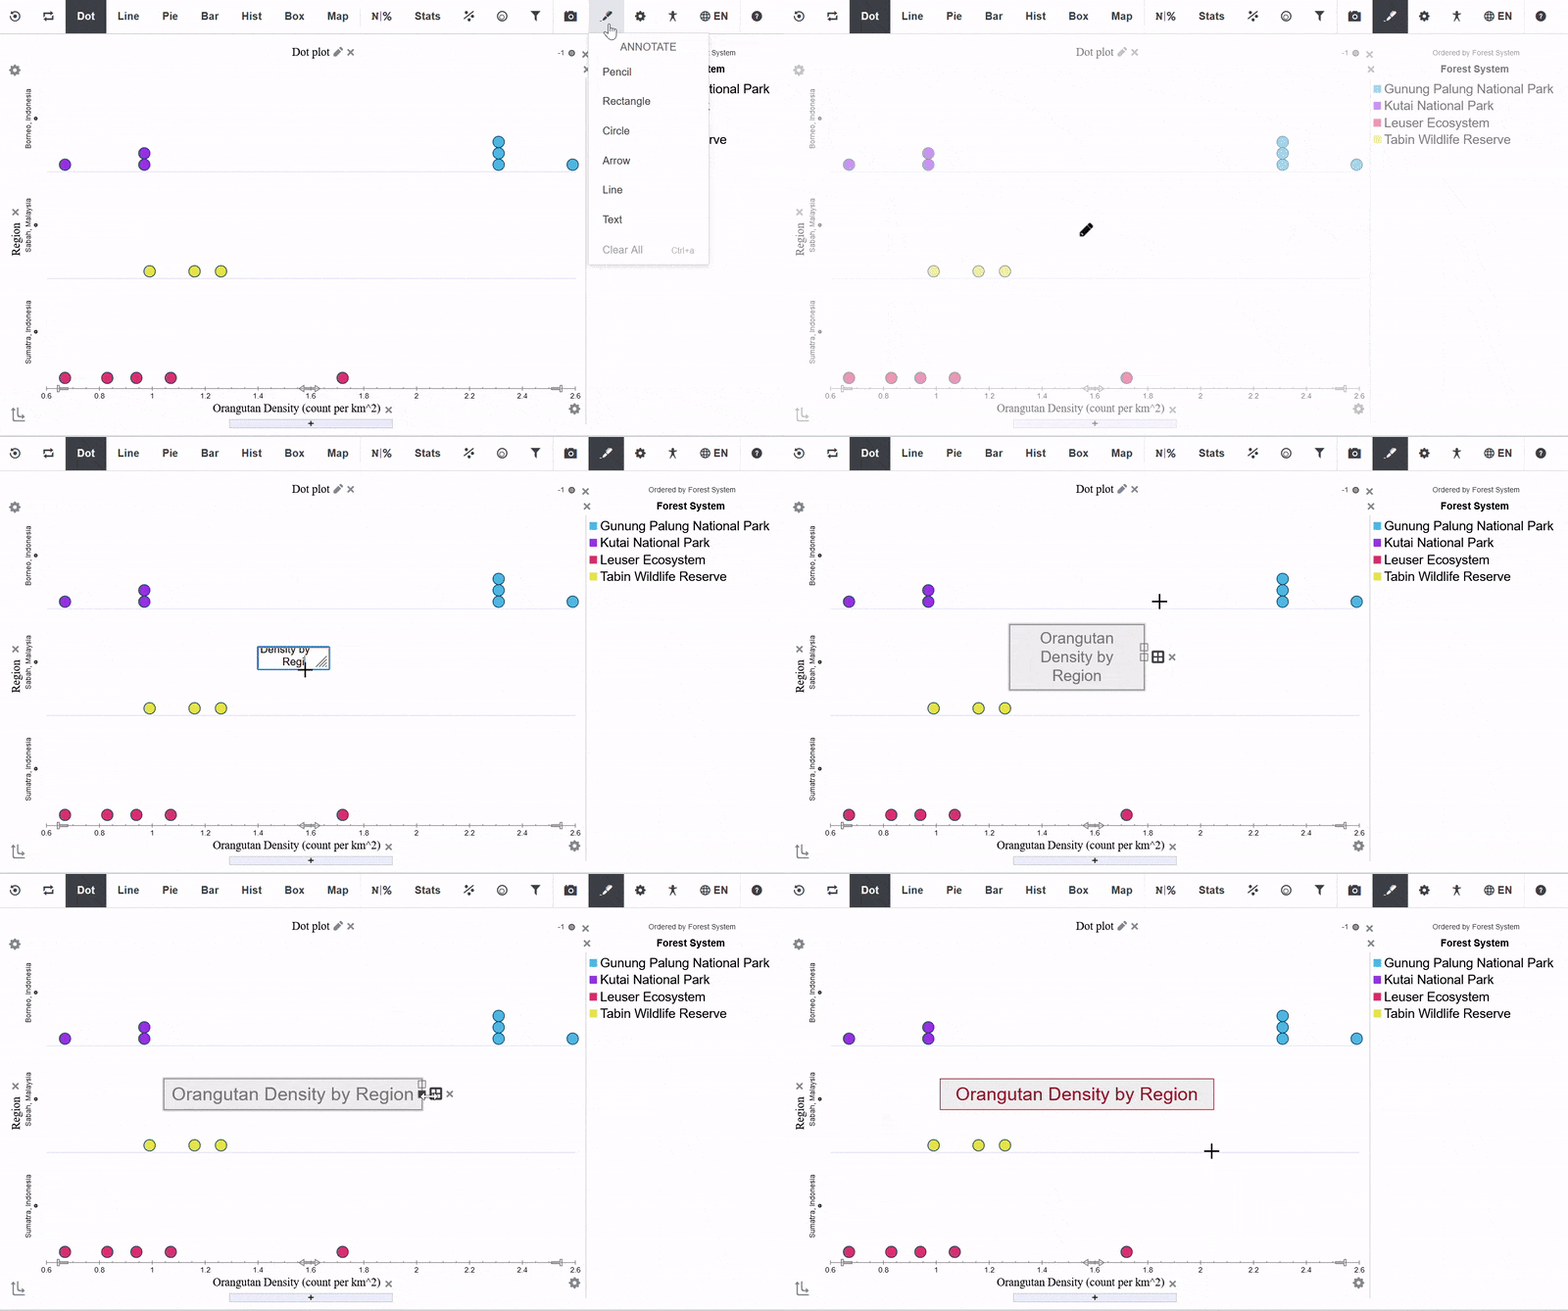
Once you input the text in the box, you can use the two controls on the right border of the box to change the dimension of the box and the font size. The text wraps as you tweak these controls. This is the first iteration of this annotation and we intend to make the controls smoother in the successive iteration. -
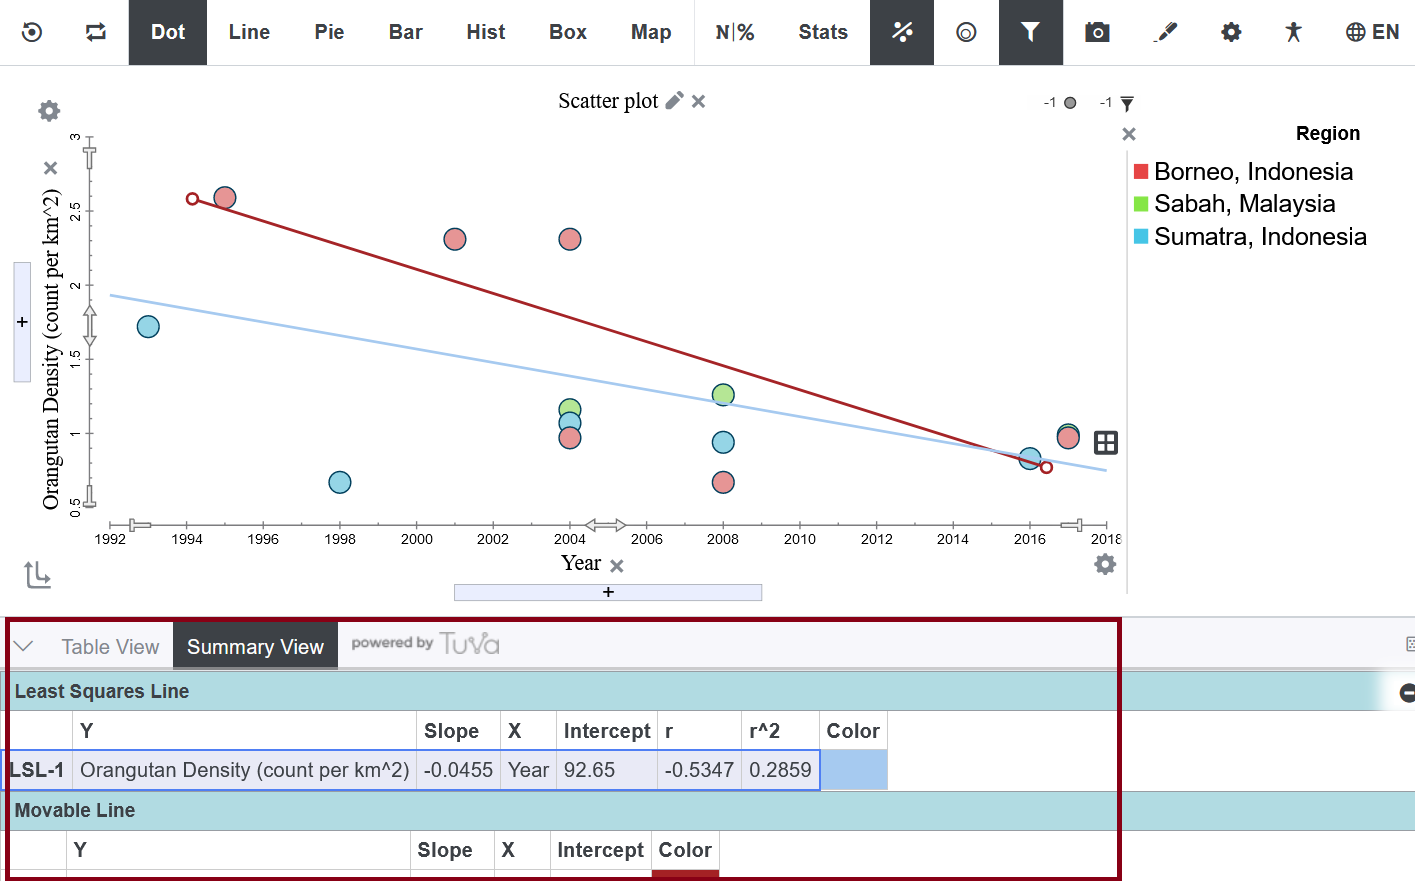
Summary View Design: Continuing our focus on usability and accessibility we enhanced the design of the Summary View to make it more bright and compact.
-
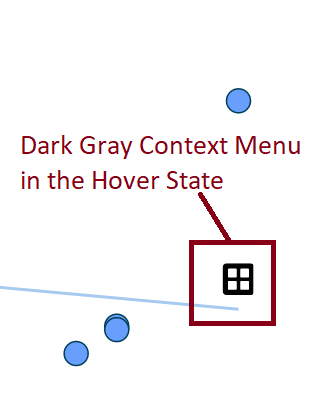
Context Menu Color: We updated the color of the context menu in the hover state to a darker gray (almost black) for greater visibility and easier discoverability in a busy graph.
Bug Fixes:
- Inserting Numbers with Comma when Copy/Pasting: We fixed a bug that was causing numbers with commas to drop any numbers after the comma. This bug appeared while copy and pasting into the Table View in edit mode.
- Transitioning Between Plot Types: We fixed a bug that appeared while transitioning between plot types where a missing update to axis type - when transitioning from an active to disabled attribute or back - was causing the missing value calculation to be wrong.
- Missing Authoring Tool Presets: The missing presets in the Authoring tool (Elem, Middle, and High) were brought restored.
- Order of Buttons in Authoring Tool Presets: We fixed an issue with the Authoring tool presets where the toolbar buttons were not in the same order across the different presets.
- Editing MM-YYYY and Month-Year Attributes: We fixed a bug in the Insert Data feature that was causing inconsistencies in parsing of attributes while editing.
- Bug in Axis Layout: We fixed a bug that was causing issues in axis layout after an attribute was disabled.
- String Formulas in the Formula Editor: We fixed an issue that was preventing string related formulas from working in the Formula Editor for Derived attributes.
- Controls for Changing Number of Pie Sections in a Pie Chart: We fixed a visual bug with the +/- buttons for the Pie Chart.
- Reposition Categories in Legend: We fixed a bug that was causing categories in the legend to reposition when they were clicked.
- LSRL Option for Box Plots: We disabled the LSRL for box plots.