Tuva Tools v2.9.1
Released 5/24/2021
We've focused on two updates for v2.9.1. The first update is improving the standard deviation feature to calculate and visualize multiple standard deviations. The second update is enhancing the Summary View to properly display equations generated by the Modeling feature. The remainder of this change log will also mention bug fixes and a few smaller updates.
Changed:
-
Multiple Standard Deviation: We've
enhanced the standard deviation feature to allow you
to measure beyond the first standard deviation.
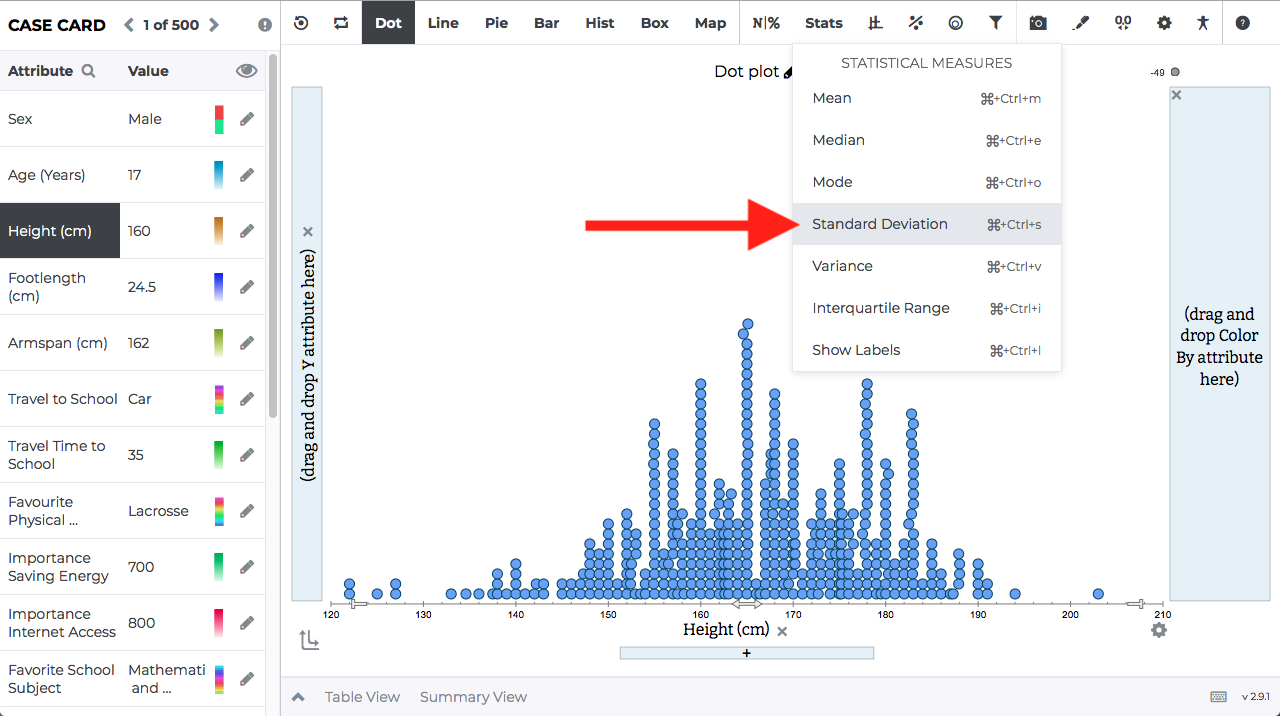
Recall that to enable standard deviation, you'll
need to go to the Stats menu to find the standard
deviation button.
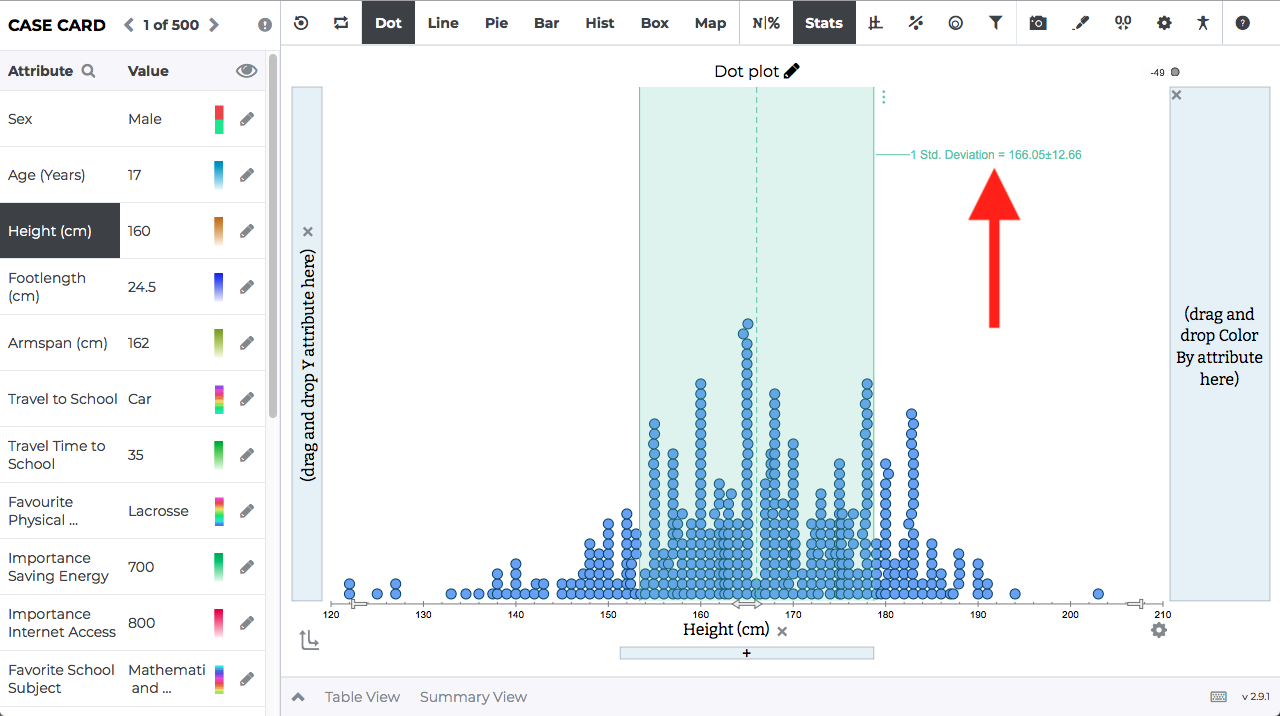
After clicking standard deviation, this statistical measure will appear in the plotting area just as before with one new change. Notice the 3 dot button appearing next to the standard deviation. It's highlighted in the screenshot below.
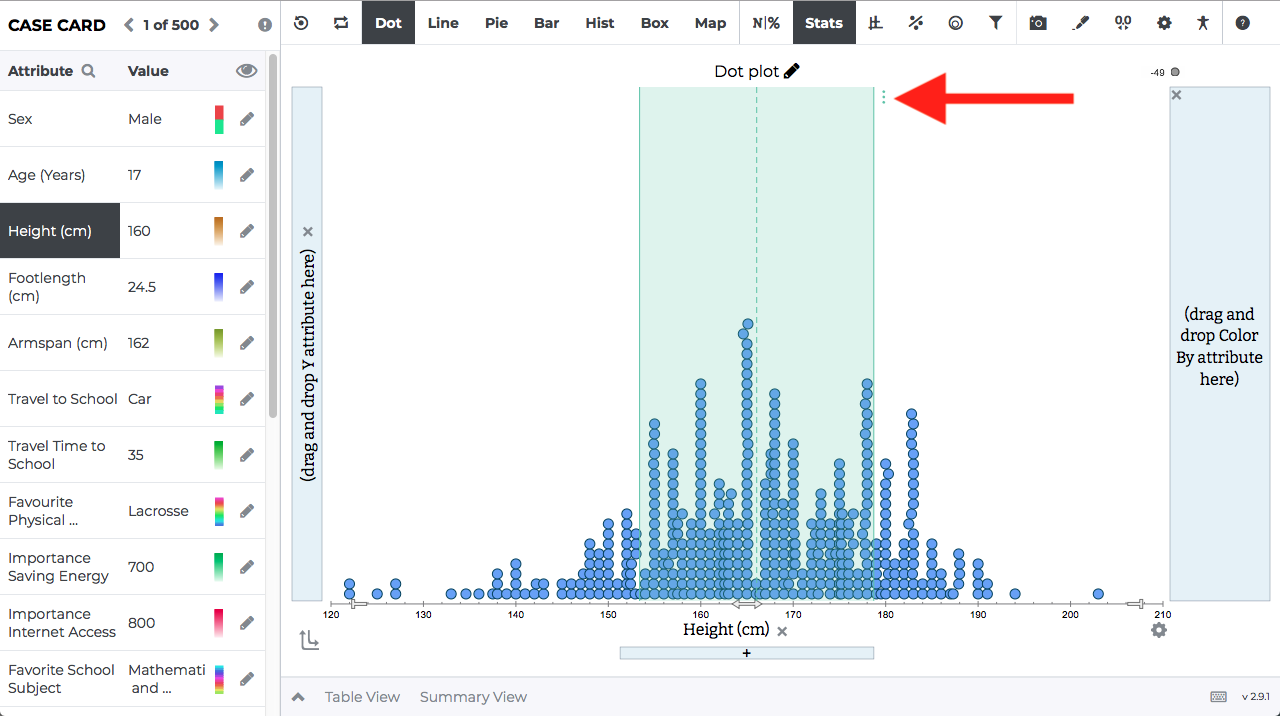
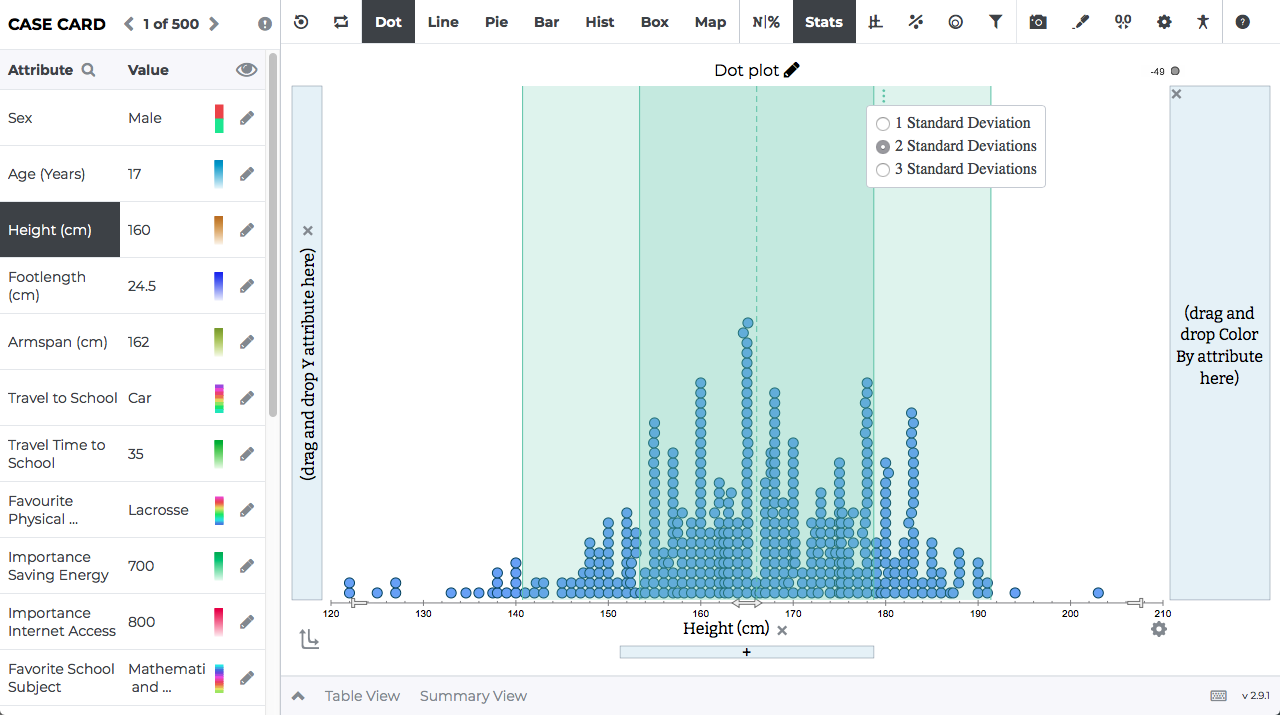
Clicking the three dots will reveal a new menu that provides the option to visualize the 1st, 2nd, and 3rd standard deviations.
In the screenshot below you can see how the 2nd standard deviation appears when clicked.
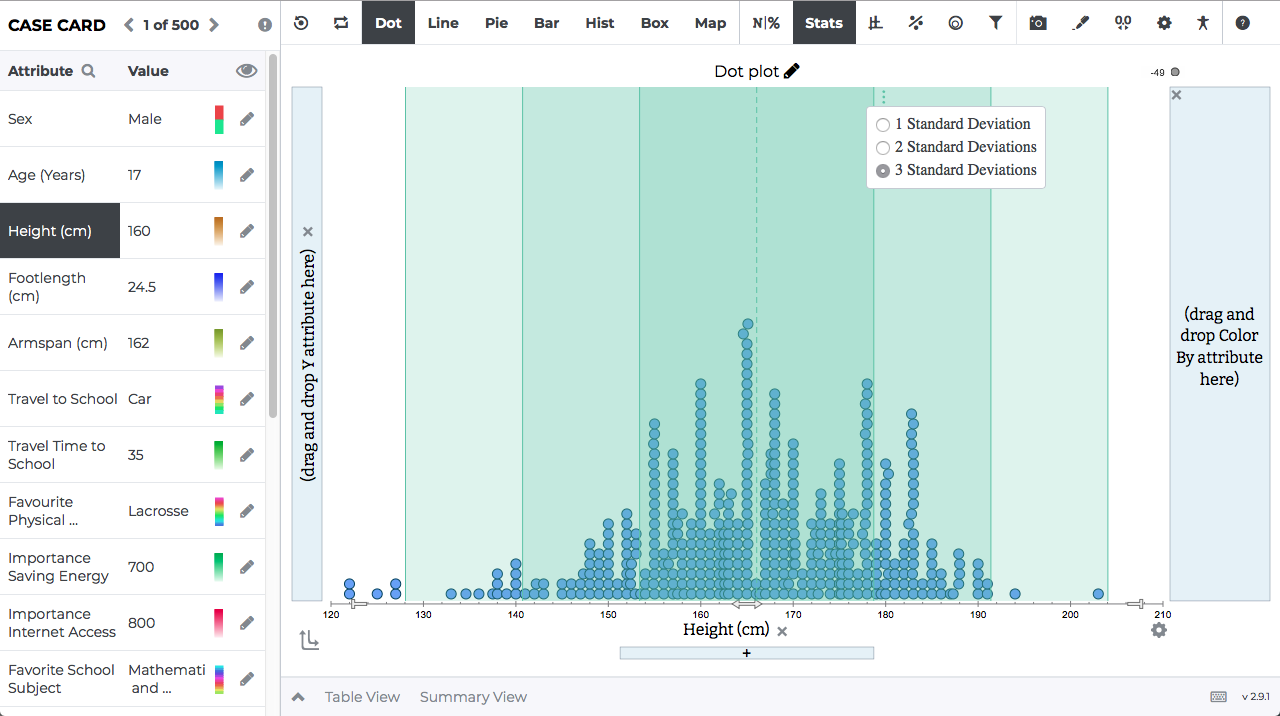
In the screenshot below you can see the 3rd standard deviation visualized in the plotting area.
- CSS Update: We made a small change to the Summary View to use the appropriate CSS styling for its title text.
Added:
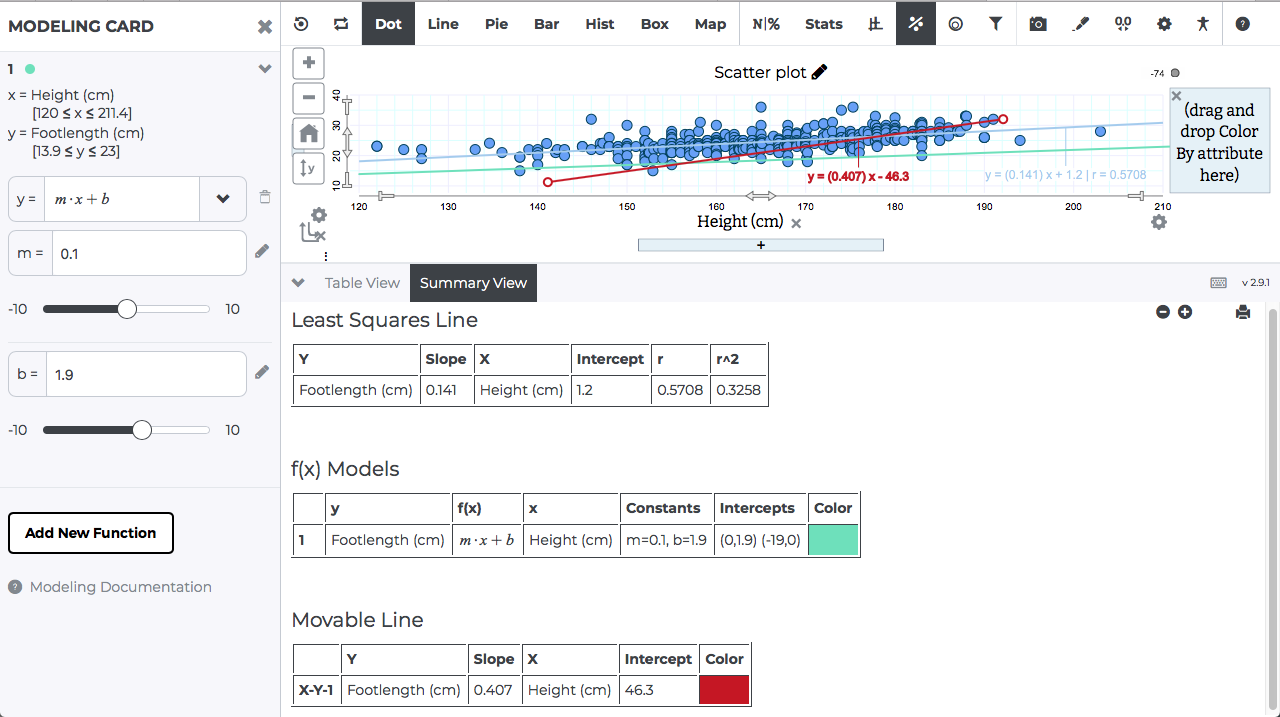
- Modeling Feature Added to Summary View: We've added support for the Summary View to properly display equations created in the Modeling feature. The equations in the Summary View follow the same structure as the equations that are displayed for Least Square Regression Line and the Movable Line.
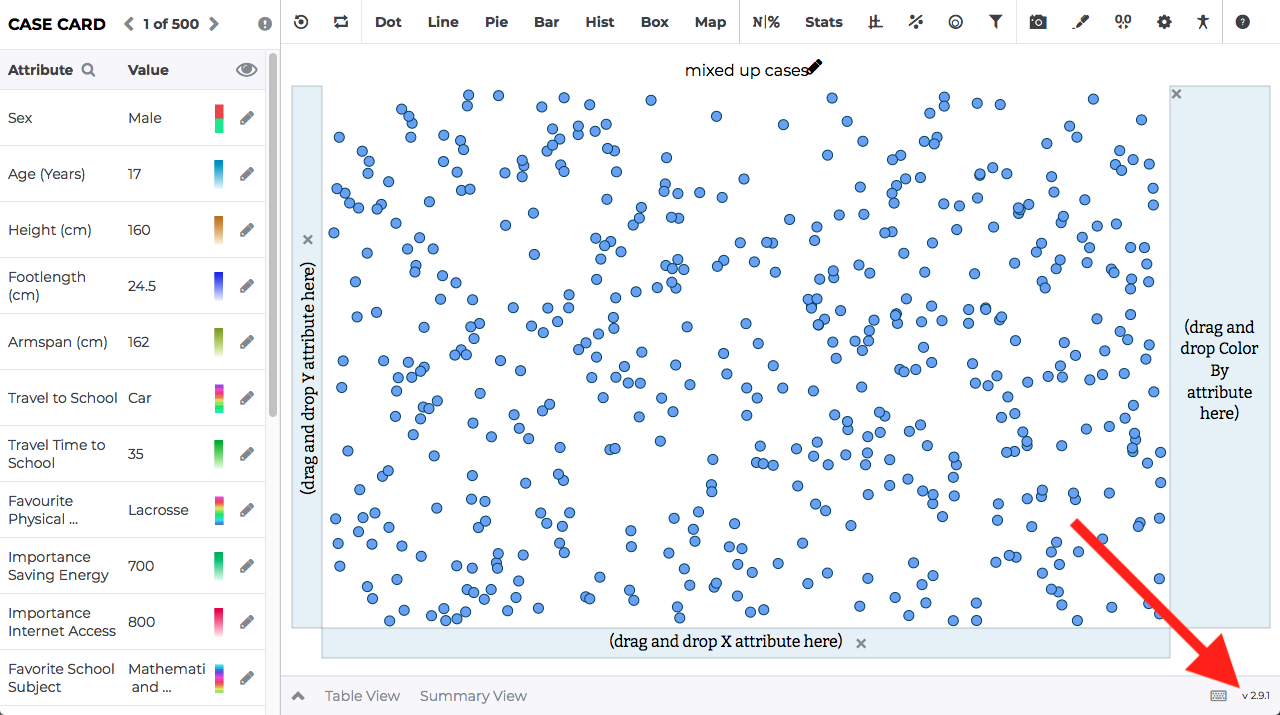
- Version Number: We are now permanently displaying the version number of the Tuva Data Tools in the bottom right corner of the footer. Clicking the version number will take you to the change log for that version. You can see it highlighted in the screenshot below.
Bug Fixes:
- Labels: We fixed a bug connected to dragging statistical labels in the plotting area. Please see the screenshot below for an example of a label.
- Color Picker: We fixed a bug with the color picker when no color was selected.
- Flickering: We fixed an issue where standard deviation, variance, and IQR lines were flickering in the plotting area when a mouse cursor hovered over the boundary lines of each statistical measure.
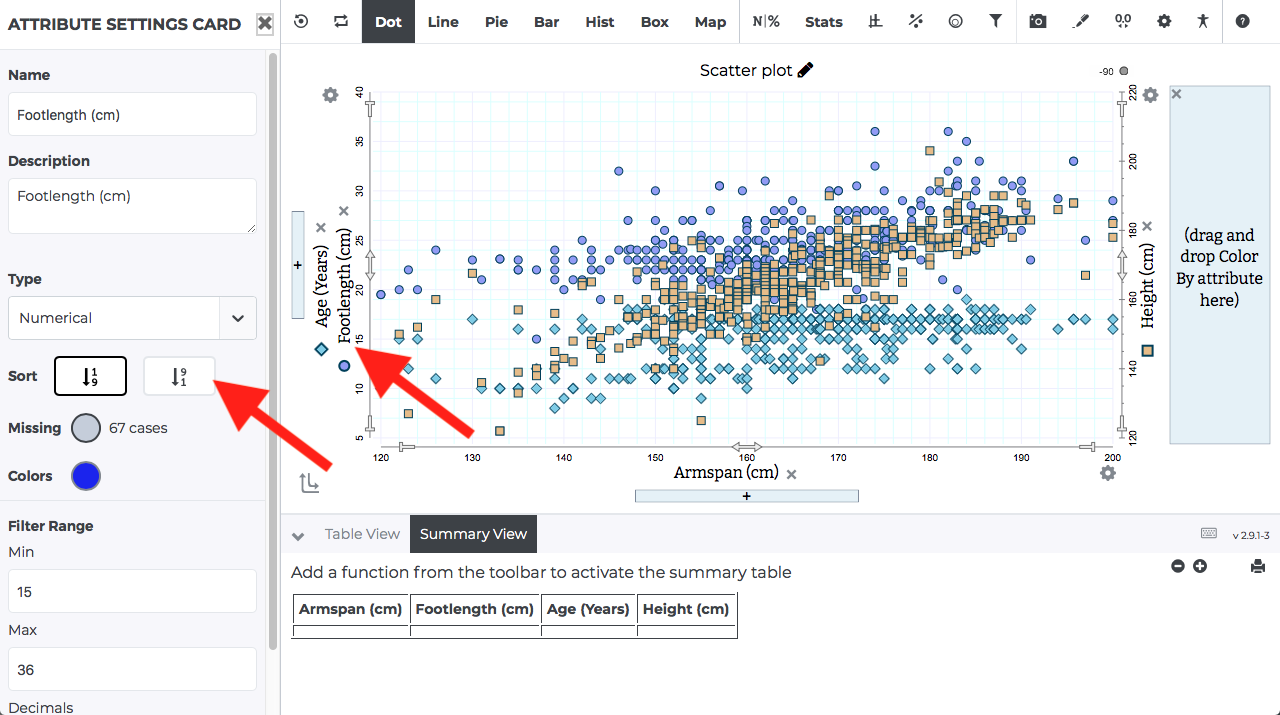
- Multiple Numeric Attributes: We discovered and fixed an issue related to displaying multiple numeric attributes on a single axis. When switching between sorting options (high to low and low to high), the attribute shapes would not remain consistent. This has been fixed and the attribute shapes will not change when sorting the attributes. You can see the screenshot below for an example of multiple numeric attributes on a single axis and where the issue was discovered when clicking the sort button.
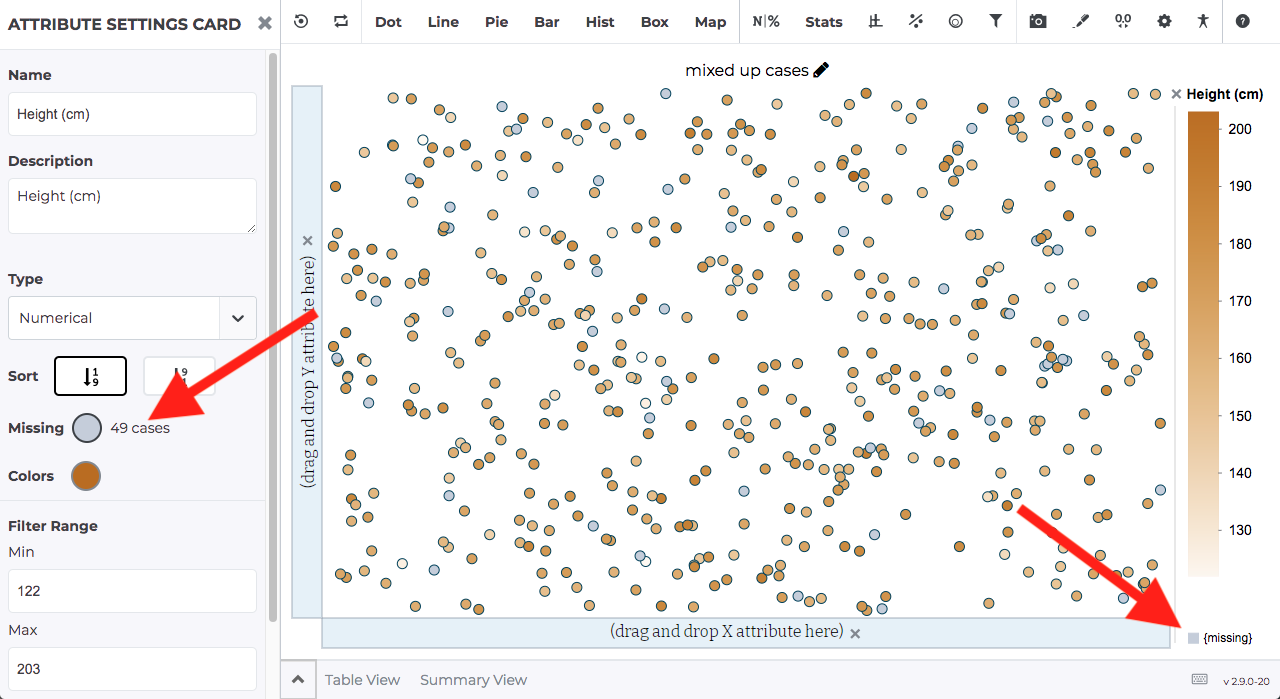
- Selecting Missing Cases: We fixed an issue that was preventing missing cases from being selected in the plotting area. In the screenshot below, you can see the places you can click to select cases with missing data.
- Attribute Description Field: We fixed an issue with the Attribute Description field not having proper paragraph indentation.
- Parsing Dates: We fixed a bug with the movable line having difficulties parsing dates when displaying the lines equation.