Tuva Tools v4.0.0
Released 3/31/2026
Version 4.0.0 of Tuva Tools reflects Tuva's ongoing commitment to usability, accessibility, and inclusive design. As the platform has grown in depth, this release strengthens clarity, consistency, and ease of use across the full data exploration experience.
Across devices and browsers, Tuva Tools 4.0 improves readability, interaction clarity, and keyboard support. The result is a cleaner and more predictable environment that helps students focus on reasoning with data instead of working around interface friction.
What's Changed Overall
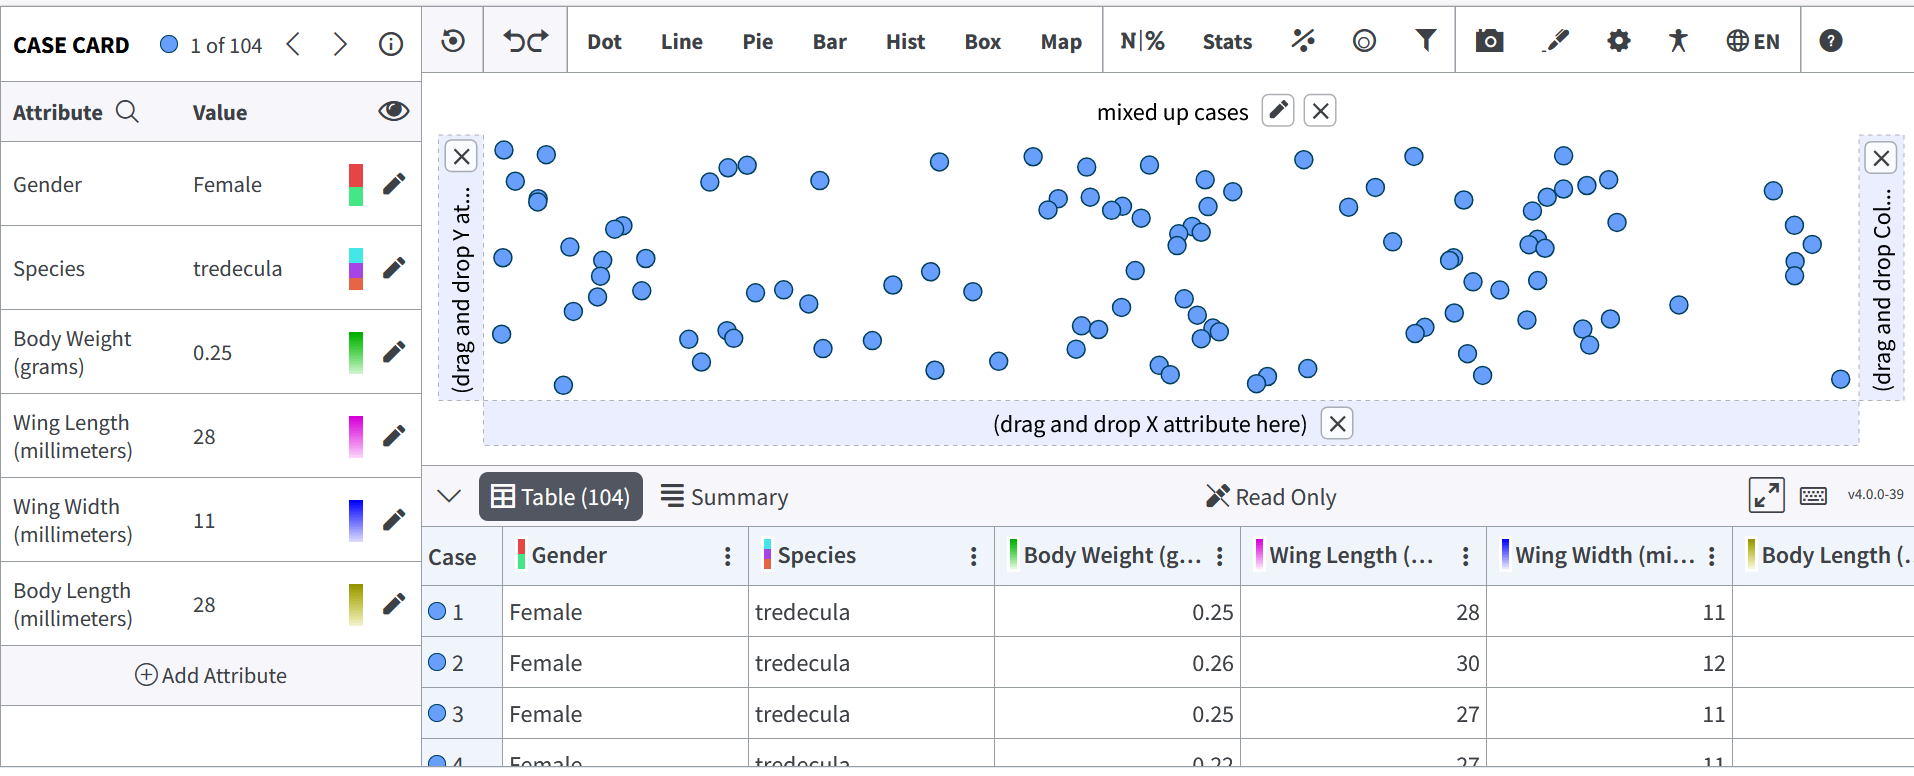
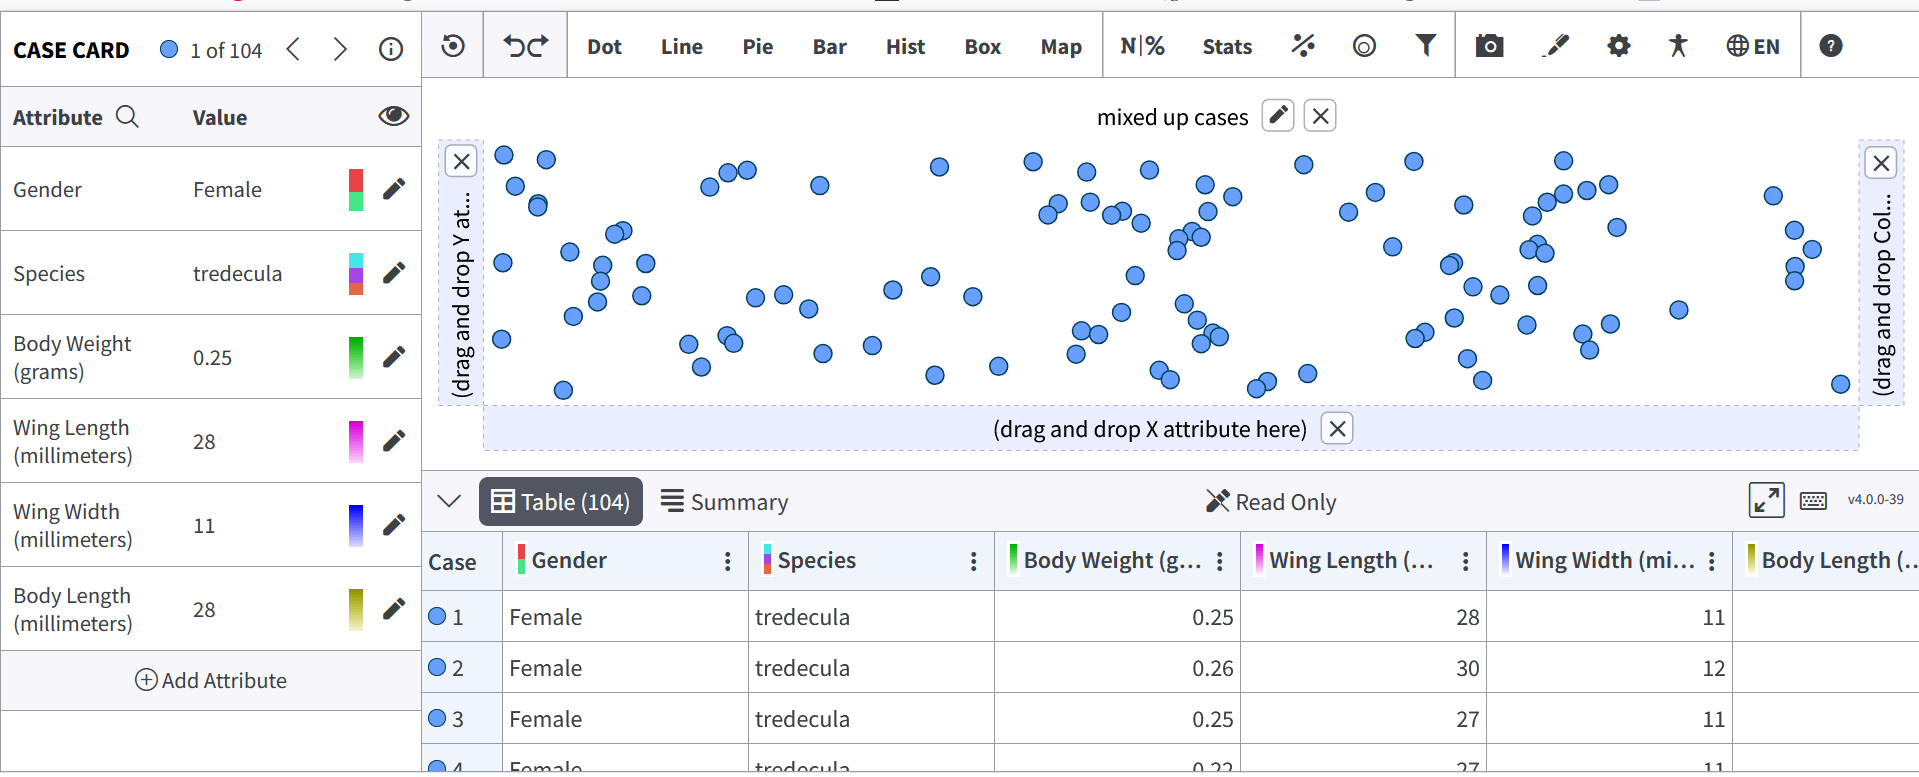
- Cleaner layouts with more consistent spacing.
- A unified font and text sizing system for better readability.
- Reduced visual clutter and unnecessary frills.
- Clearer visual cues for interaction and selection.
- More consistent keyboard navigation and focus behavior.
Before and After
What's New, Organized by the Four Core Parts of Tuva
-
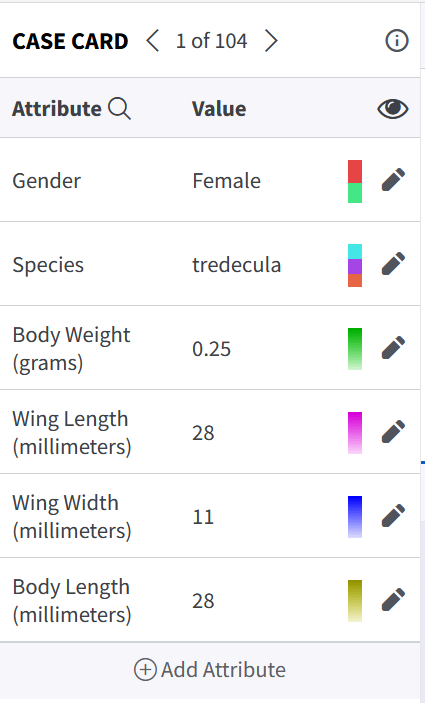
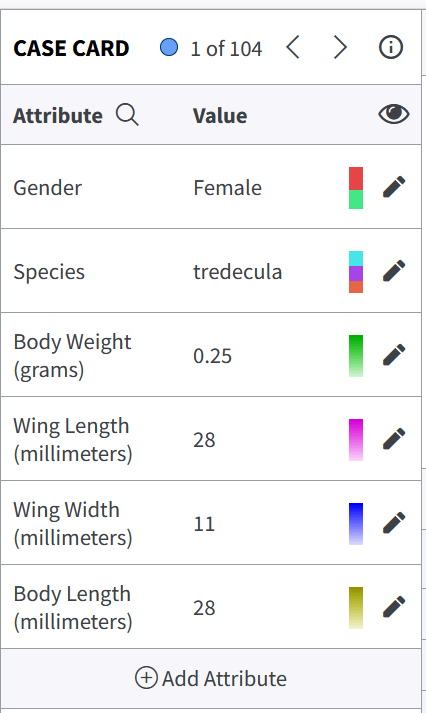
Left-Hand Cards:
The Case, Attribute Settings, Plot Settings, Modeling, Random Sampling, and related cards
have been refined for consistency and ease of use.
- Visual styling is now consistent across all cards.
- Text, labels, and controls are clearer and more evenly spaced.
- Icons and interactive elements follow the same sizing and design rules.
- Buttons and toggles use a more consistent visual style.
- Keyboard focus and navigation behave more predictably across cards.
-
The Toolbar and Menus:
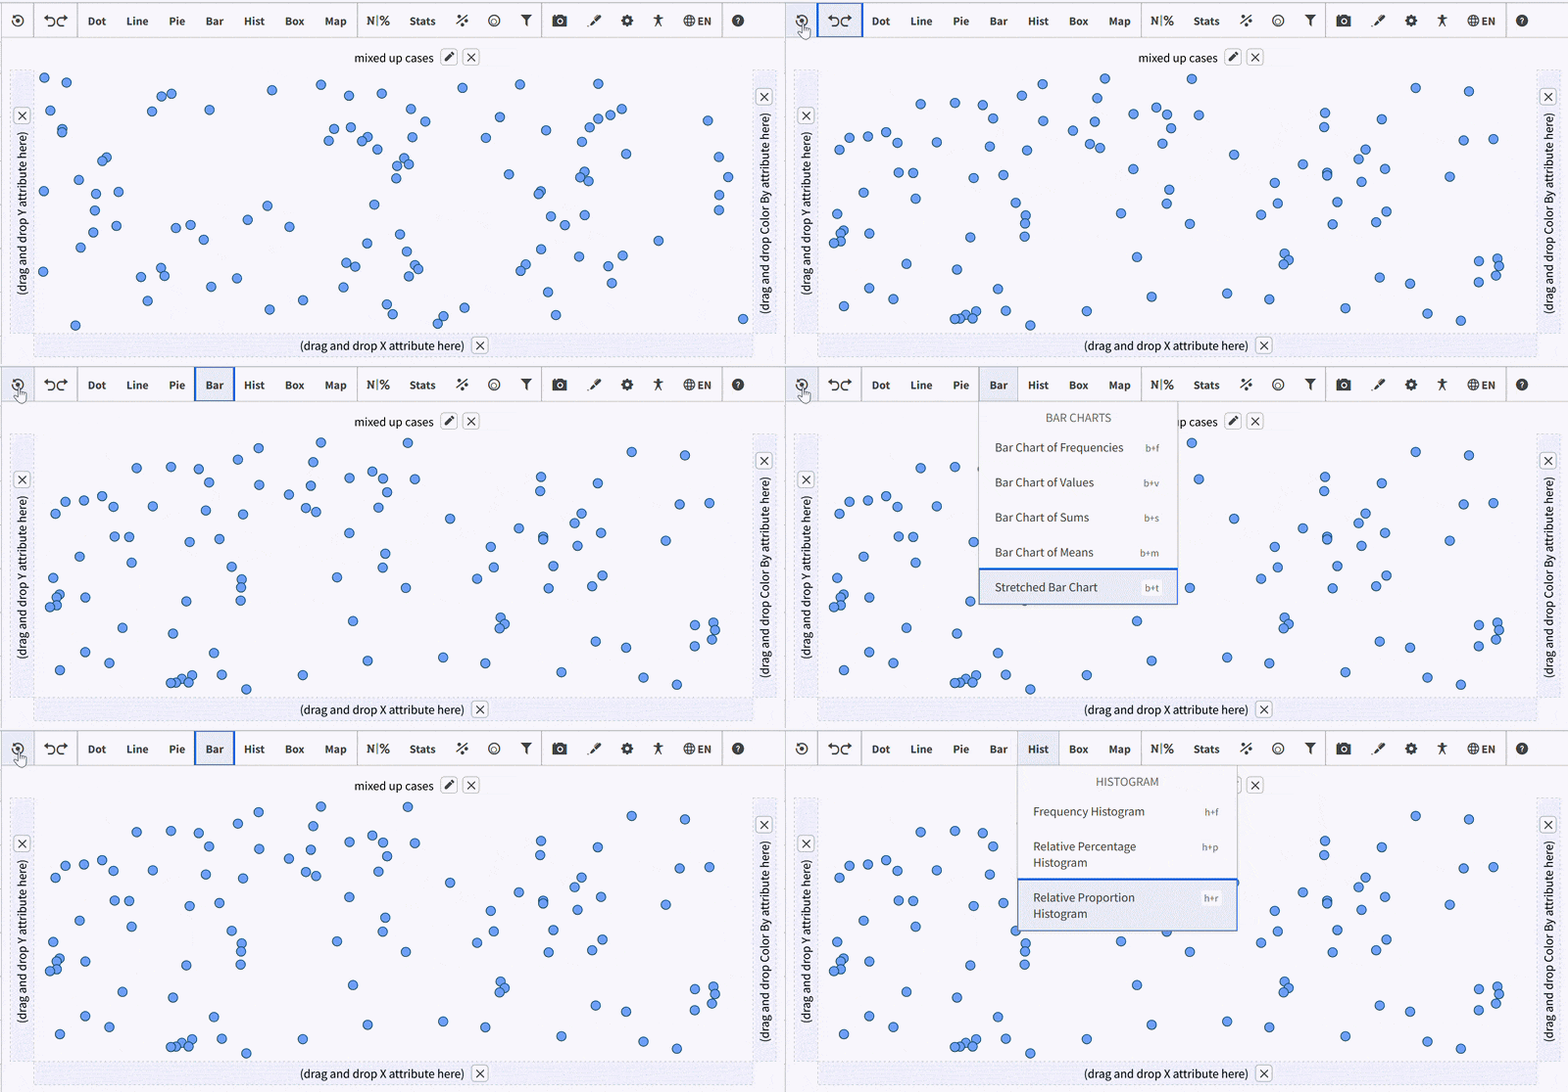
The toolbar and its submenus have been refined to improve clarity and reduce visual distraction.
- Borders, spacing, and alignment are more even.
- Keyboard navigation is more consistent across toolbar items and submenus.
- Hover and focus feedback is clearer and more reliable.
-
The Data Exploration Area:
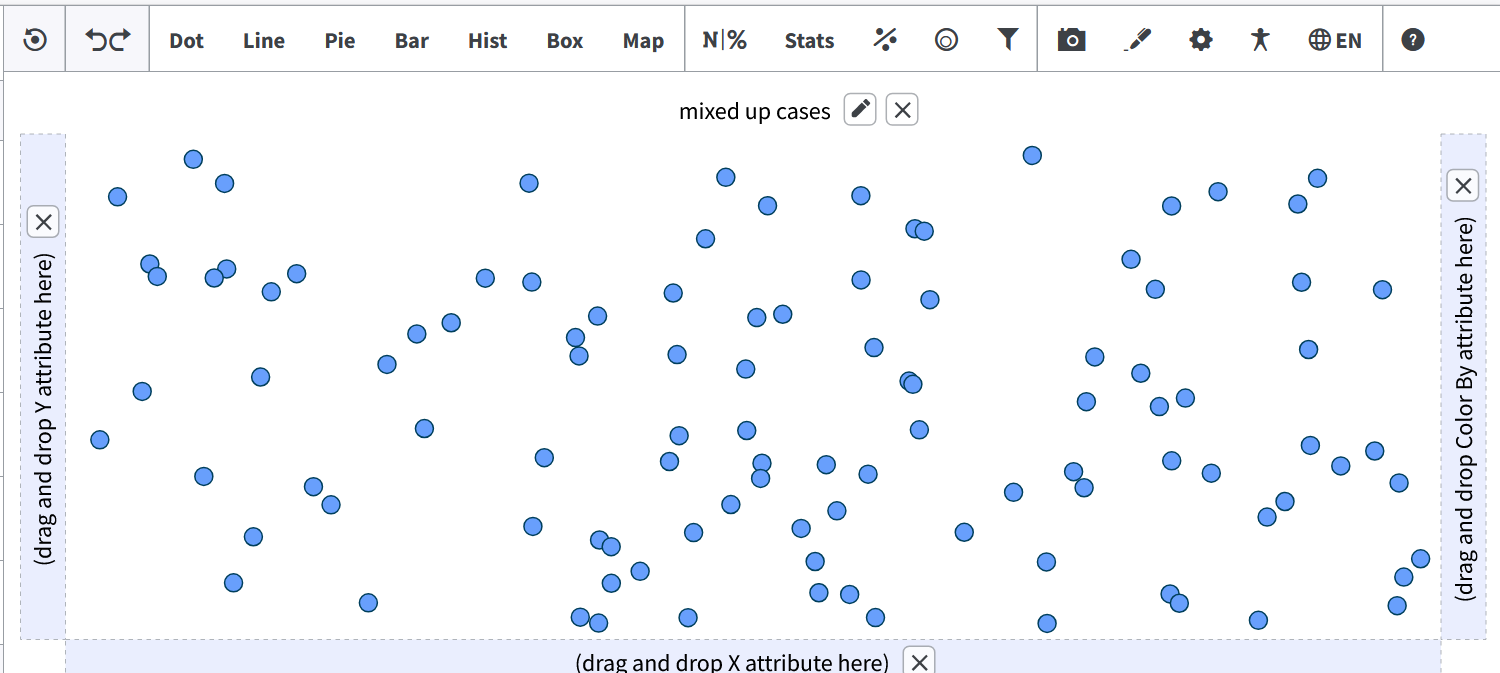
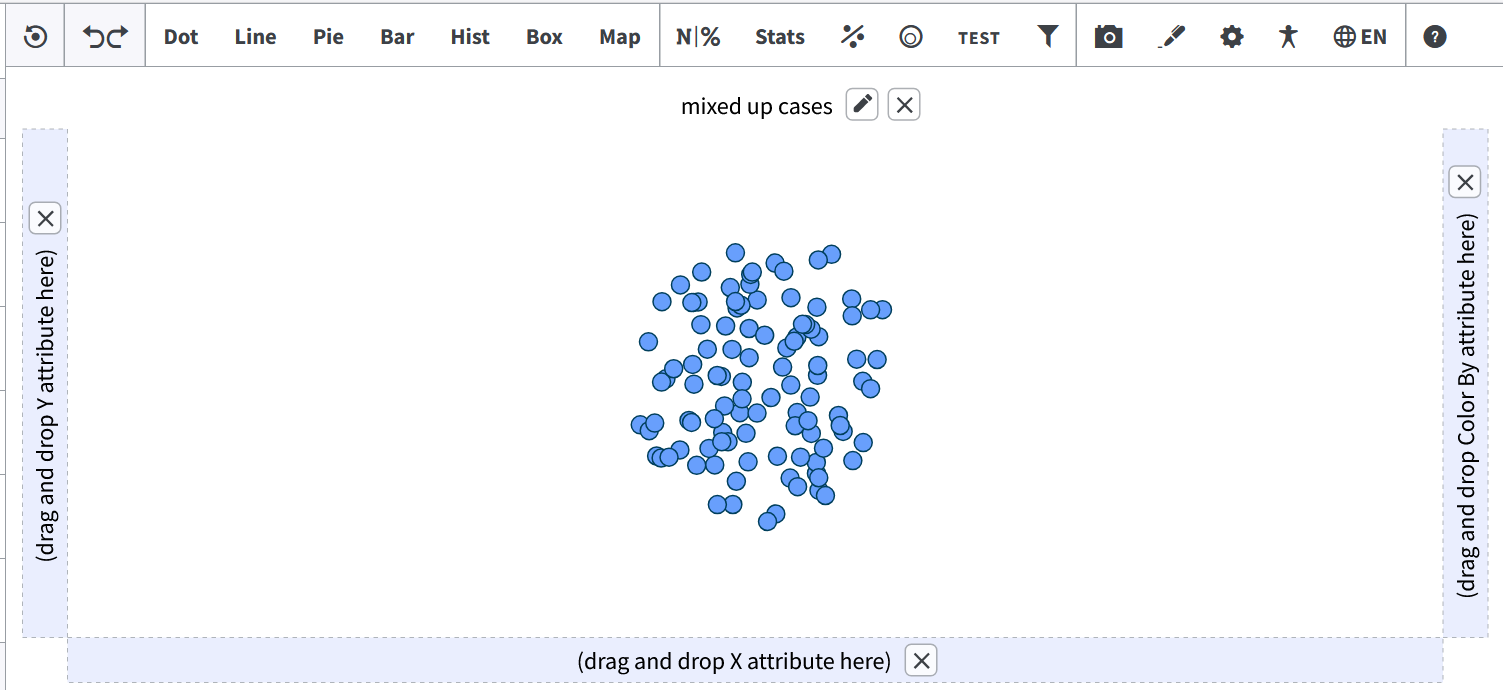
The central plotting area has been refined to support clearer interactions.
- The initial state has been simplified to reduce noise for new users.
- Attribute drop areas are more clearly indicated.
- Drag-and-drop interactions feel smoother and more visible.
- Selecting points or groups of points and filtering them is more intuitive, with actions appearing close to the selection via a dedicated context menu.
- The plot title now transitions more clearly when users switch between graph types, with animation making the change easier to notice.
-
The Table and Summary Views:
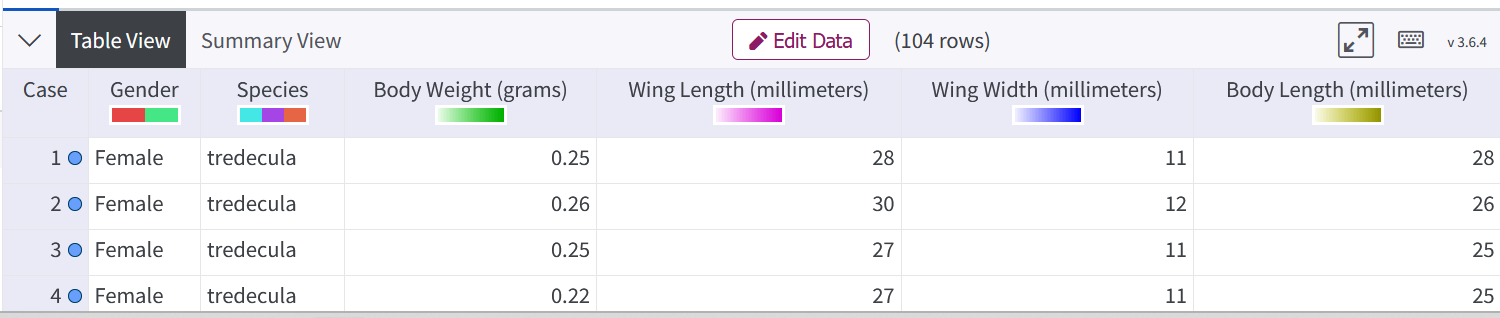
The Table View received the most substantial update in Tuva Tools 4.0, improving flexibility,
clarity, and ease of use when working directly with data.
- The underlying table system has been upgraded to support smoother interaction and greater flexibility.
- The visual design has been refined with cleaner lines, larger text, and bolder fonts for improved readability.
- Column headers remain fixed, making large datasets easier to read.
- Column widths can be adjusted with intuitive drag controls.
- Attributes can be dragged directly from the table header into the graphing area, strengthening the connection between data and visual exploration.
- A context menu on column headers now allows users to sort values directly from the table.
- Keyboard navigation and focus behavior in the table have been improved, making it easier to move through cells and columns without a mouse.
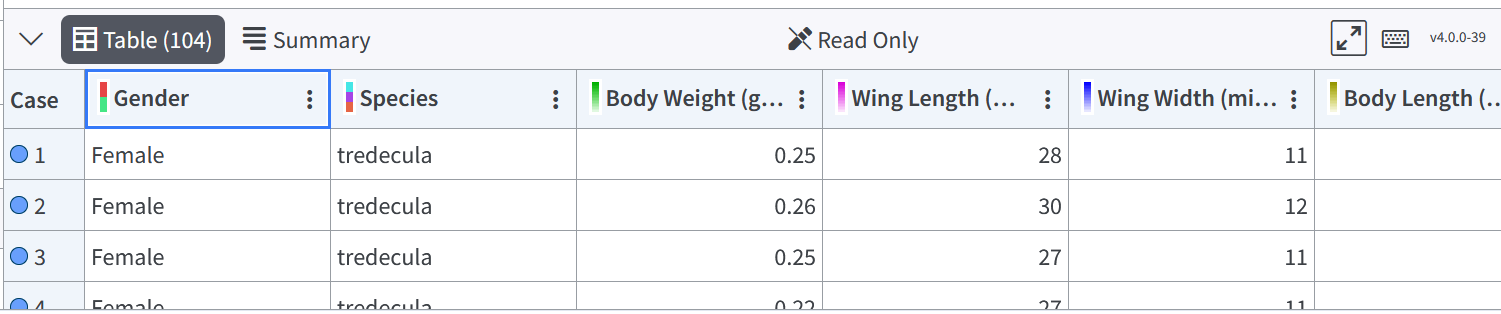
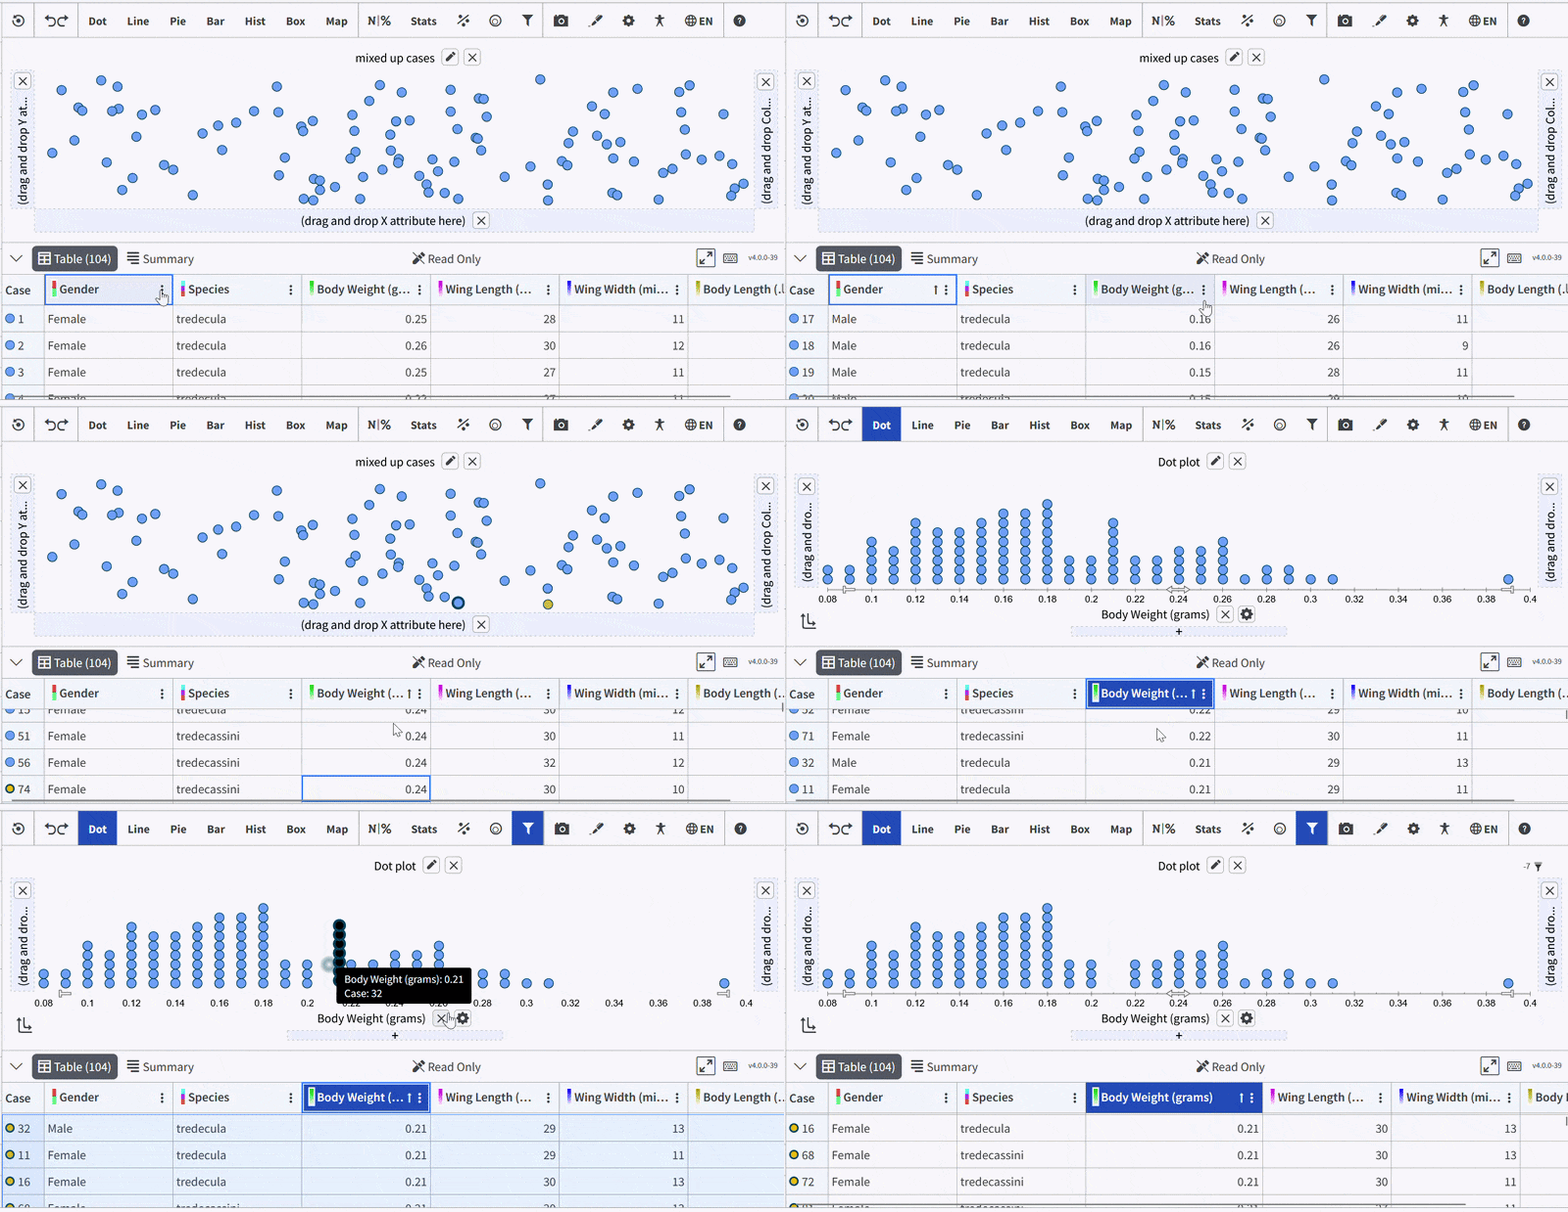
Together, these changes make it easier for students to inspect, compare, and analyze values in table form. The Table View now better supports sustained analysis in classroom settings where learners move frequently between tabular data and graphs.
Accessibility and Inclusive Use
- Keyboard navigation is clearer and more reliable throughout the tool.
- Focus states are more visible across interactive elements.
- Cross-browser consistency has improved.
- Reverse Contrast has been upgraded to better support users with visual sensitivities and low-vision needs.
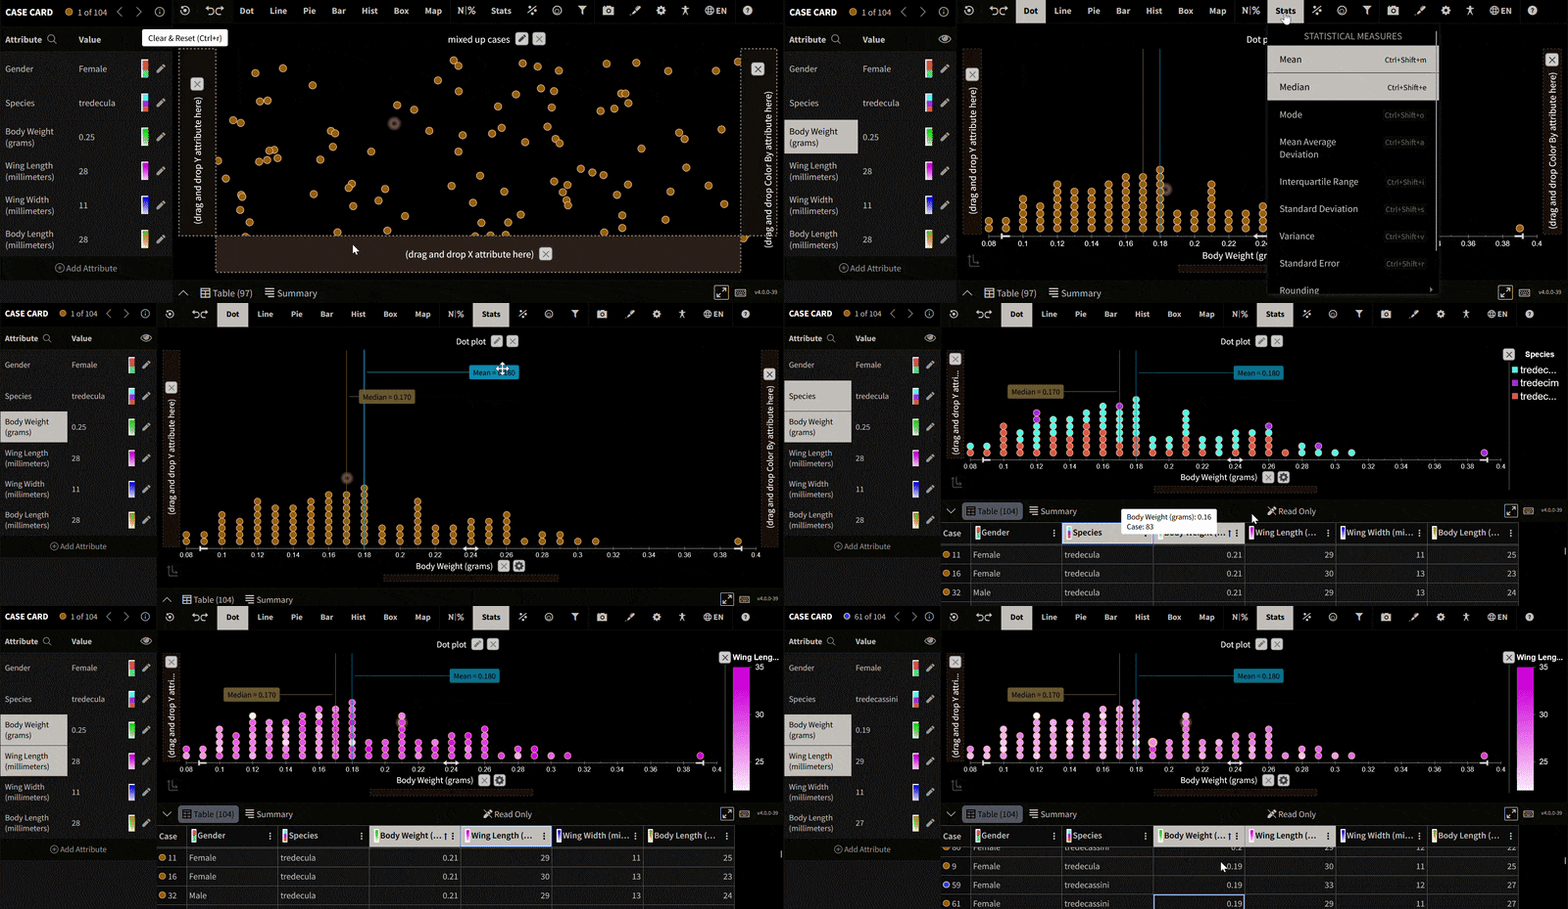
These updates reflect Tuva's commitment to ensuring that data literacy tools support diverse learners and classroom contexts.