Tuva Tools v2.3.0
Released 4/10/2020
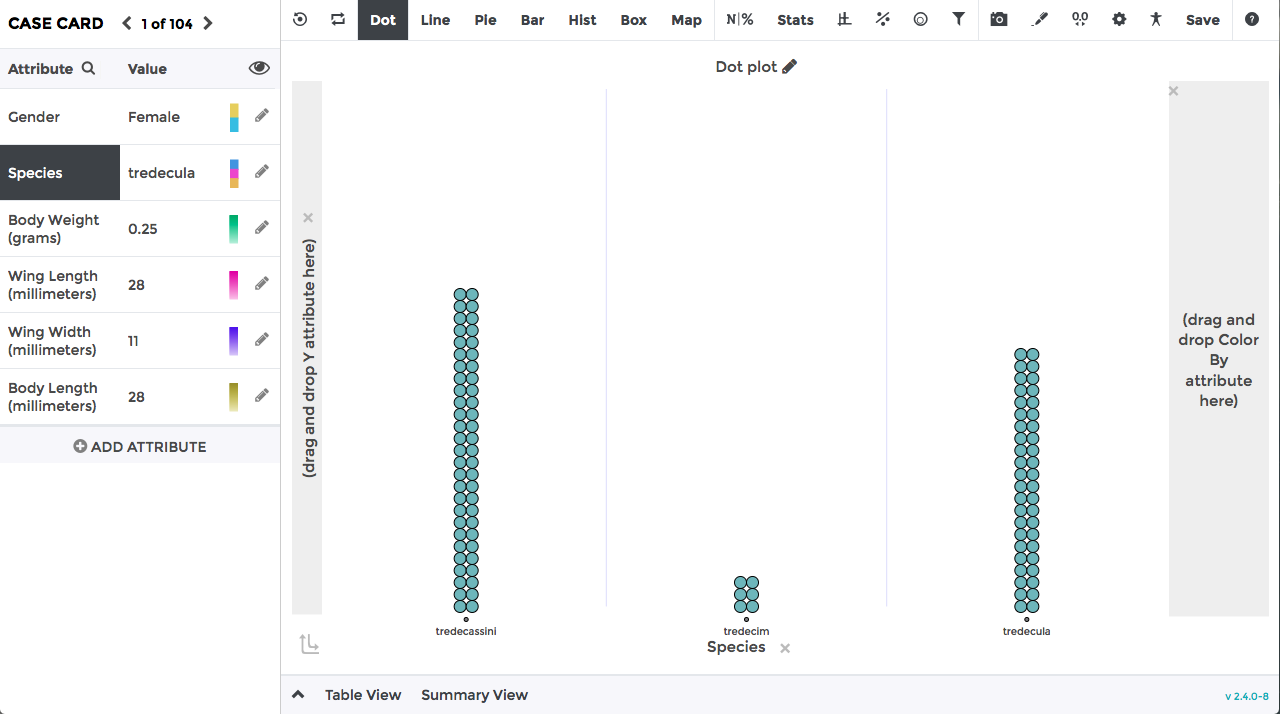
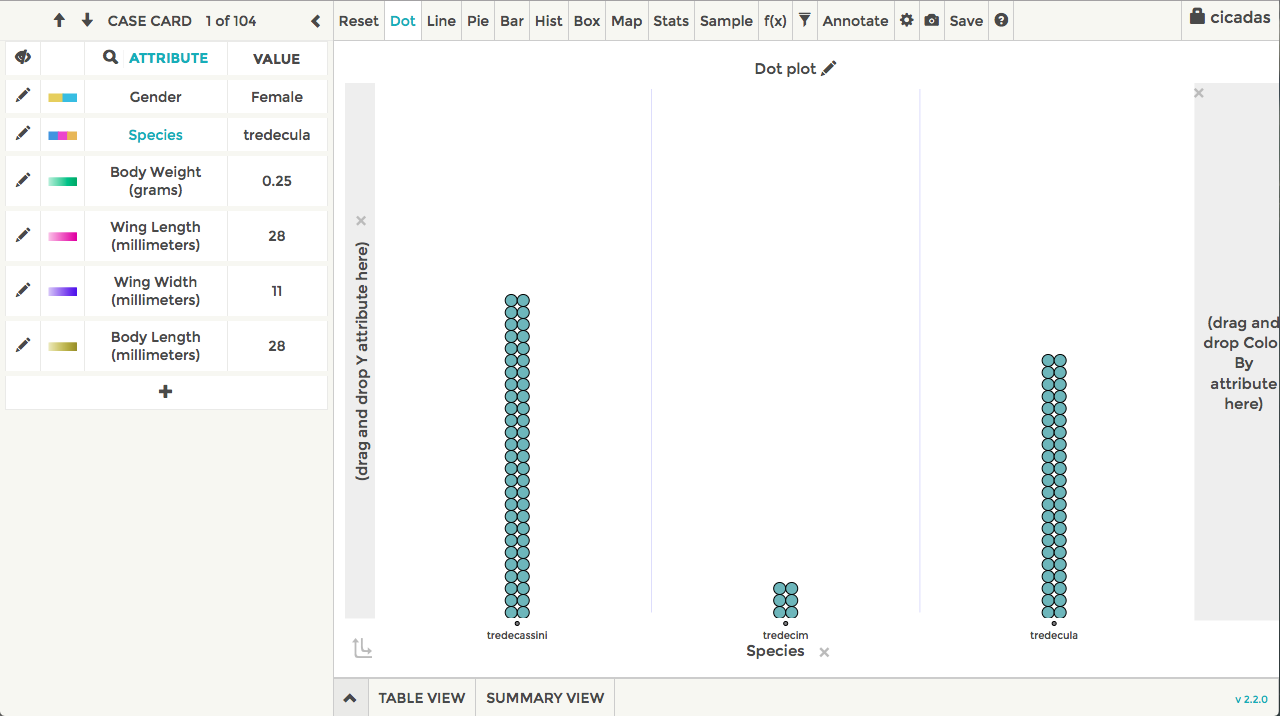
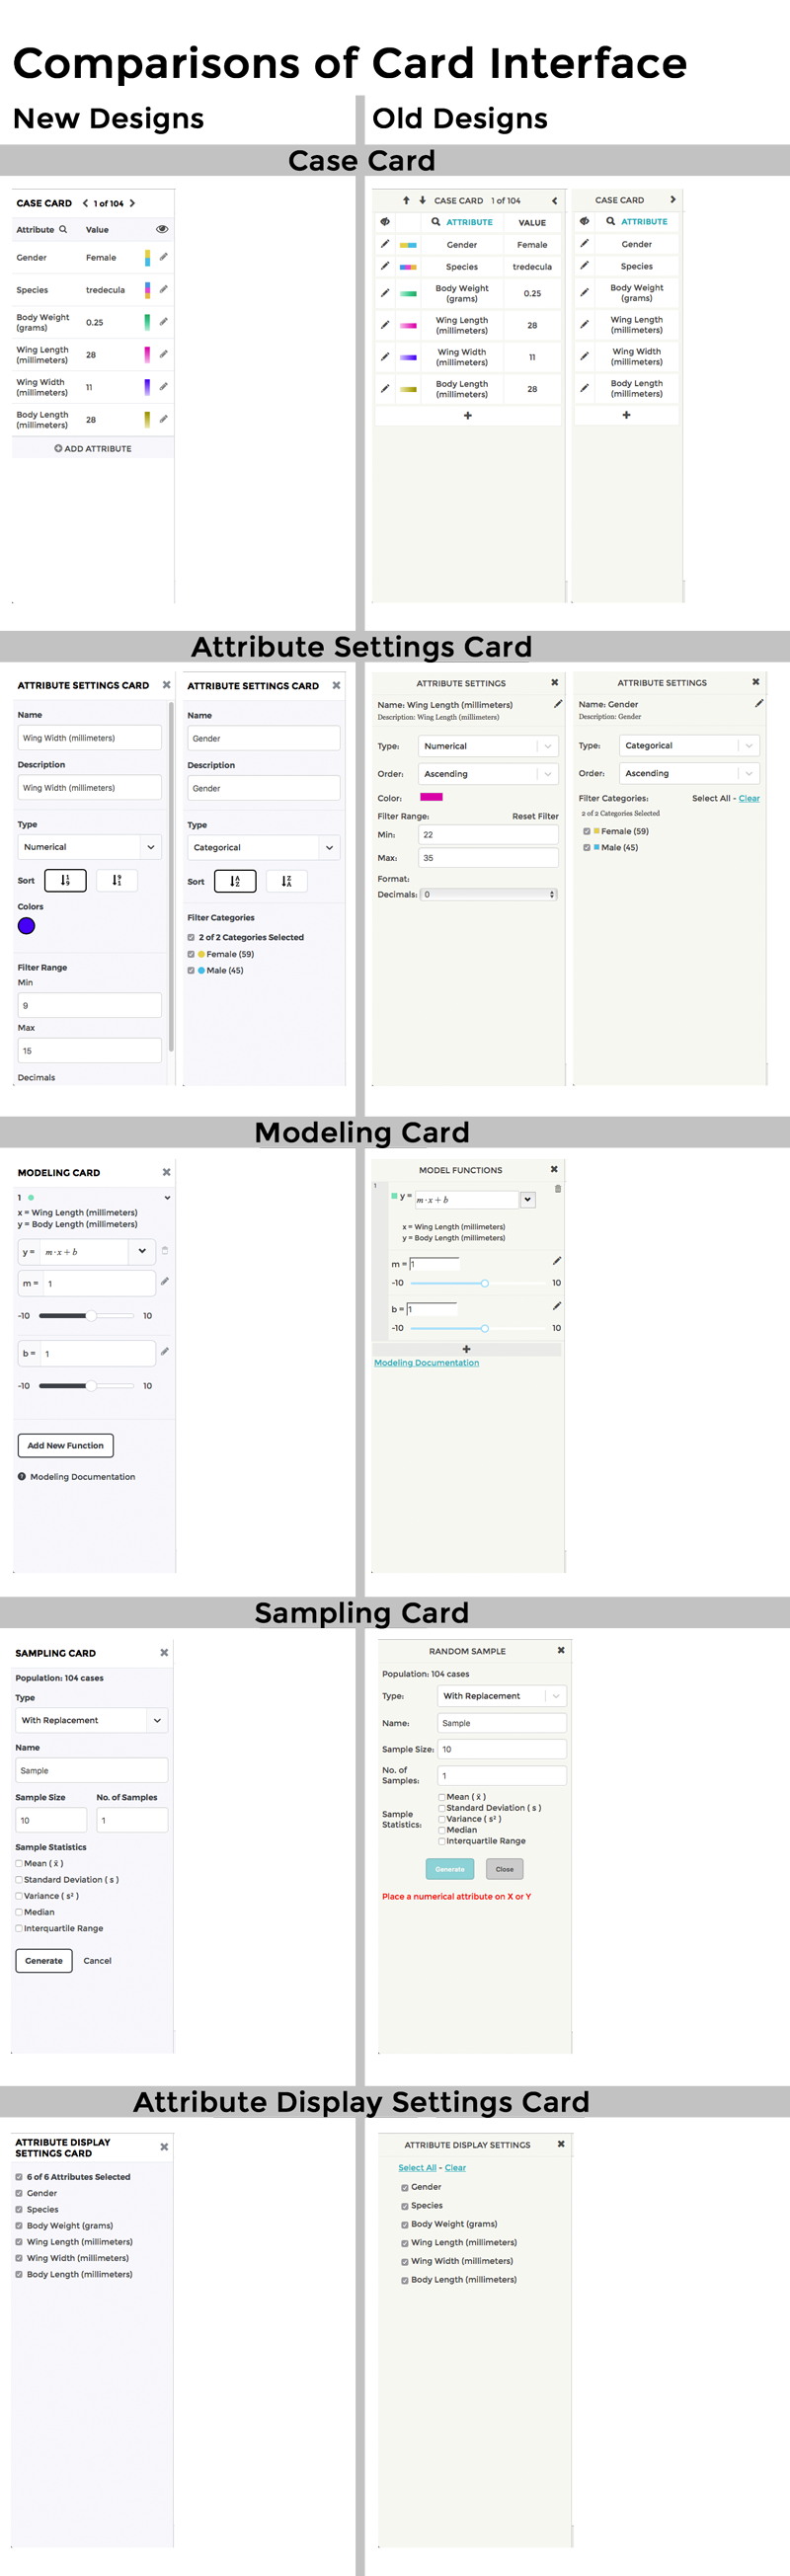
The main change that comes with 2.3.0 are the redesigned Tuva Data Tools. In the two images below we can see comparisons of the old and new versions. As you read through many of the bulleted items below, you will want to refer back to these images.
Changed:
- Cards:
- Updated the font, background, border, hover, and active styles for the following cards to ensure they provide a high contrast interface: Case Card, Attribute Display Settings Card, Add New Attribute, Modeling Card, Sampling Card, and Attribute Settings Card.
-
The overall design of the Case Card has been
changed. It no longer collapses and expands,
this change has been made to improve the
experience and overall performance of the
plotting area. Previously, animations would
trigger when the user clicked on a case, which
would open the Case Card. The order of the
Attribute, Value, Color, and Edit columns have
also been updated and resized to fit within a
280 pixel width. The decrease in the width of
the Case Card is to give more space to the
plotting area and the toolbar.
In the image below you can see side by side comparisons of the old and new designs. - We've enhanced the Modeling Card's function text field to allow sideways scrolling to fit longer equations.
- Tweaked the sampling card to notify users when they set their sample size to be larger than the population when sampling without replacement.
- Plot Toolbar:
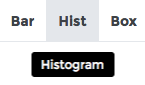
- Reorganized the plot toolbar menu options to better align with pedagogy. As a result of this, we also incorporated several new icons as replacements for buttons with text.
- Updated the font, background, border, hover, and active styles for the plot toolbar to provide a high contrast interface.
- The updated toolbar with its restructured menu options will now dynamically resize to accommodate different screen sizes.
- Changed the way the plot toolbar collapses menu items to accommodate smaller screens. Previously, the graph buttons would collapse under a single Graphs button. Now, we've added a More button that appears at the far right of the toolbar. When a screen is small or a browser window shrinks, toolbar buttons will begin collapsing under the More button starting from the right side.
- Changed how the Tuva Data Tools treats the reset button. It used to be treated as another graph type that would remain active, but now it's a one-time event that's triggered with no persistent active state.
- Bottom Bar:
- We've updated the design of the bottom bar containing the Table View, Summary View, and Sample Statistics to fit the high contrast aesthetic we've adopted.
Added:
- Cards:
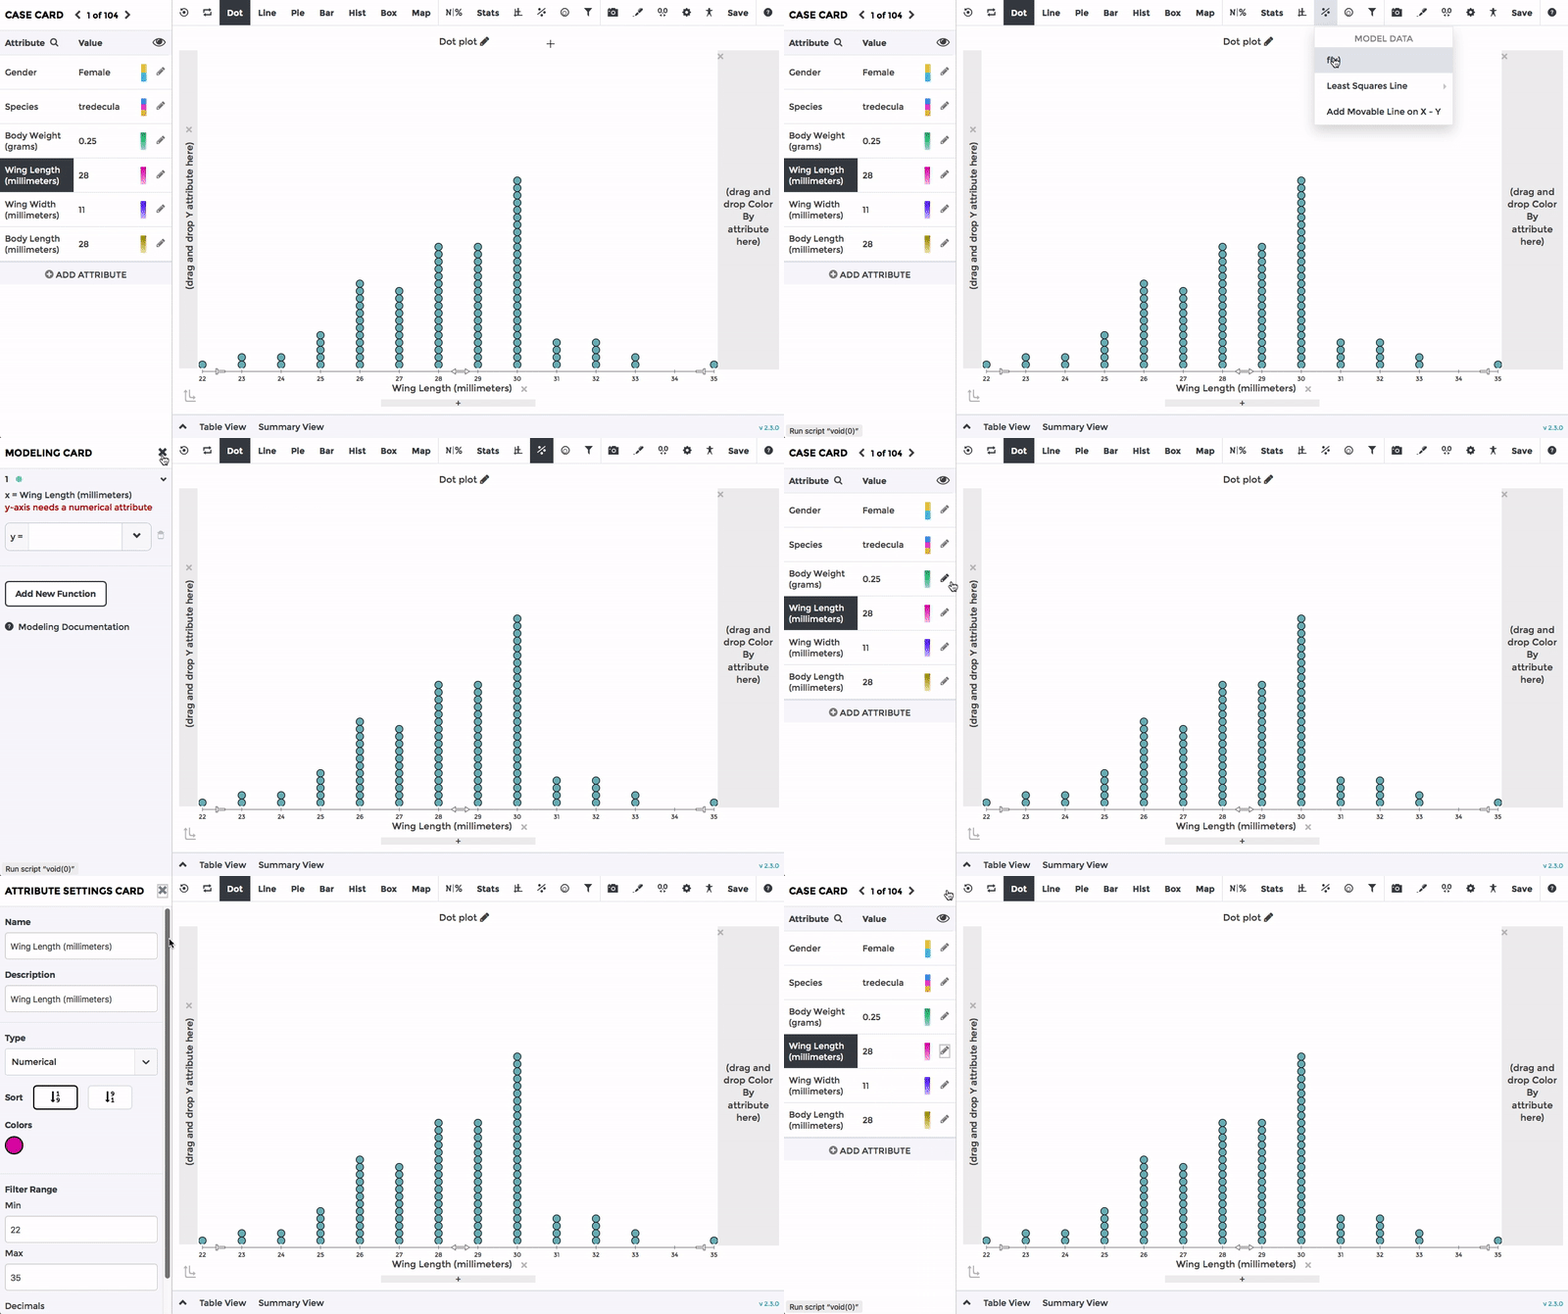
- We've added animations when transitioning between different cards. This is to help users notice a change has taken place in the left panel of the data tools when they click to open a specific card from the toolbar.
- Plot Settings:
- We've added a Plot Settings card containing many of the previous menu items present in the settings menu. We've done this to give more space to the different settings options.
- The Plot Settings card now offers users the functionality to set a specific minimum and maximum range for the X and Y axes.
- Accessibility:
- We've added a dedicated Accessibility card containing controls to turn on or off a number of accessibility features.
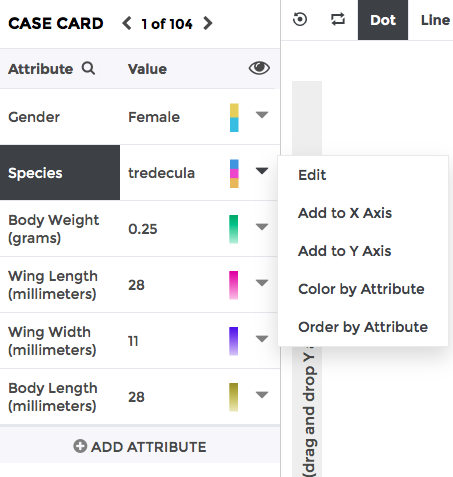
- We've worked on adding functionality to help users that are physically unable to use the mouse to interact with the Tuva Data Tools. If a user enables the Attribute Keyboard support, they will see a dropdown appear in the Case Card next to each attribute. This dropdown gives users the option to add the respective attribute to the X axis, the Y axis, to the legend, or to order the data by that attribute all from the keyboard. Previously, users would need to drag and drop with the mouse in order to accomplish these actions.
- We've added API support for newly added functions like enabling/disabling grid lines, increasing/decreasing font size, increasing/decreasing case size, turning animations on or off, showing or hiding statistica labels, and several others.
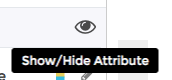
- Added a new tooltip design across the toolbar and cards.
- Added language support for Korean and filled in a few more missing translations for previously supported languages.
Bug Fixes:
- Fixed an interface issue where a black dotted line appeared on the bottom border of a button when that button was clicked.
- Fixed a bug that cropped up when finding the nth root of a variable.
- Fixed keyboard accessibility issues on the sampling and modeling cards.
- Fixed an issue with the Add New Attribute functionality. The issue involved selecting a second attribute from the attribute dropdown while already having a formula present in the formula editor. The second attribute would appear in the right location within the formula.