Tuva Tools v2.15.0
Released 9/21/2022
This release focuses on two major items: adding a context menu for histograms to enable the user to choose the histogram scale as well as bin annotations to quickly provide support for dragging categories on the axis as well as in the legend to flexibly visualize and analyze data. Apart from these, we have also made a few small enhancements and bug fixes.
Added:
-
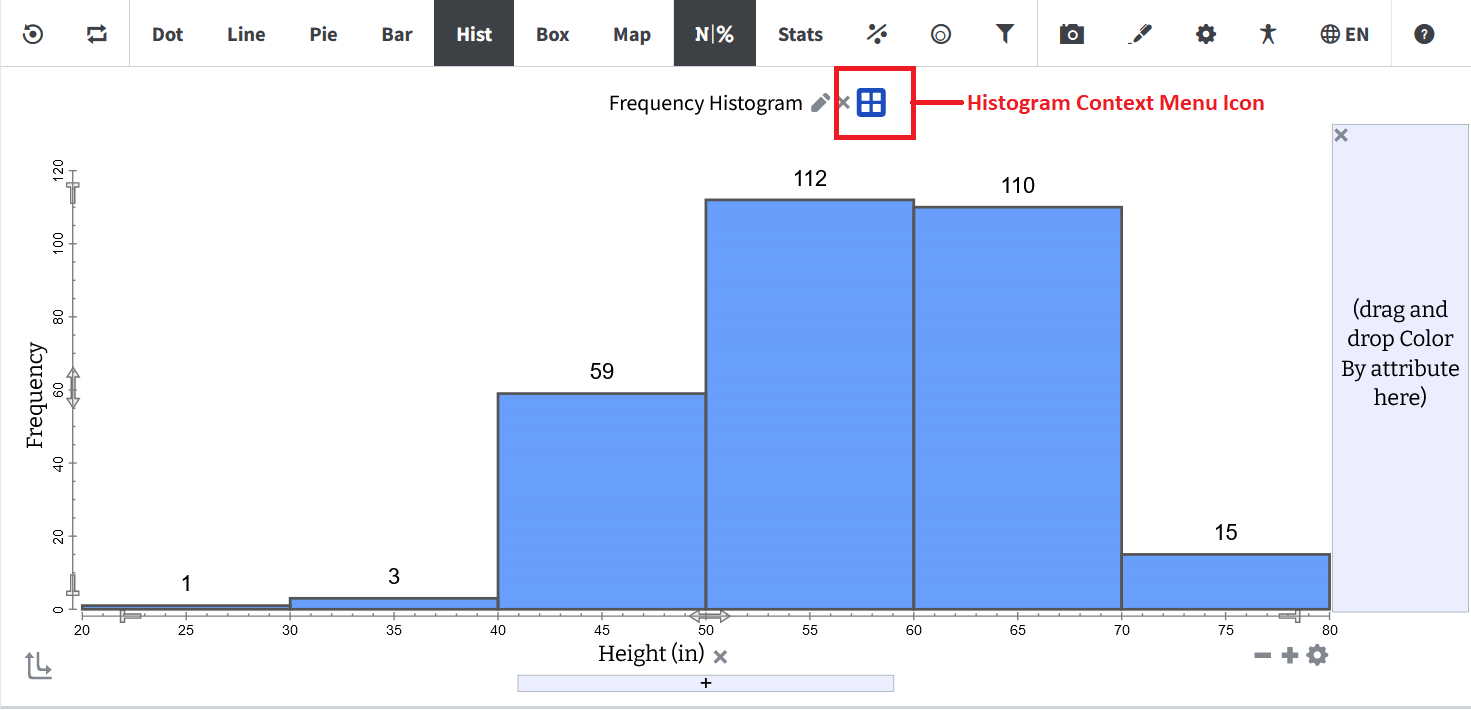
Histogram Context Menu: We have added a context menu for Histograms that
allows you to learn at a glance the variety of actions you can perform in terms of choosing
its scale and annotating numerical measures for its bins. You can access the menu by
clicking on its icon which is located adjacent to the graph title.
Like all other context menus in Tuva, the Histogram context menu also has two sections. The top section is devoted to specific actions you can do with the element it is tied to and the bottom section gives you generic options related to graphing.
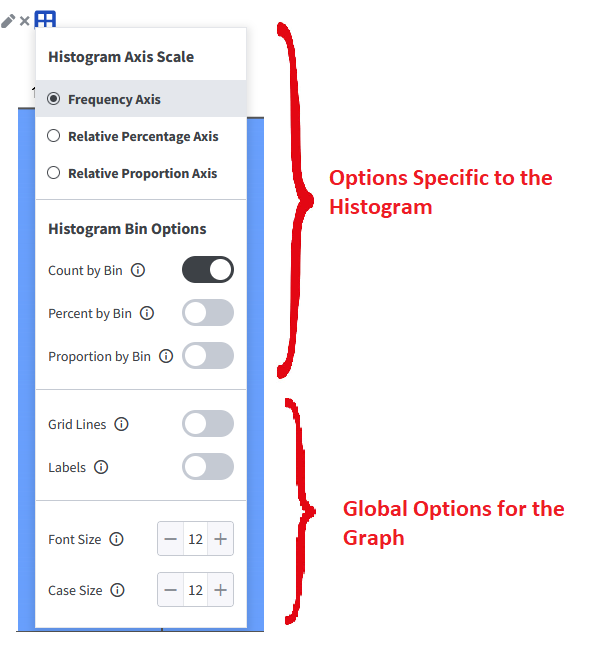
Please note that we are still working on syncing different context menus when multiple objects with menus are placed on the graph. -
Manipulating Categories on the Axis and the Legend: We have added an
exciting new feature to our suite where the user can drag and reposition categories right on
the axis. This reorganization can also be done in the legend, if a categorical attribute is
applied to it.
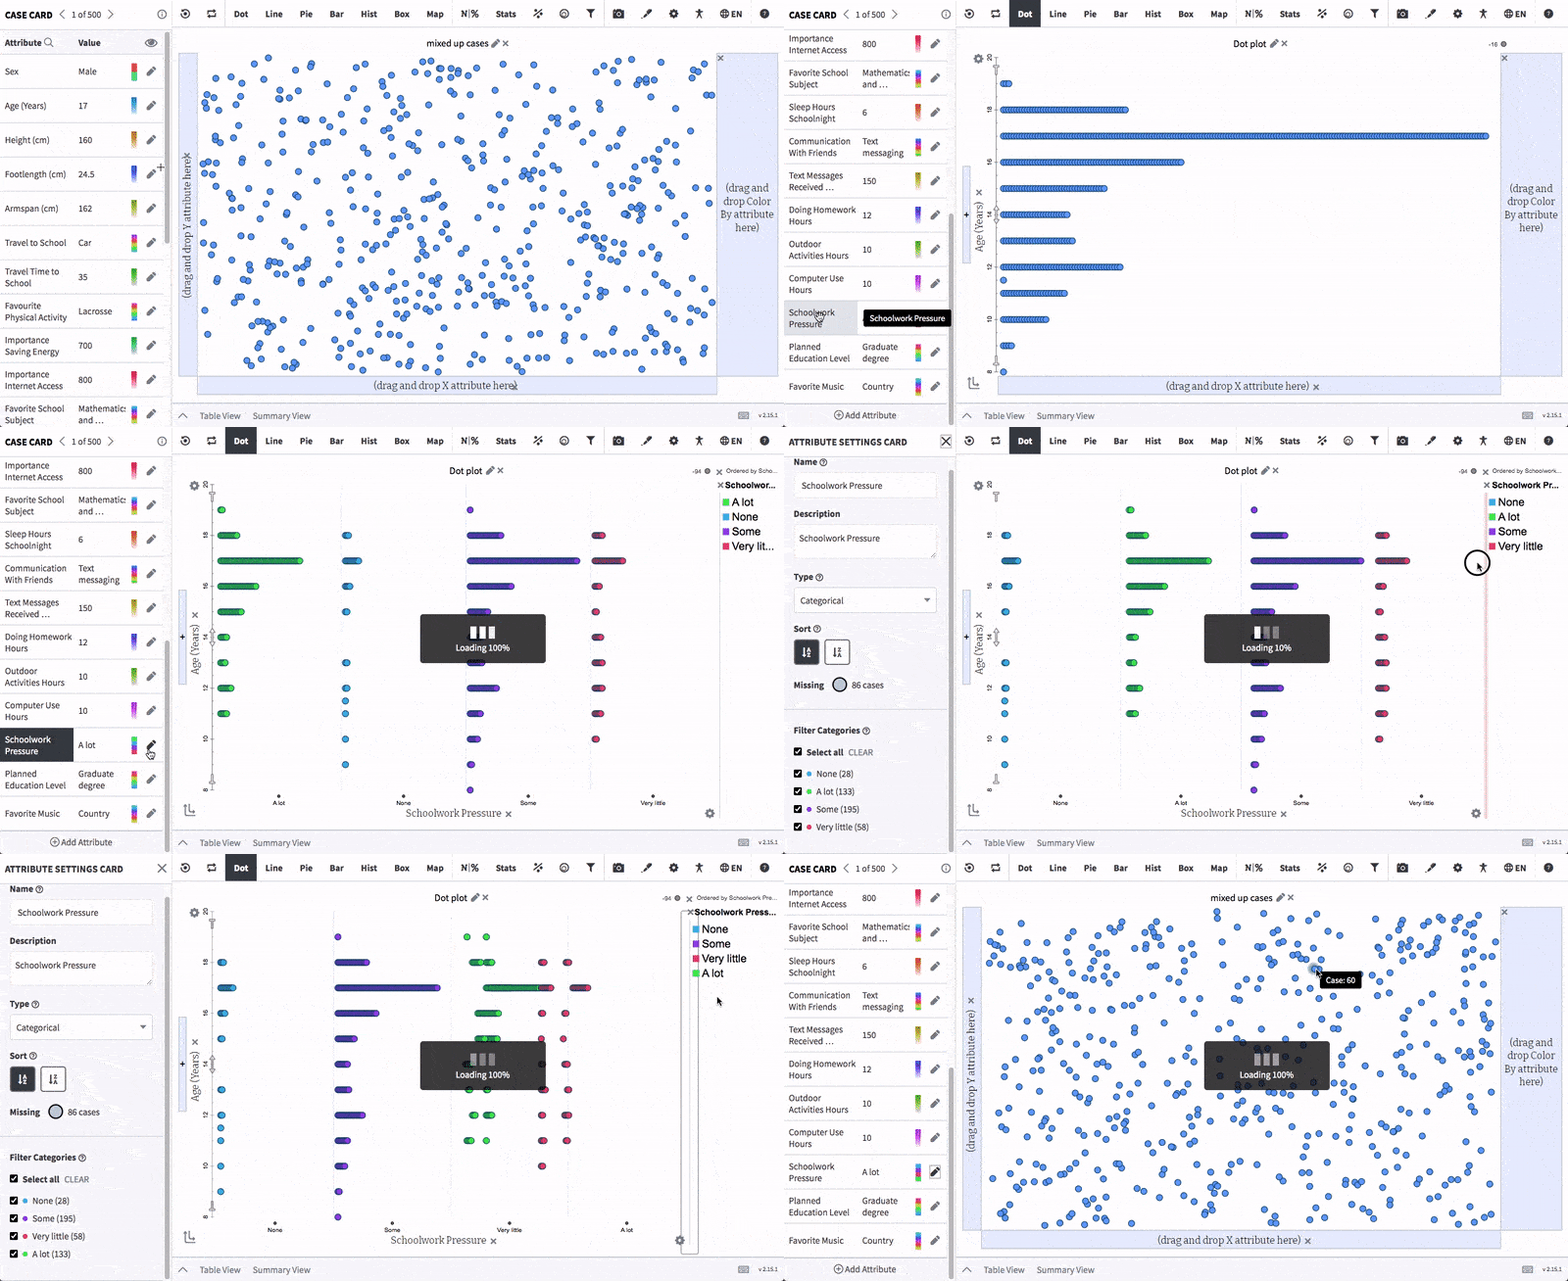
Note that as you drag a category and reposition it, the order of the categories in the legend and the filter categories (Attribute Settings Card) changes to reflect the new order! - New Translations: In continuation with our effort to reach out and cater to the needs of users from diverse linguistic backgrounds, we have added a bunch of new translations which includes the Histogram context menu items.
Changed:
-
Context Menu Accessibility: The context menu icon was getting lost in busy
graphs; thus, we updated the design to increase its size and the color-intensity for easier
discoverability.
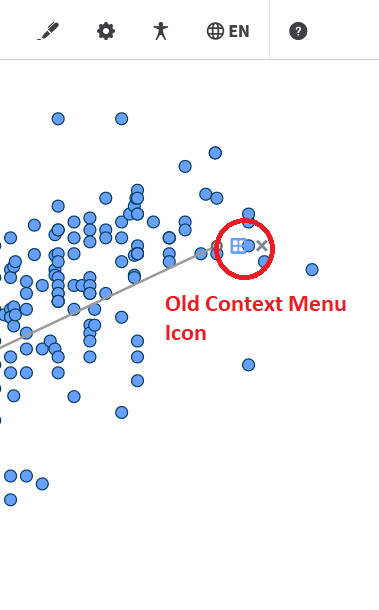
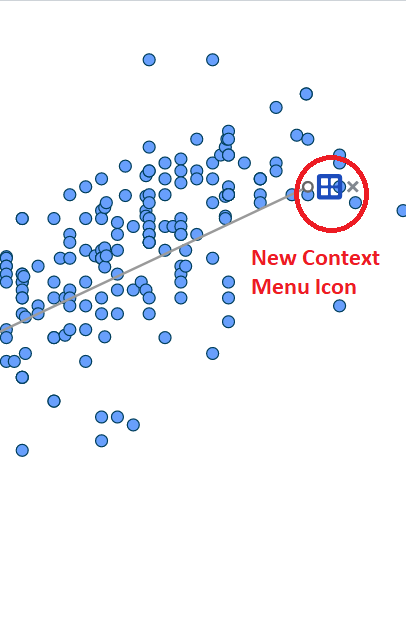
Please note that we are still working on making the icon even more conspicuous in a noisy graph and the optimal layering of the icon & the data points in such graphs. - Ensuring Consistency in Significant Figures Calculations: We have worked on making the computations for significant figures consistent across numerical & statistical measures, graph types and the Summary View. It is a progressive change and we have wrapped up the first iteration successfully.
Bug Fixes:
- Histogram Bug: We fixed a bug where changing the histogram type was resetting the bin resolution to the default number.
- Modeling Card Bug: We found and fixed a bug with the Modeling Card where hovering over the slider was resulting in the screen blanking out.