Tuva Tools v3.0.3
Released 9/15/2023
In this release, our primary focus has been on fine-tuning Tuva Jr. through a series of small enhancements and bug fixes. Additionally, we continue our dedicated efforts to enhance usability and accessibility of the Tuva tools, ensuring a smoother and more inclusive user experience.
Enhancements for Tuva Jr.
-
Layering Issue with Context Menu: In the previous version of Tuva Jr., we encountered an issue where the context menu would appear behind certain UI elements, making it difficult to access and use certain features.
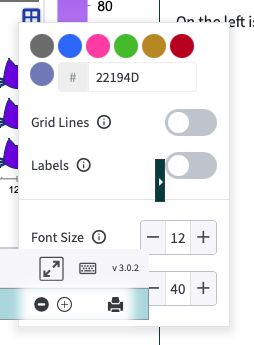
We have updated the layering logic to ensure that the context menu consistently appears in the forefront.
Hiding Redundant Items in Tuva Jr.:
-
Line Graph Menu Items: Previously, a redundant submenu for the line graph was present in Tuva Jr.'s toolbar. However, this submenu was unnecessary as it contained only a single menu item.
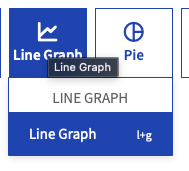
In this release, we've streamlined the user interface by removing the redundant Line Graph submenu, simplifying the menu structure for younger kids. -
Context Menu Items: Previously, the context menu in Tuva Jr. included options such as "Dual Axis" and "Show Squares" that were not relevant to the elementary school-aged users of the platform.
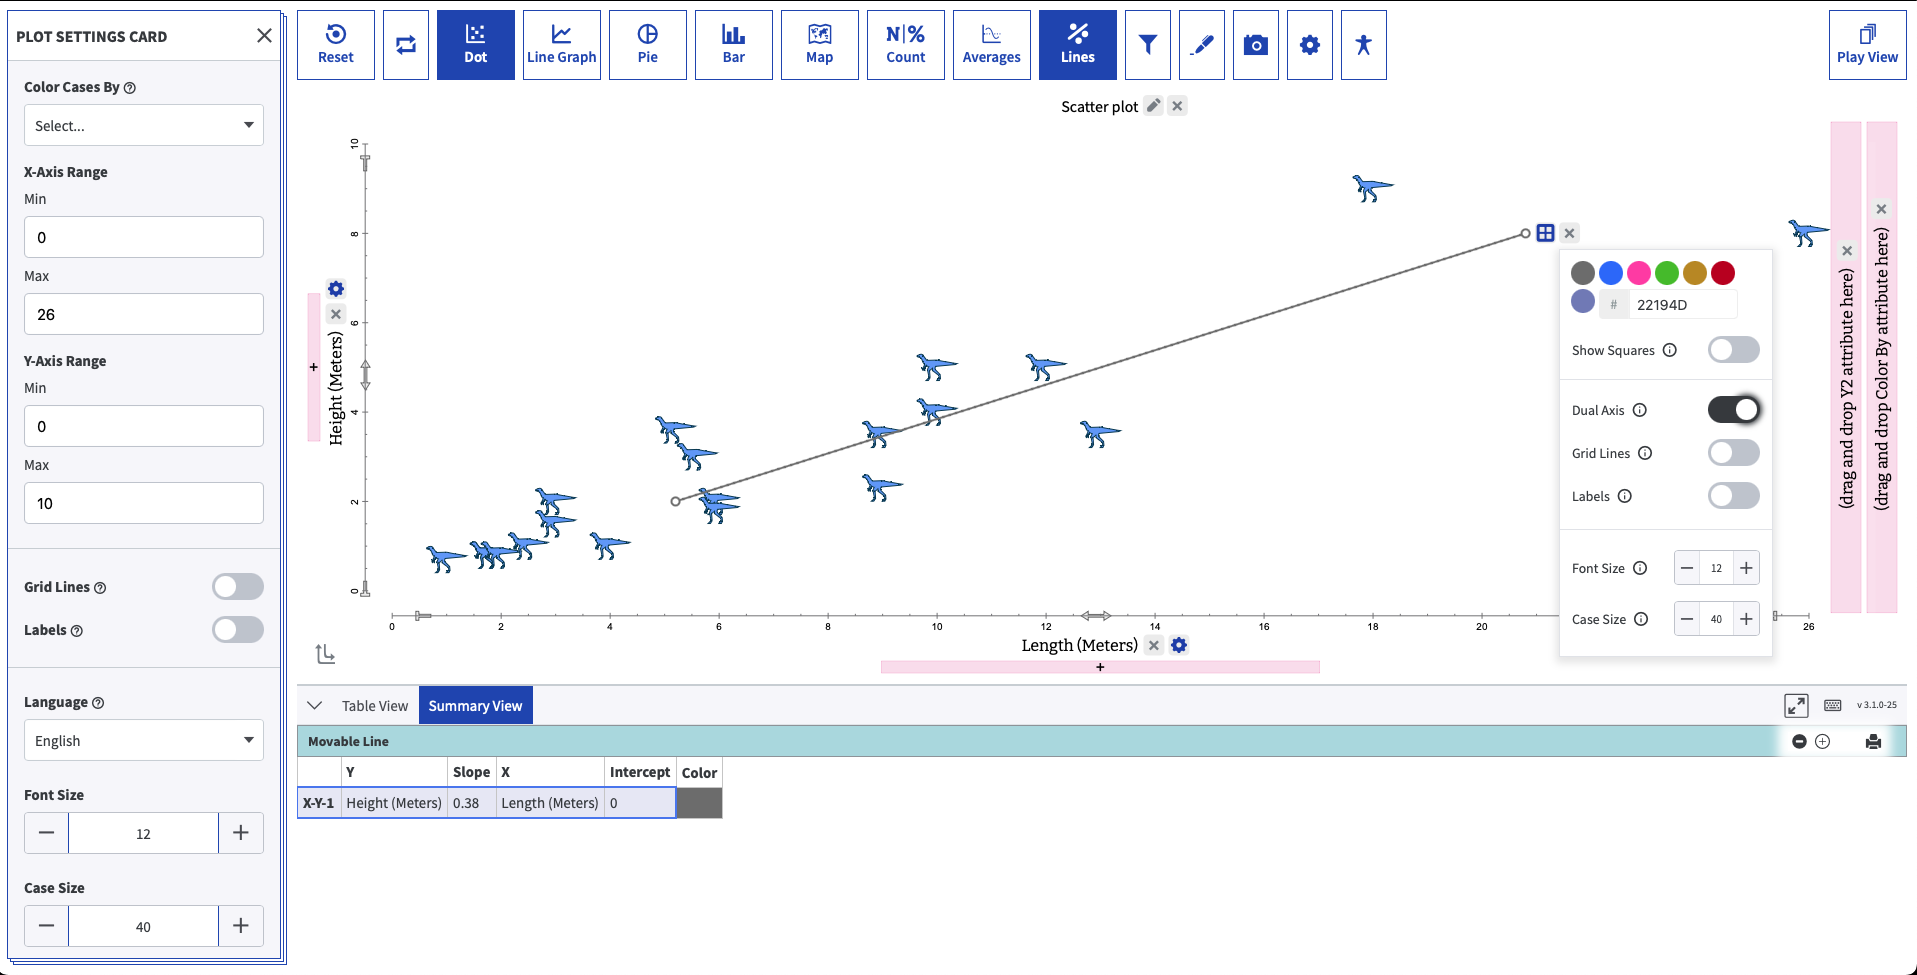
In this release, we have improved the user experience by hiding these superfluous options in the context menu. -
Lines Submenu: In the previous version of the tools, there were options available for adding reference lines on the Y2 axis and movable lines on the X-Y2 axis.
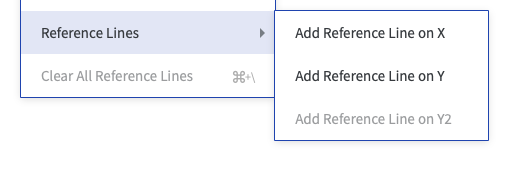
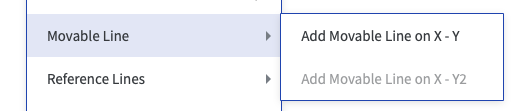
In this update, we have concealed these advanced options, as they were deemed unnecessary for elementary school-aged users.
Default Tooltip in Play View:
In the latest Tuva Jr. enhancement, we have introduced a feature that allows the display of a default attribute value when hovering over the cards.
-
Default Behavior: By default, this feature will automatically select the first attribute from your dataset and display it on the tooltip. For example, if the first attribute is the name of an animal, the tooltip will show the name of the animal when hovered over.
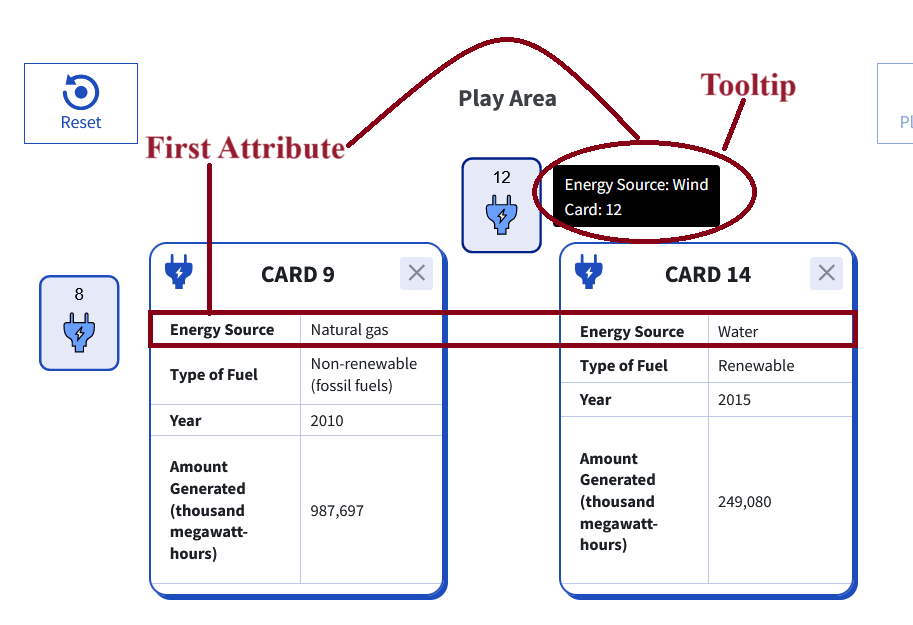
- Custom Attribute Selection: Alternatively, you have the option to specify a different attribute for the tooltip. To do this, update the dataset metadata by adding the field "tooltipAttributeIDs" and providing an array of attribute IDs you wish to use.
- Reset Function Enhancement: The Reset function now includes the reset of significant digits, encompassing both attribute settings panel and Summary View adjustments for increased or decreased precision.
Saving & Restoring Randomly Placed Cards:
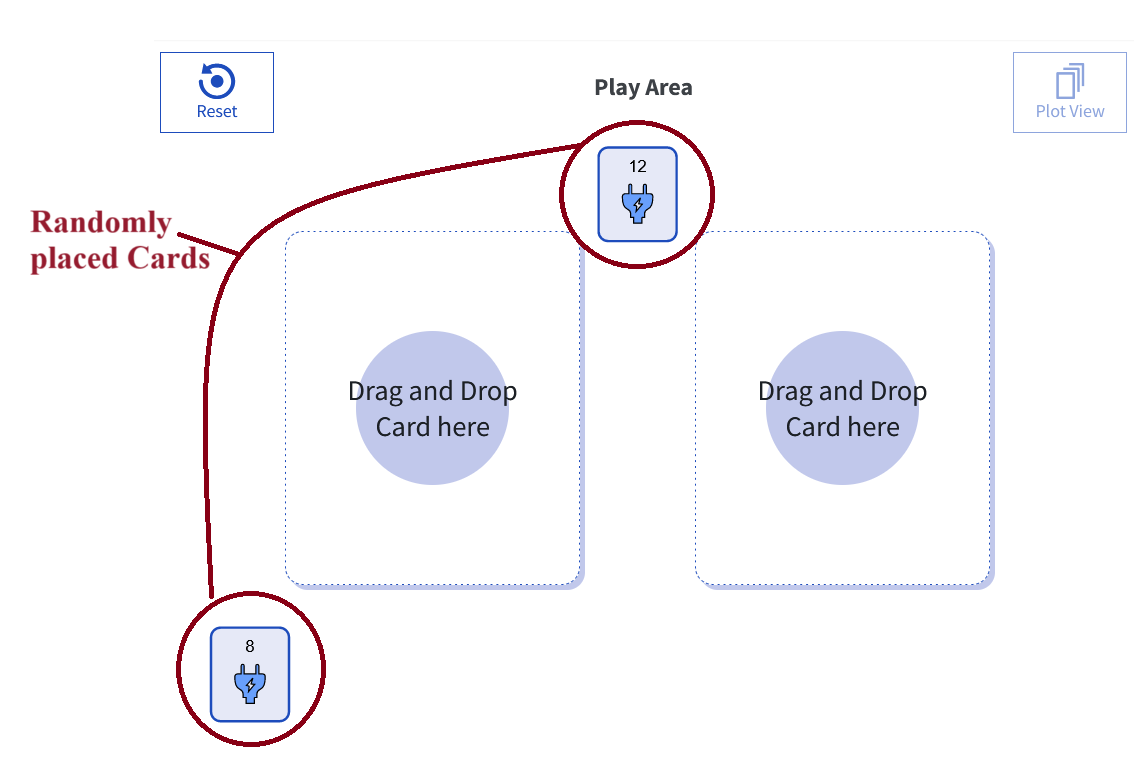
We have implemented a significant improvement where the placement of cards in random locations within the Play Area will now be saved and restored as an integral part of the plot state.
Bug Fixes for Tuva Jr.:
-
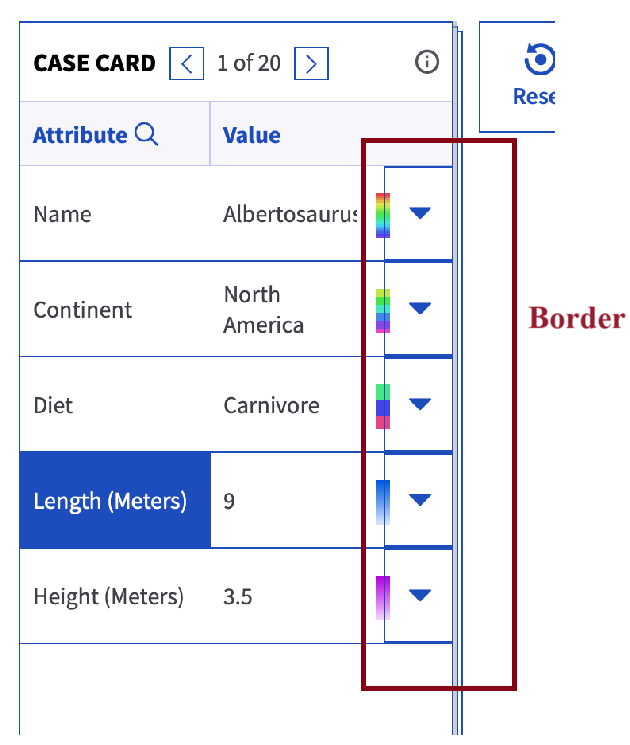
Border Display Problem in Tuva Jr. Plot View: We encountered and fixed a CSS issue in the Case Card of the Plot view, where an unexpected border was appearing around each attribute's accessibility dropdown menu.
-
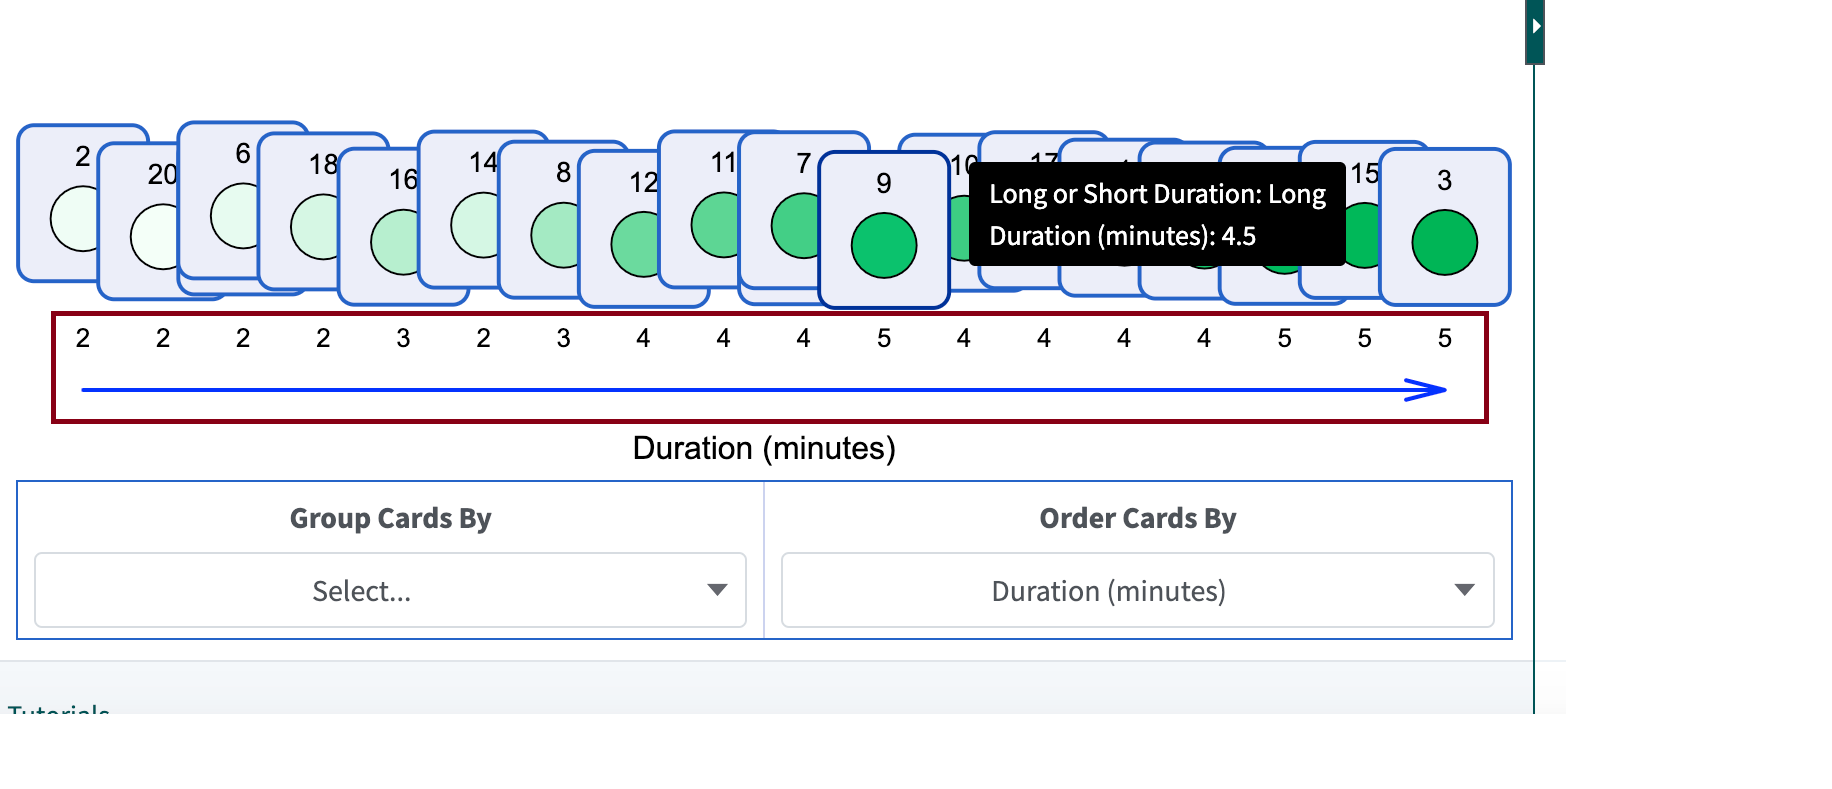
Incorrect Card Order & Values Display: We identified and fixed an issue in the Play view where ordering cards by a numerical attribute with decimal values was resulting in incorrect card order and values display.
Tuva Tools:
Added:
Changed:
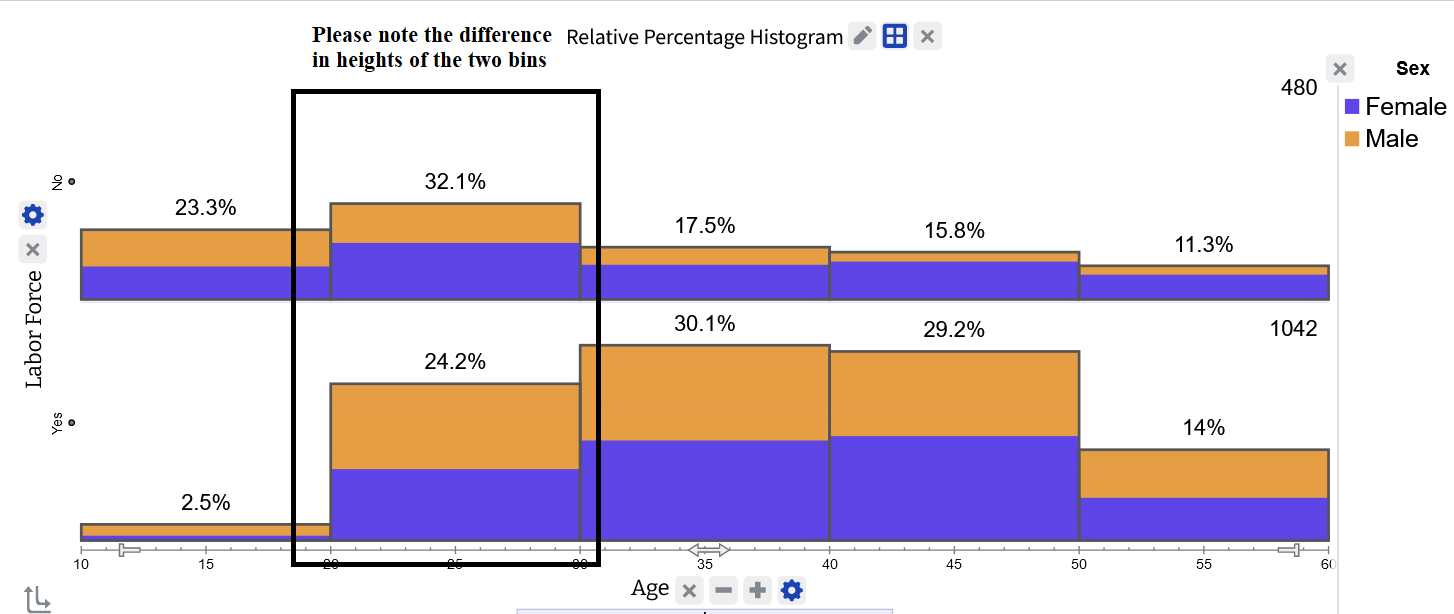
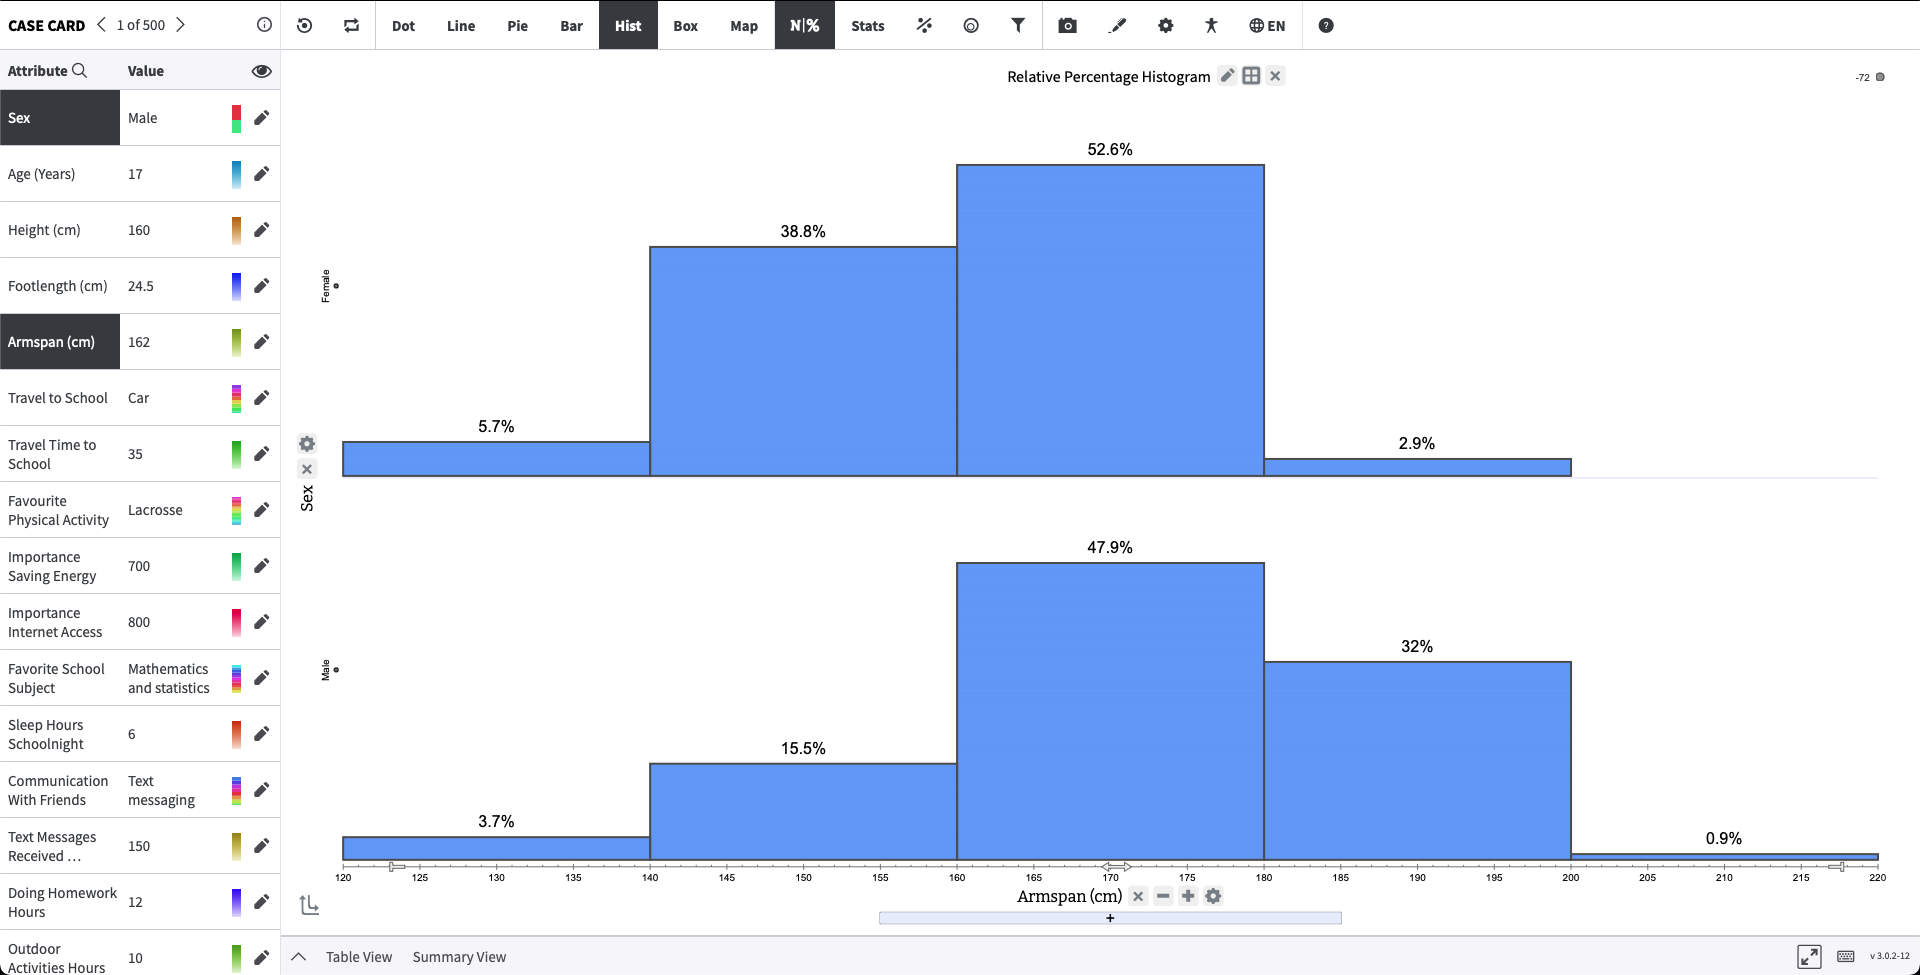
We have now fixed this issue when comparing categories with relative histograms.
Bug Fixes:
In addition to these enhancements, we have fixed several bugs to ensure a smoother user experience.
- Hide Attribute & Edit Data Bugs: We fixed an issue with the edit data more that was causing the incorrect cell from updating when an attribute was hidden via the attribute display settings card.
- Missing Decimal Values in Legend: We fixed an issue with decimal values not appearing in the legend after converting an attribute from numerical to categorical.
- Swap Axis Bug: We fixed an issue with the axis labels that cropped up on click of Swap Axis. When an attribute was on either the X or Y axis and the drop area was visible on the adjacent axis, clicking the Swap axis would also swap the drop area label.
- Narrowly Clipped Points on Map: Previously, the Map plot displayed the map over the entire background, including the title, legend, and axes, causing data points to be concealed beneath these elements. This was particularly problematic when points were truncated on the right-hand edge, where the legend would appear even if it wasn't currently visible. We have now resolved this issue by adjusting the clipping area for the map plot, allowing data points to be drawn all the way to the edge of the plotting area.