Tuva Tools v2.16.2
Released 5/13/2023
This release of the Tuva tool brings several bug fixes and enhancements to improve usability, flexibility, and accessibility. The highlight feature is the enhanced table view, which now allows users to expand it across different instances, providing greater flexibility when working with tabular data. The release also includes the addition of more language translations, making the tool accessible to a wider range of users. Furthermore, efforts have also been made to enhance the visibility and prominence of the settings menu and other buttons in the graphing area, ensuring a more intuitive and user-friendly experience.
Added:
- More Language Translations: We expanded language support by adding several new translations in our bid to support diversity.
Changed:
-
Enhancements to the Table View: We have enhanced the Table View to promote a more efficient and streamlined data analysis experience within the Tuva tool.
- Support for Expanding the Table View:
We have added the option to maximize the table view across different instances, including Tuva datasets & lessons, User uploaded datasets and Partner datasets, for increased efficiency in working with tabular data. Users can access the feature from the bottom toolbar by clicking on the Expand Button.

Once selected, the data table occupies the entire available screen space. The table can be minimized again using the Minimize Button.
This enhancement is particularly beneficial for partner embeds, where screen space is often limited. By maximizing the table view, users can work more seamlessly with larger tables, eliminating the need for excessive scrolling or resizing. - Addition of Case Icon in Case No Column: To strengthen the understanding of individual cases, we are now displaying a case icon in the column dedicated to case numbers.
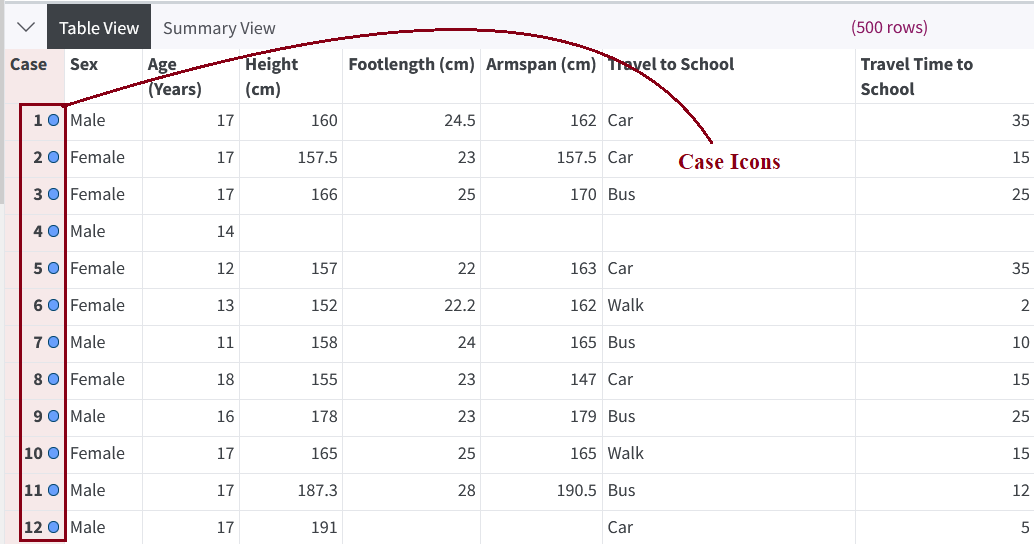
In elementary datasets, data points represented as SVG images are displayed in the column. - Integrating Excel Compatibility for User Uploaded Data: As part of our efforts to provide a robust spreadsheet support offering, we have added support for users to open the data table in Excel. This addition aims to provide a familiar interface for users, enabling easy data input, simple error correction, and utilization of formulae, thus enabling a more efficient and familiar data management experience.
- Support for Expanding the Table View:
We have added the option to maximize the table view across different instances, including Tuva datasets & lessons, User uploaded datasets and Partner datasets, for increased efficiency in working with tabular data. Users can access the feature from the bottom toolbar by clicking on the Expand Button.
- Enhancements to the Settings Menu and Other Buttons: We have focused on enhancing the visibility, prominence, and discoverability of various elements within the graphing area, including the settings menu button and other buttons. This was also done to achieve a consistency in design and to facilitate smoother navigation and control.
- Enhancement to ARIA Labels: ARIA labels have been updated to offer enhanced contextual information about specific interactive elements, further clarifying their purpose.
- Metadata made Optional: Metadata is now optional when loading data from a simulation or another source in the Tuva Tools, providing users with the flexibility to choose whether to include metadata.
Bug Fixes:
- Issue with Insert Data: We identified and fixed a bug in the table view where pressing enter on the last row would cause the keyboard focus to jump to the top of the next column instead of the cell below.
- Issue with Remove Attribute Button: We resolved an issue where the remove attribute button would incorrectly overlap the attribute text in Chrome on Mac computers.
- Issue with Parsing Year-Month Date Format: We fixed an issue with parsing year-month date format that caused data shifting by one month. For example, saving 2020-jan, 2020-feb, 2020-mar would result in 2019-dec, 2020-jan, 2020-feb.
- Issue with Calculated Stats for Date-Time Attributes: We resolved an issue where the IQR stat label was displaying date values as milliseconds. The issue has been fixed, and the IQR stat label now correctly displays the date values in the appropriate date format.
- Issue with Min-Max Fields for Date-Time Attributes in the Plot Settings Card: We fixed an issue in the plot settings card where the min and max fields displayed a long string of digits instead of date time values when graphing multiple date time attributes on a single axis. The issue has been resolved, and the min and max fields now correctly display values in the same format as the first attribute added to the axis. If there are additional date time attributes on the axis, the min and max fields will default to the format of the first attribute added.
- Issue with Handling Missing Values in Map Plot: We resolved a minor issue in the Map plot where handling of missing cases for the Y-axis attribute was incorrect.