Tuva Tools v3.0.5
Released 11/20/2023
In this release of the Tuva tools, our main emphasis was on introducing a series of minor improvements and fixes to Tuva Jr., as well as addressing various issues pertaining to accessibility of the tools.
Enhancements for Tuva Jr.
-
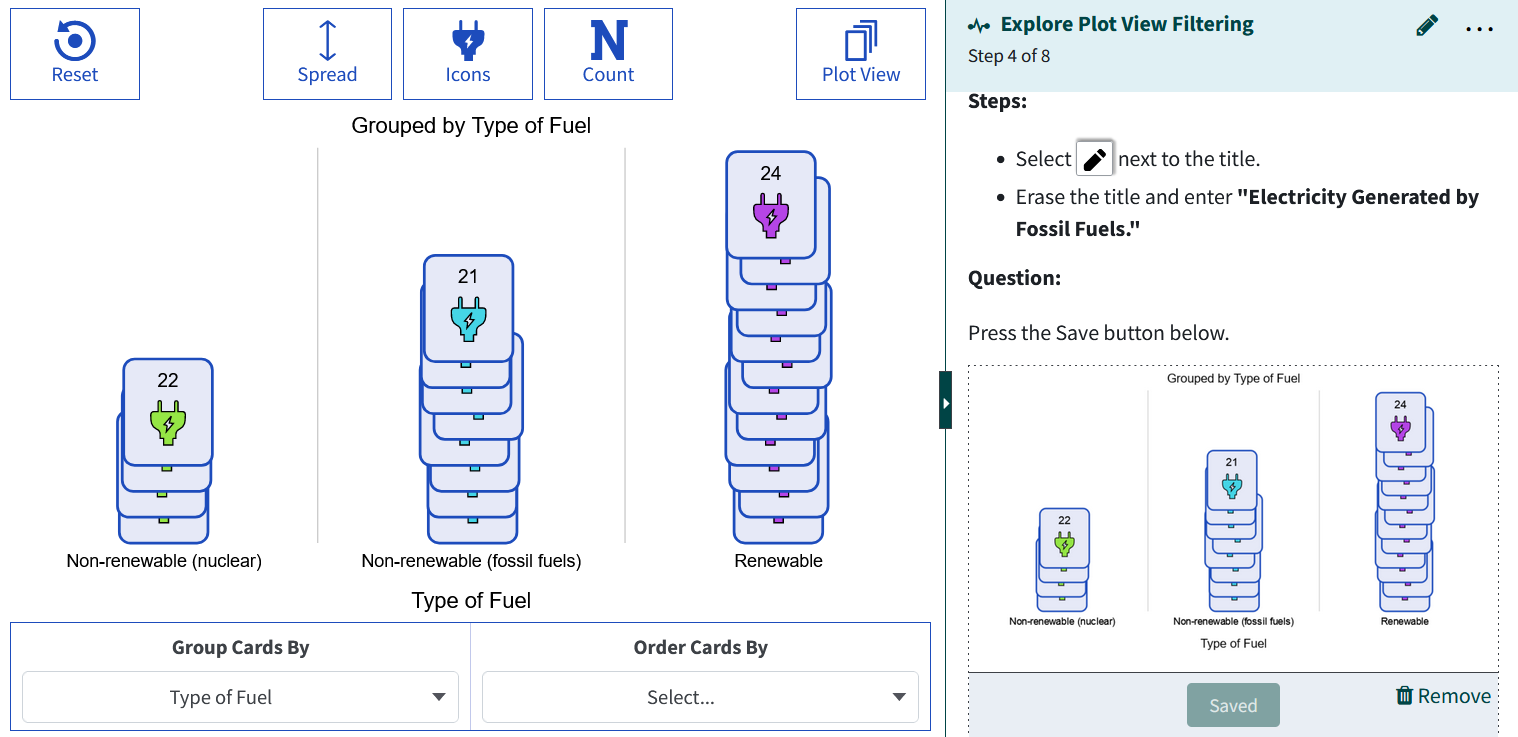
Support for Graph-type Answers in the Play View: In the previous version, it was not possible to convert the Play View visual into an image when attempting to submit responses to questions that required graph-type answers. We have now added support for capturing Tuva Jr. graphs as images.
-
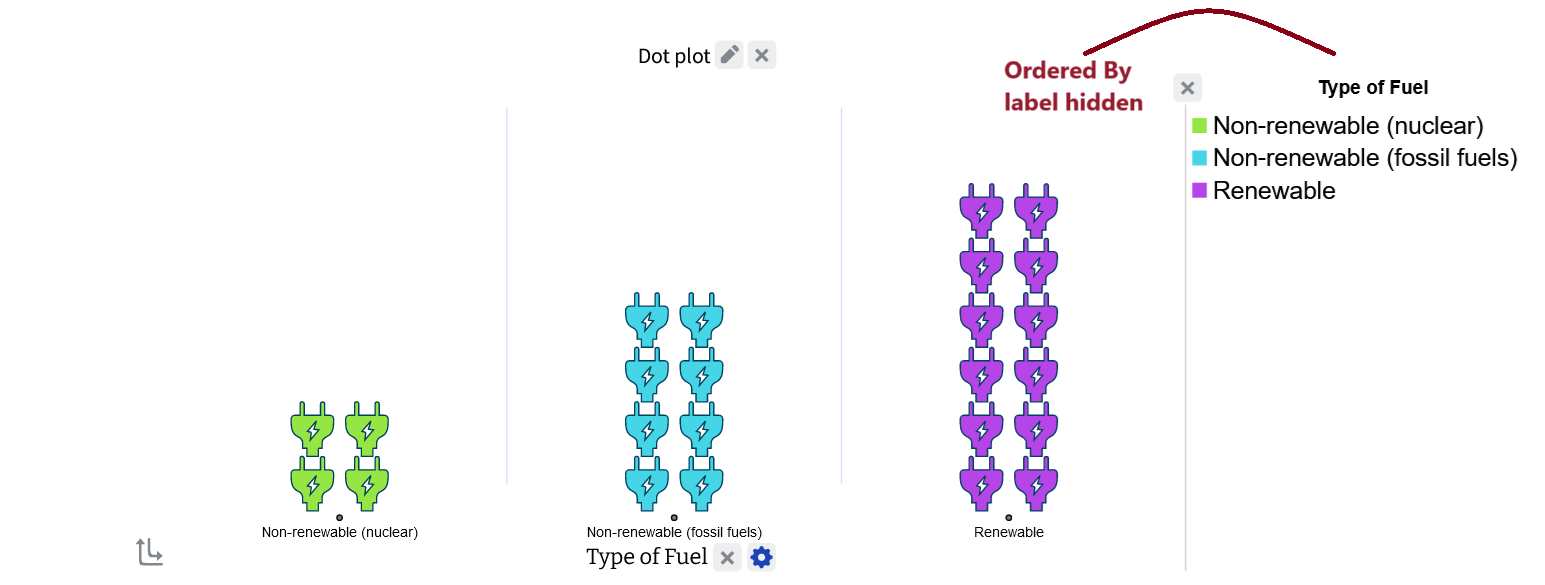
Hiding Order By in the Plot View: We have made modifications to the Tuva Jr. Plot View, ensuring that the ‘Ordered By' label above the Legend area is now hidden by default, and will only become visible if the user opts to enable it through the Plot Settings card. This update aims to reduce any potential confusion arising while comparing between the ‘Order By' option in the Play View and the ‘Ordered By' label located in the top right corner of the Plot View.
-
Accurate Display Format for Year Values converted to Categorical: We've refined the attribute parsing algorithm to ensure that 4-digit numbers are not processed as typical numbers that would incorporate a comma. Instead, they are recognized as year values and presented without a comma.
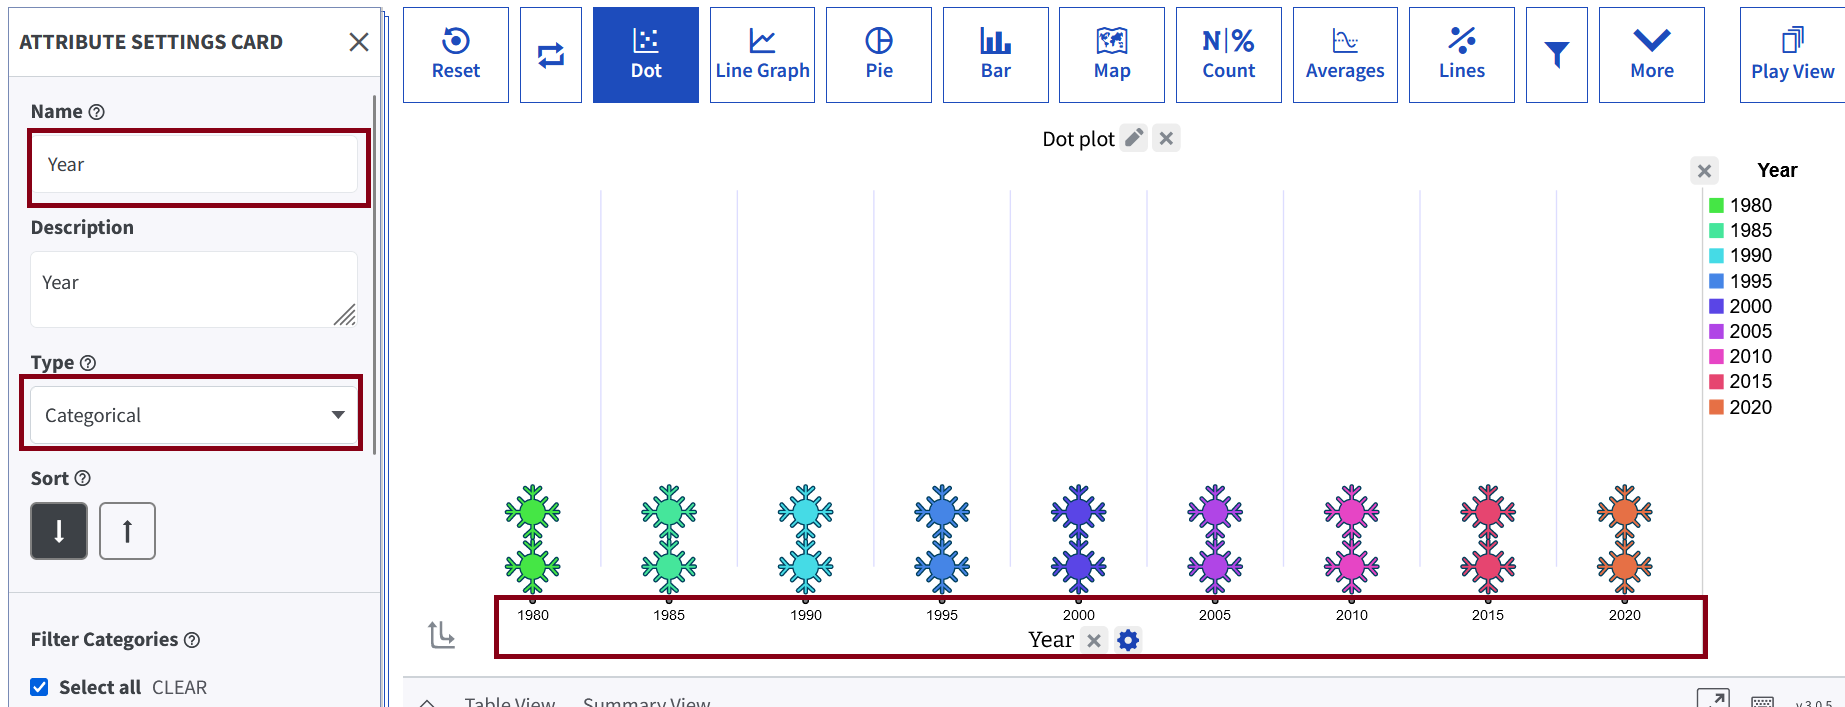
This enhancement is helpful when transforming a numerical year attribute into a categorical attribute, while maintaining the standard year formatting. -
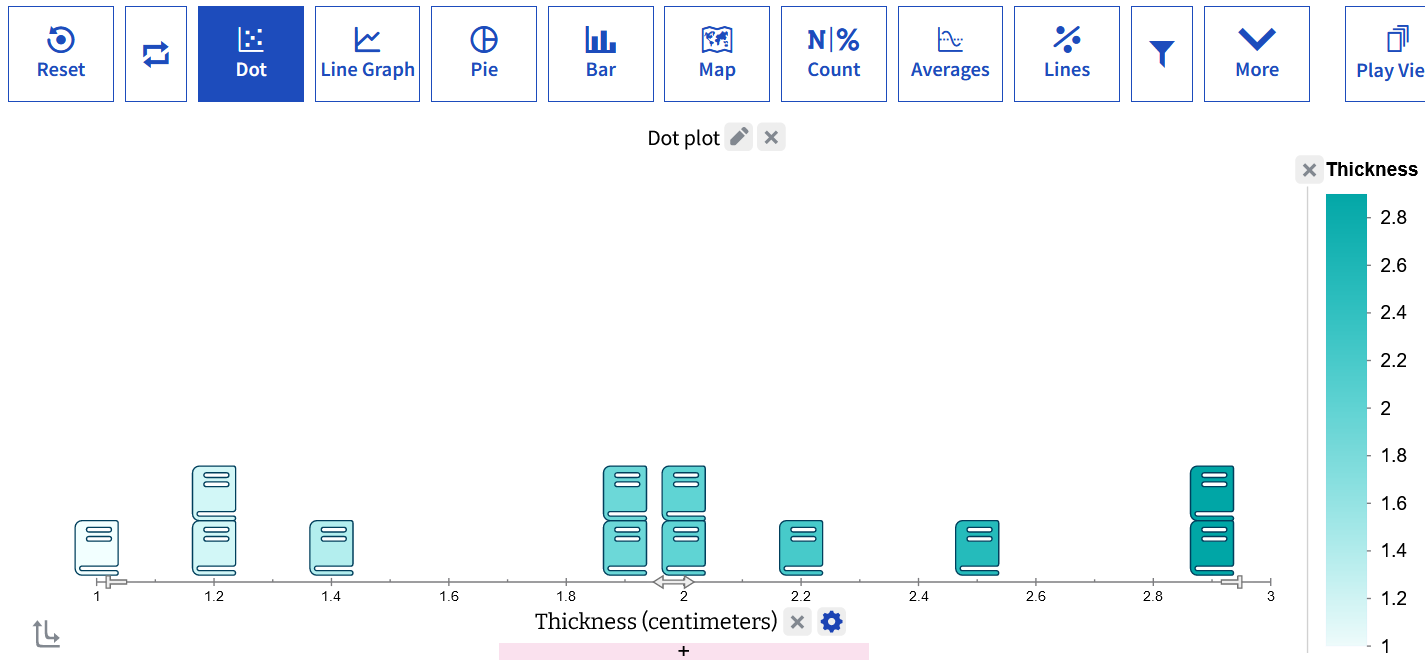
Center Alignment of Case Icons: We have made updates to the Tuva Jr Tools, ensuring that the icons are now centered on the axis tick marks, rather than being aligned to the icons' corners.
Enhancement to the Regular Tuva Tools
-
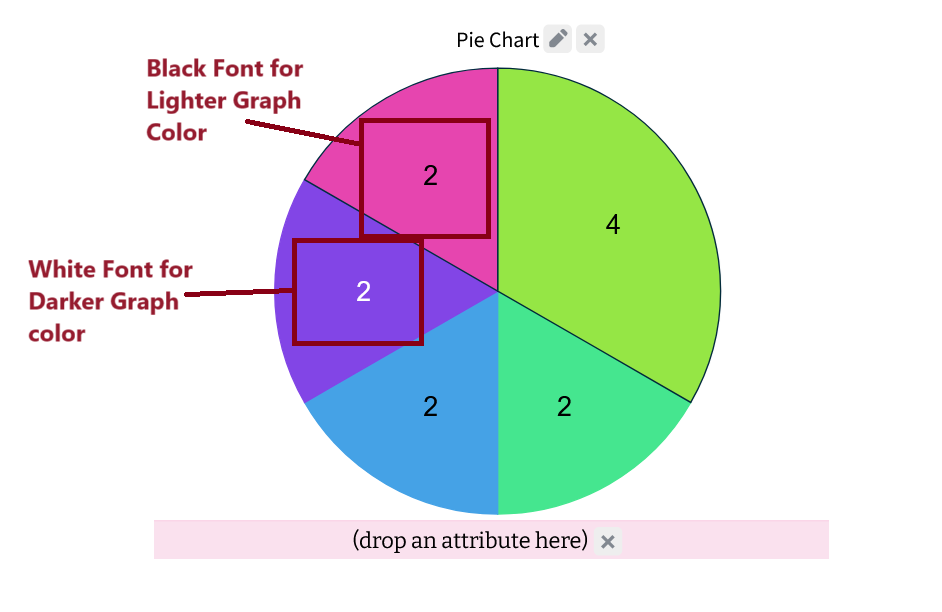
Adequate Color Contrast for Fonts & Graph Colors: We have incorporated a new logic to ascertain adequate contrast for the text displaying counts and percentages within sections of a pie chart or bar chart. To maintain a minimum level of contrast, the text color will now automatically switch between black and white as needed.
- Added New Translations: To support different languages and continue our theme of addressing linguistic diversity, we have added a few more missing translations.
- Support for Date Time Values in Categorical:Numeric Intervals: We have enhanced the Categorical: Numerical Intervals attribute type to properly support dates, times, years, other date-time values, and durations. We will no longer get an attribute with all missing values, no categories, and a black color bar.
Bug Fixes:
- Tooltip & Focus Logic for Toolbar Menus: We have identified and resolved an issue that was leading to a conflict between our tooltips and the toolbar dropdown menus, preventing the dropdown menus from opening properly. The dropdown menus are now functioning correctly and can be opened again.
- Filter Application Failure: We have identified and fixed a critical issue affecting the functionality of filters on individual sections of pie and bar charts. Previously, any applied filter was not being acknowledged, and attempting to activate the filter would result in a blank screen upon opening the Attribute Settings card.
- Random Appearance of Visual Artifacts: We found and fixed some visual artifacts that were occasionally appearing while rendering the pie graph.
- Layering Issue with Grid Lines: We have fixed an issue with the grid lines appearing in front of the case icons.
- Tiny Font Sizes in Bar Charts: We fixed a bug that was causing font sizes to be smaller than normal for bar charts.
- Issue with Restoring Saved Map Plot State: We fixed an issue with the Map plot state save & restore functionality where when the saved plot state loaded, the map plot was repositioning and zooming in.