Tuva Tools v2.1.2
Released 10/1/2019
Changed:
- The loading sign has been changed. It was previously a partially opaque circle with a progress bar and percent complete. We've changed it to 3 rectangular bars that flickr with a percentage completed to show how much processing is remaining.
- We made a few tweaks to the dropdown components in the Attribute Settings Card.
- Removed the number of attributes from the Sampling card because it's not relevant for measuring the total population.
- We've changed the footer of the graph image from black to white so it takes up less ink when printing it.
- We moved the image download button from the settings dropdown to the top level menu and removed the SVG download option.
Added:
- Accessibility:
-
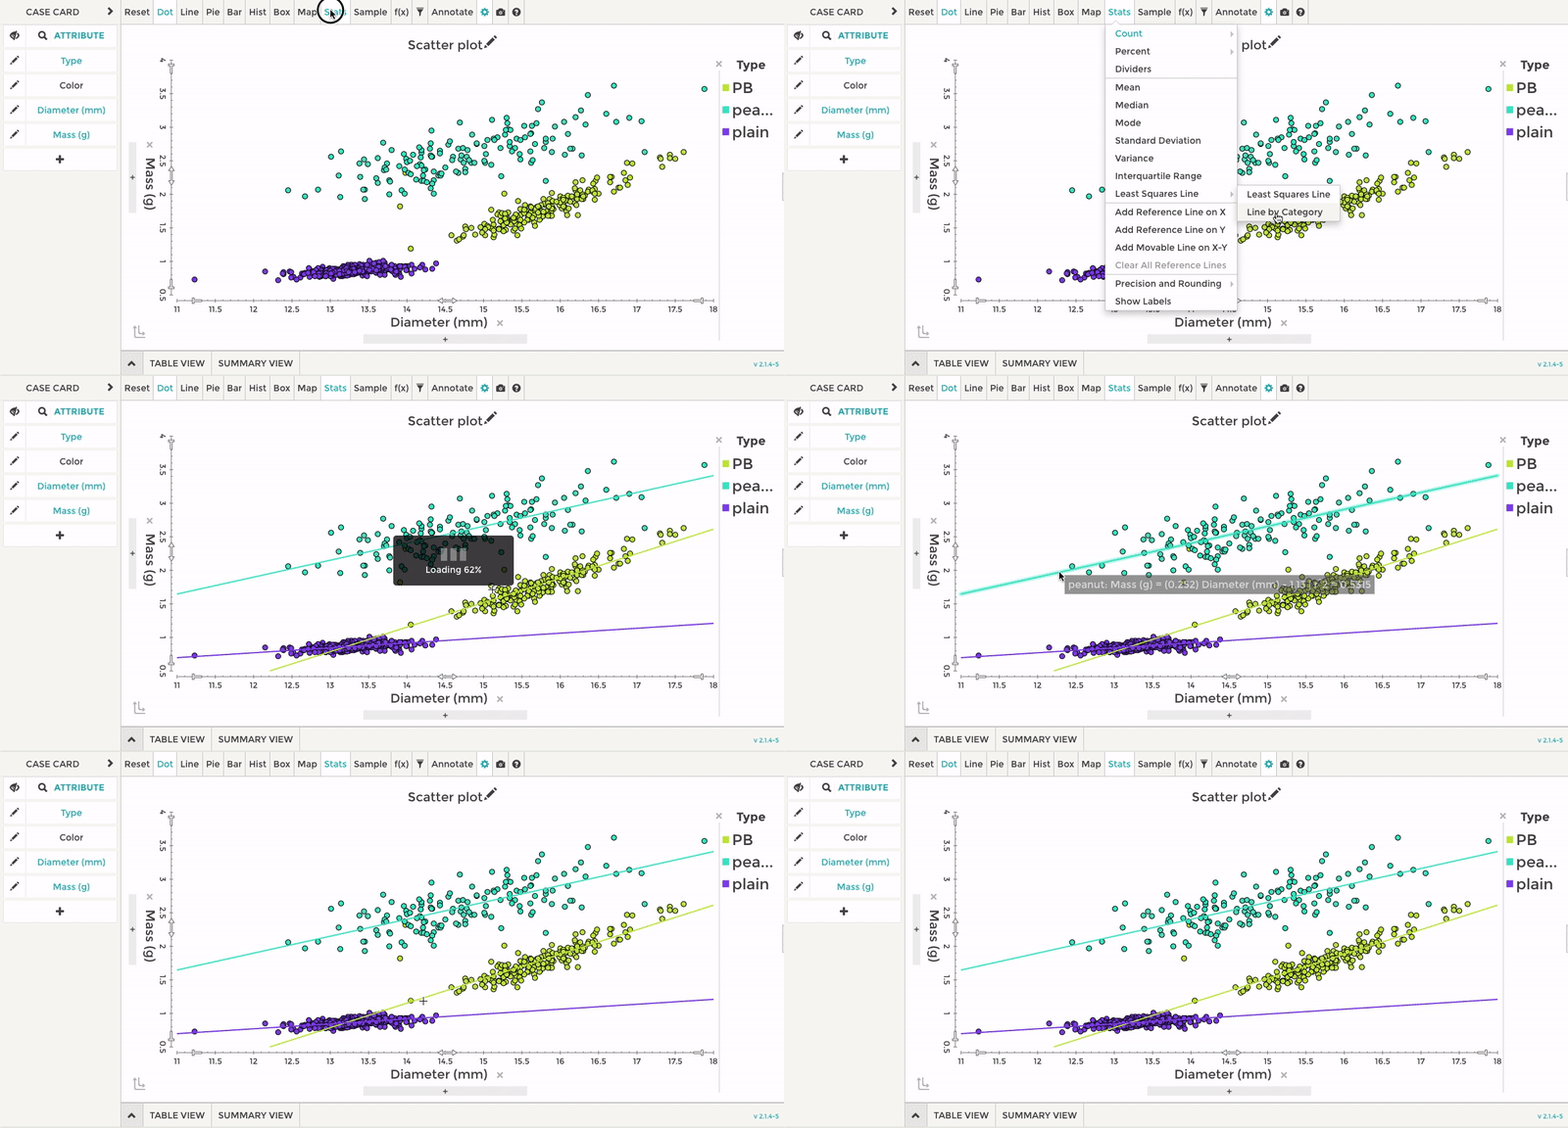
The least squares line when applied to data with
multiple categories will now show distinct
colors matching each category.
-
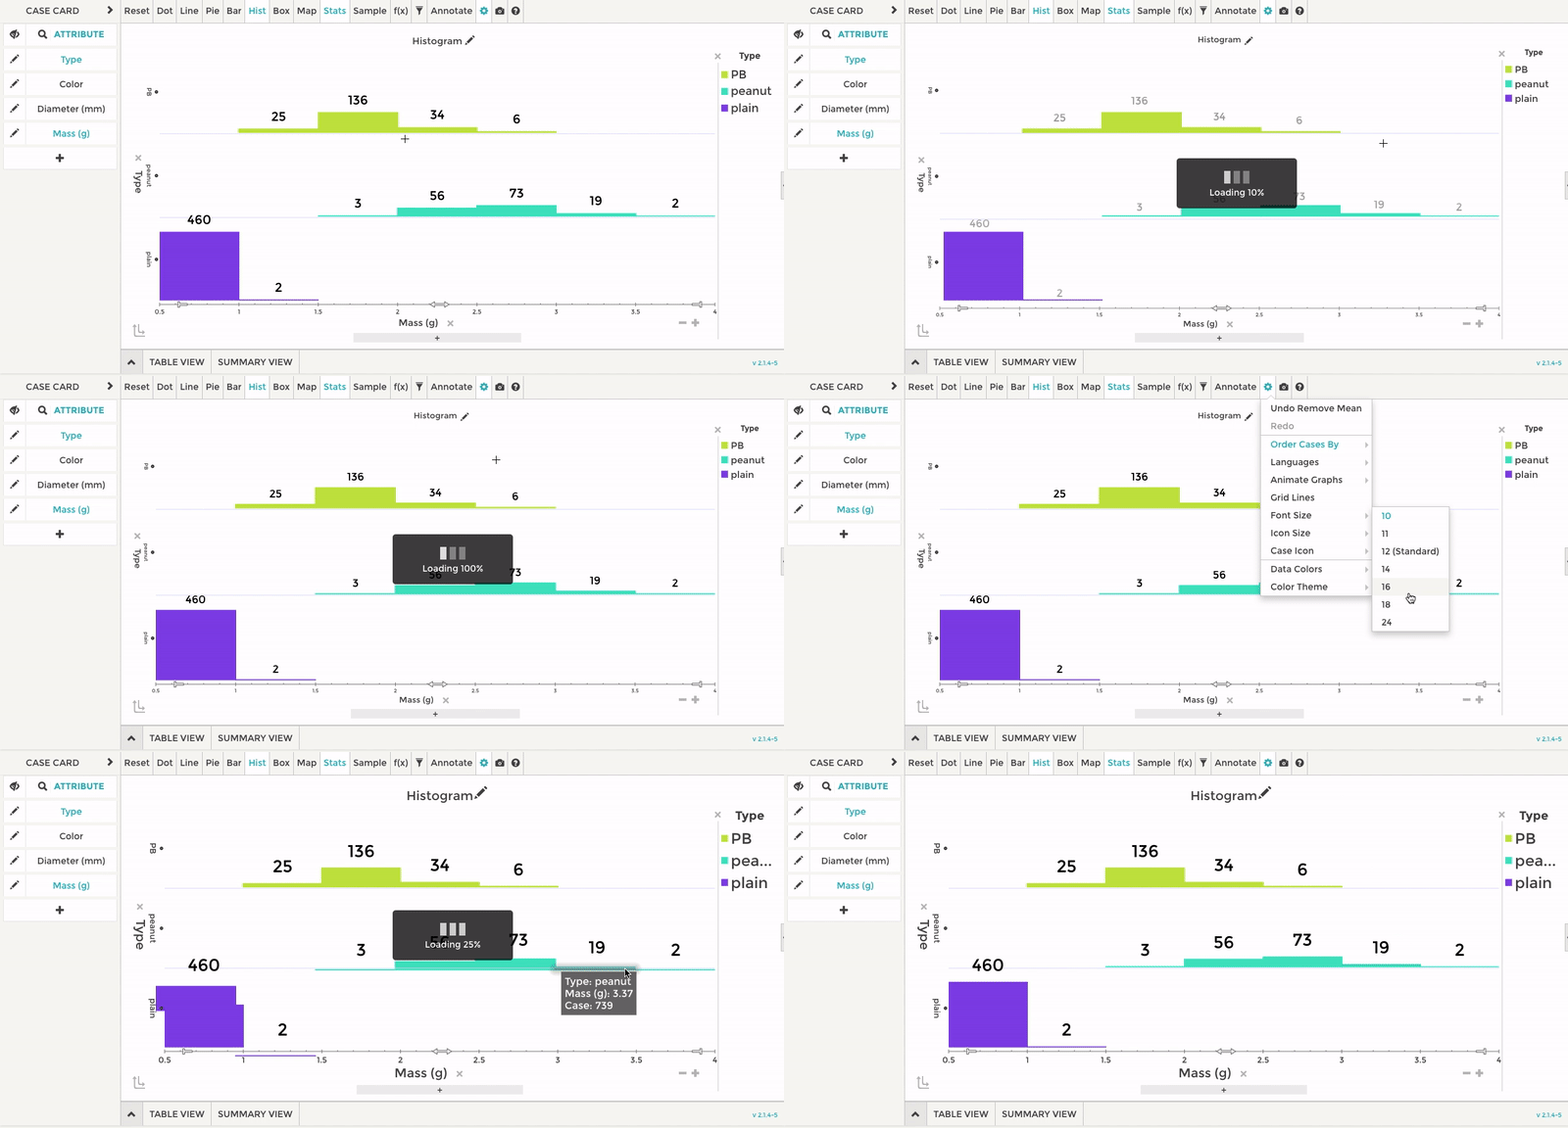
We're now giving users the ability to increase
or decrease the font sizes for all text
appearing in the plotting area.
- We've added keyboard support for annotations.
-
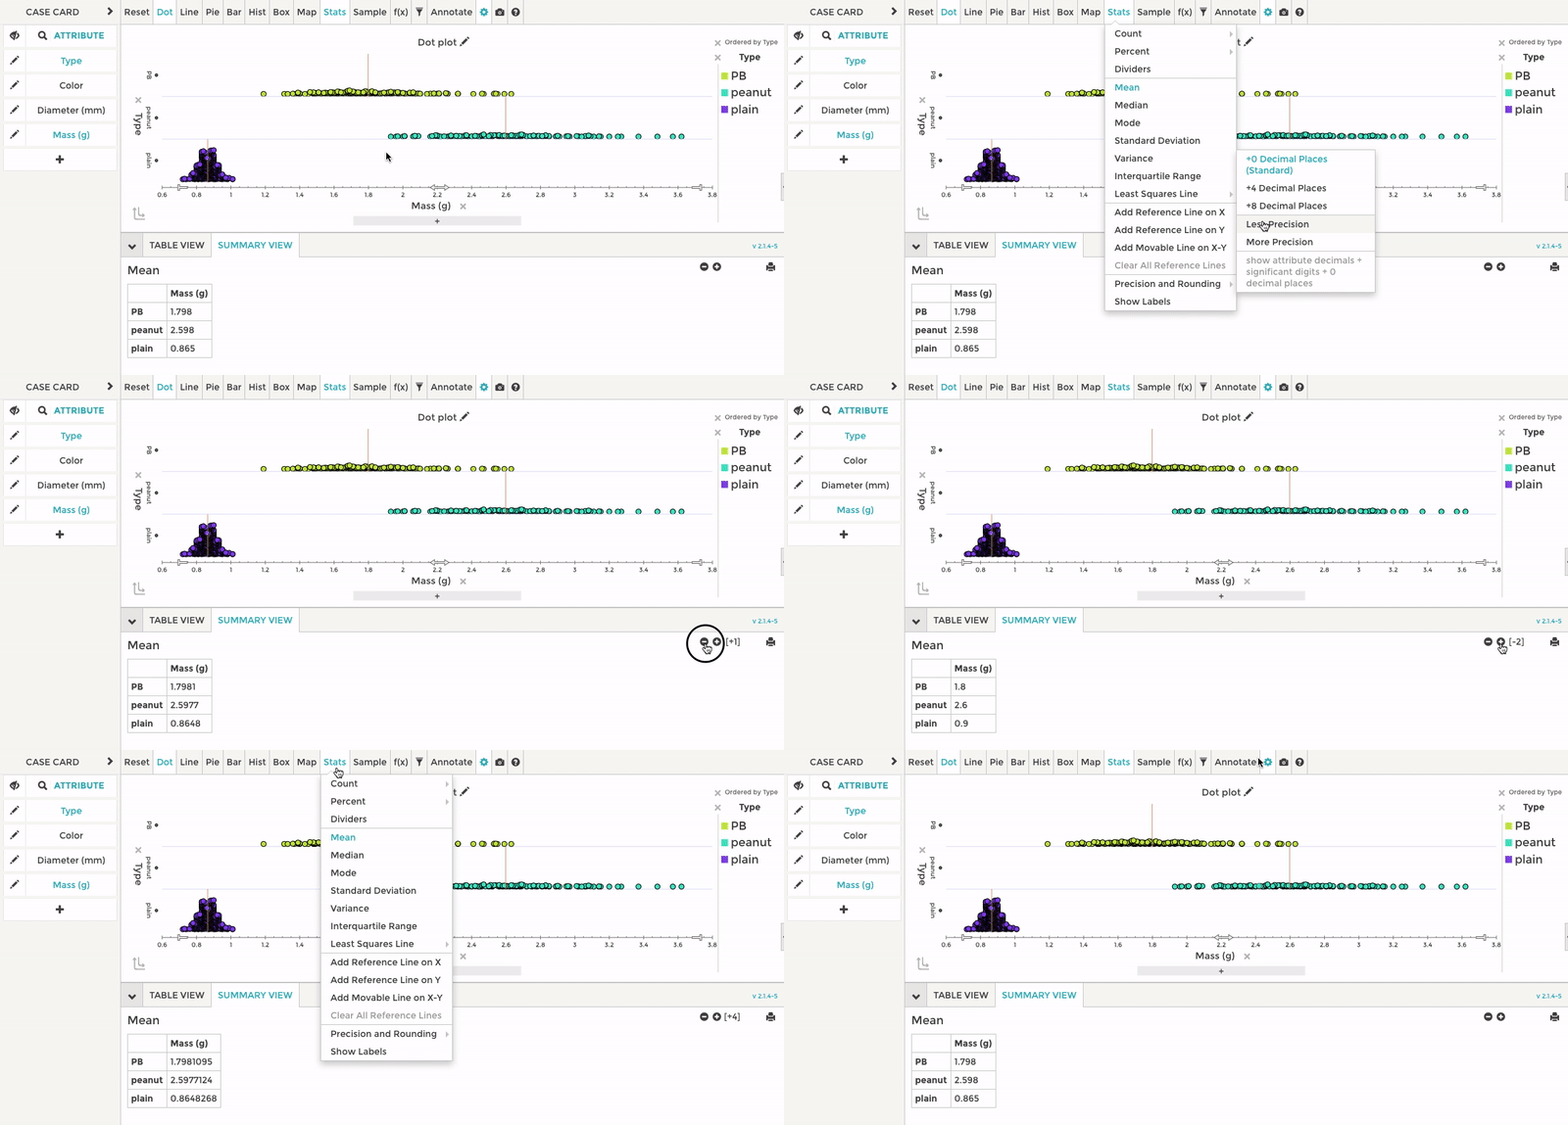
We've added a way to control the precision shown for
the statistical measures. This will allow you to
increase or decrease the number of decimal places
shown in all calculated statistics. There are two
ways to control the precision of the statistical
measures, either from the Stats menu or from the
Summary View.
- We've added the ability to display custom case shapes. This means the traditional circular cases in the plotting area can be replaced with unique and interesting shapes. For example, a dataset about animal running speeds can have an icon that looks like a running horse, or a dataset about rockets have the data points look like rockets. The goal with this new feature is to help elementary school students realize that each case represents microdata.
- We've added a feature to allow users to control the size of the data points, so datasets with relatively few data can have larger case sizes.