Tuva Tools v2.11.0
Released 10/18/2021
For this release, we have focused on making the histogram feature more diverse and exciting. The big changes are the addition of different types of histograms and borders for individual histogram bins. Additionally, we have added a color picker for the Least Squares Line which allows you to choose the color of the line.
Changed:
-
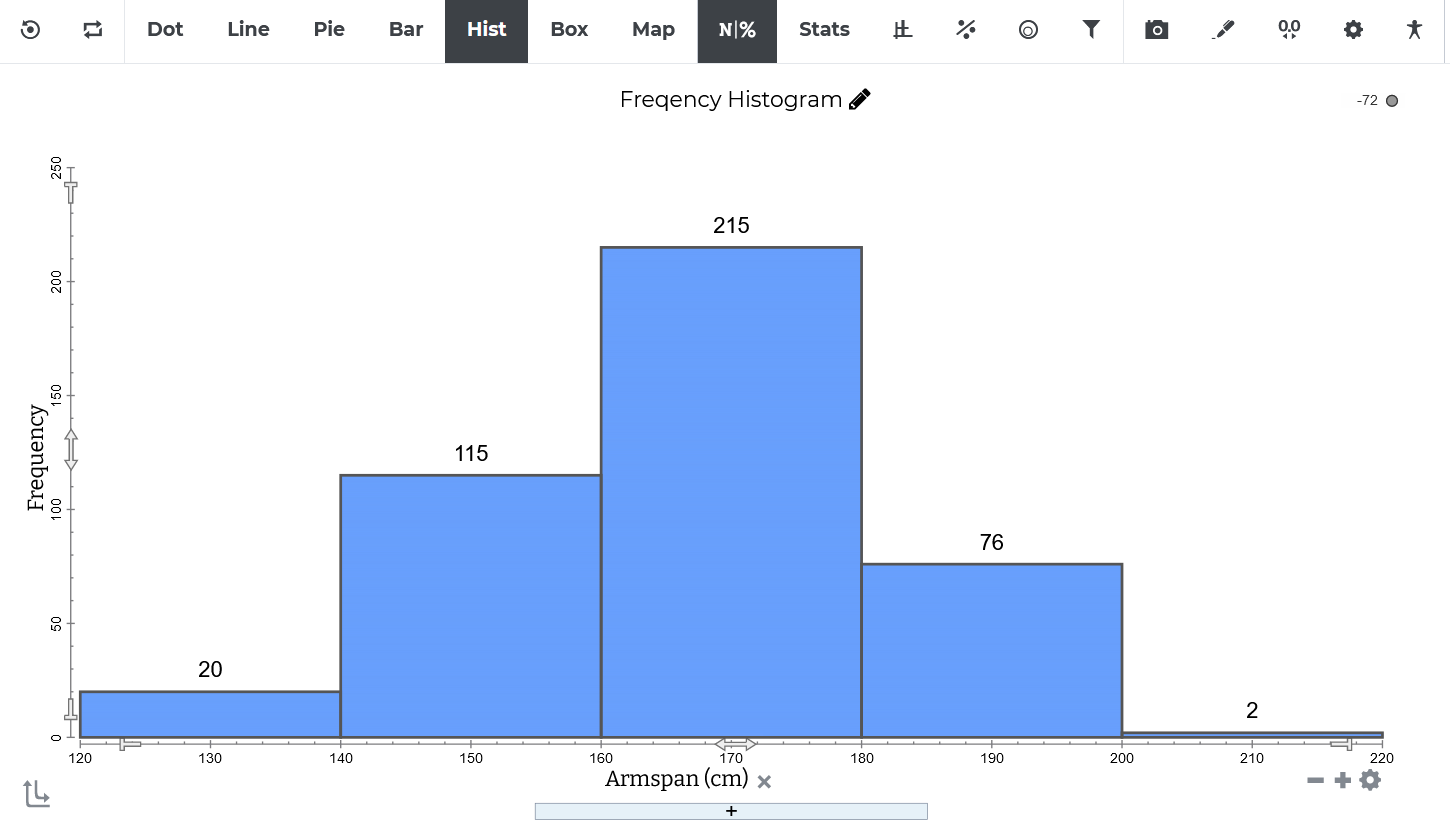
Histogram Bin Outlines: We have added a border to the histogram bars to
help you distinguish the bins clearly.
-
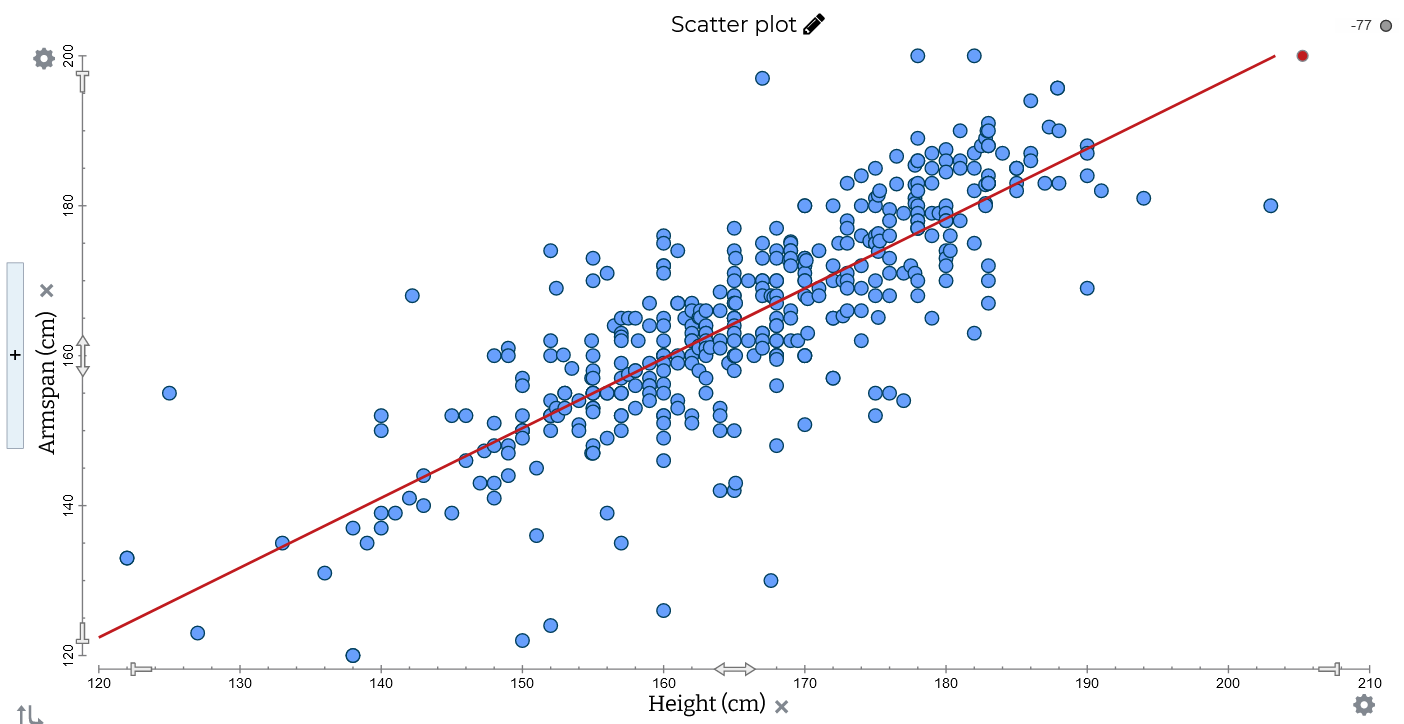
LSRL Color Picker: When you create a scatterplot and use the LSRL to model
a relationship between the two variables, you can choose the color of the LSRL from a color
picker.
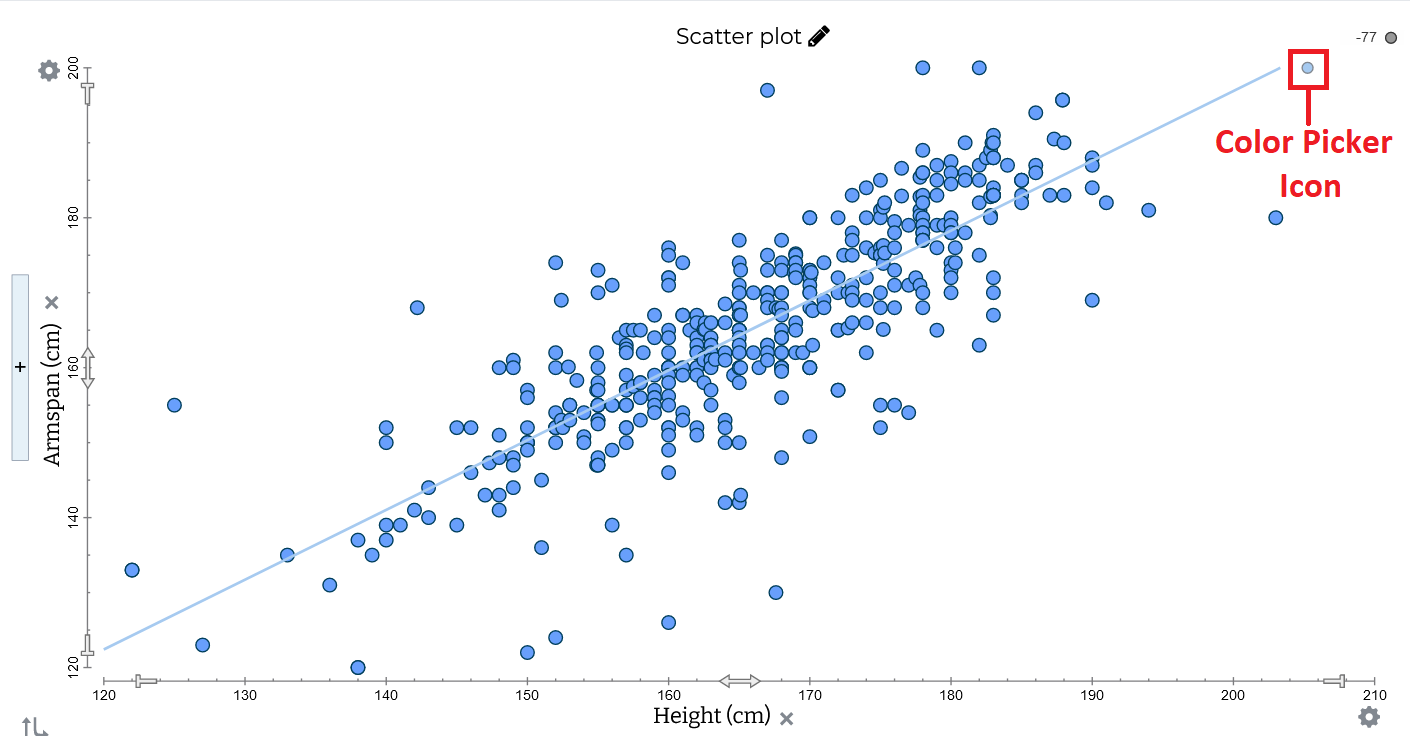
Clicking on the color picker icon opens a palette of colors to choose from.
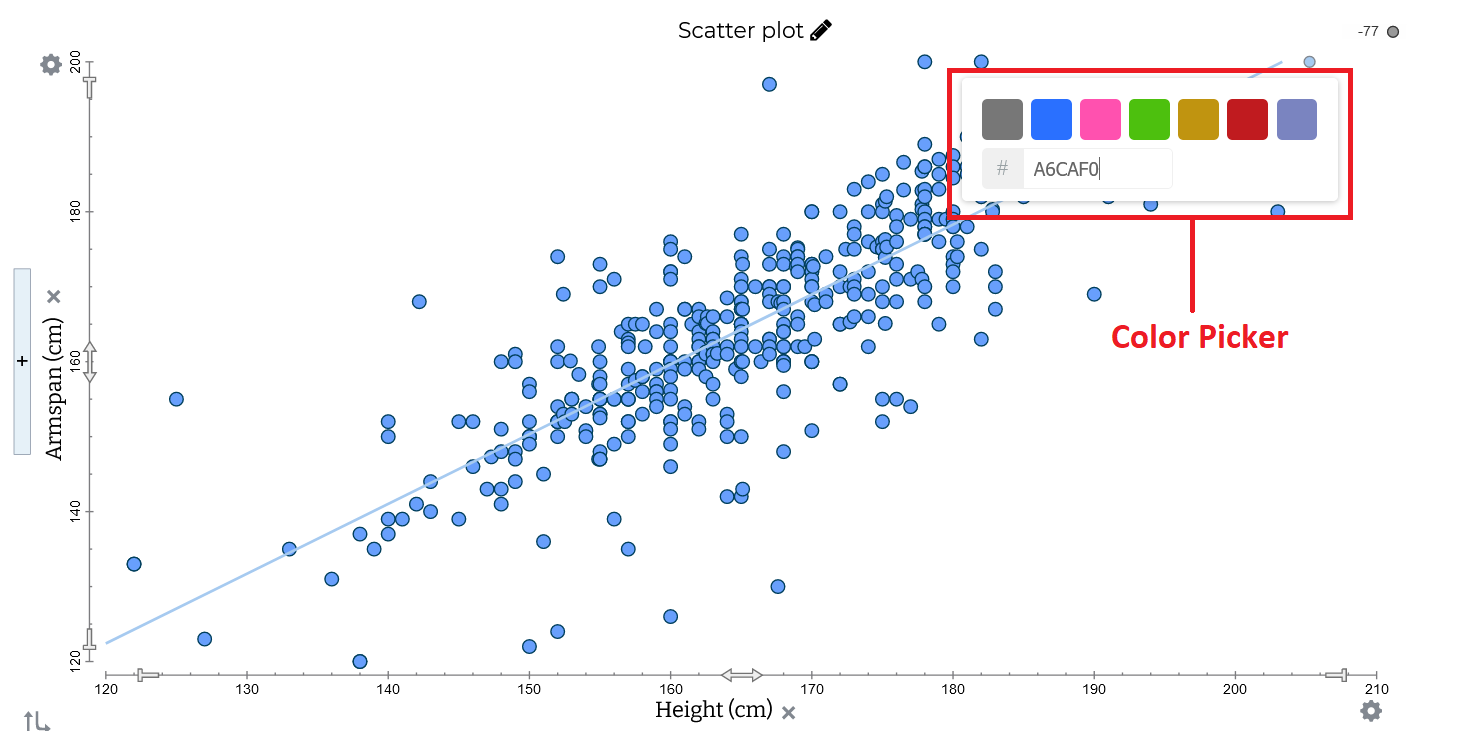
Once you select the desired color, the color of your LSRL will change accordingly.
Added:
-
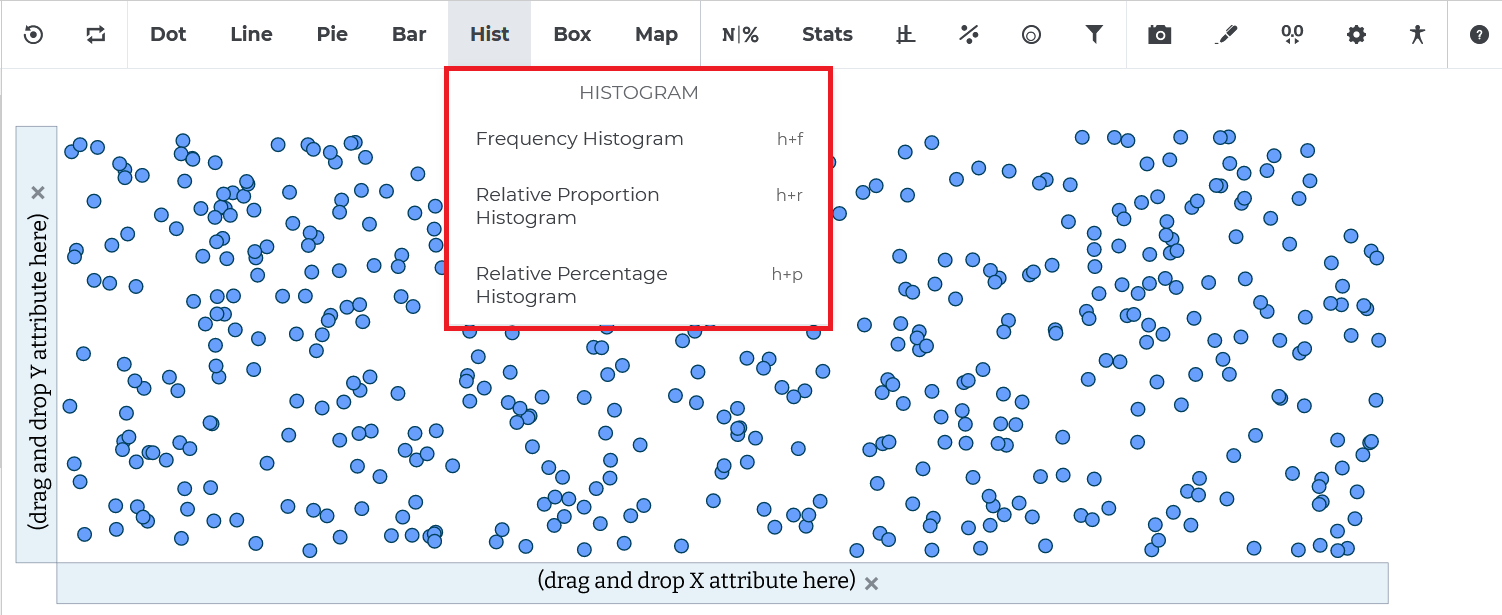
Types of Histograms: You can now choose to visualize the distribution of a
numerical attribute using three different types of histograms. You can access these
histograms from the Hist menu on the toolbar.
-
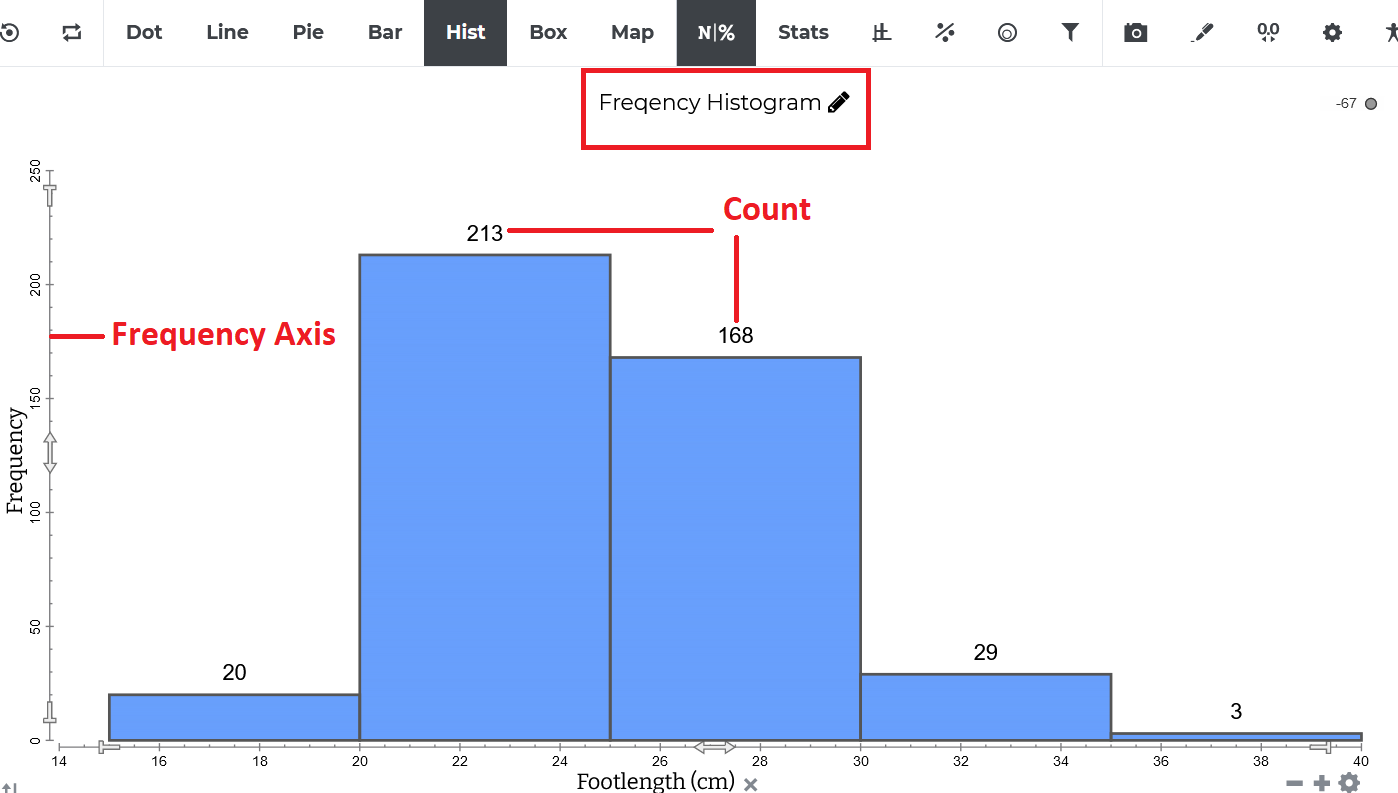
The Frequency Histogram has a frequency axis now and it shows the
number of cases in a bin. You can use the frequency axis to read the number of cases
in each bin or use the counts atop the bars.
-
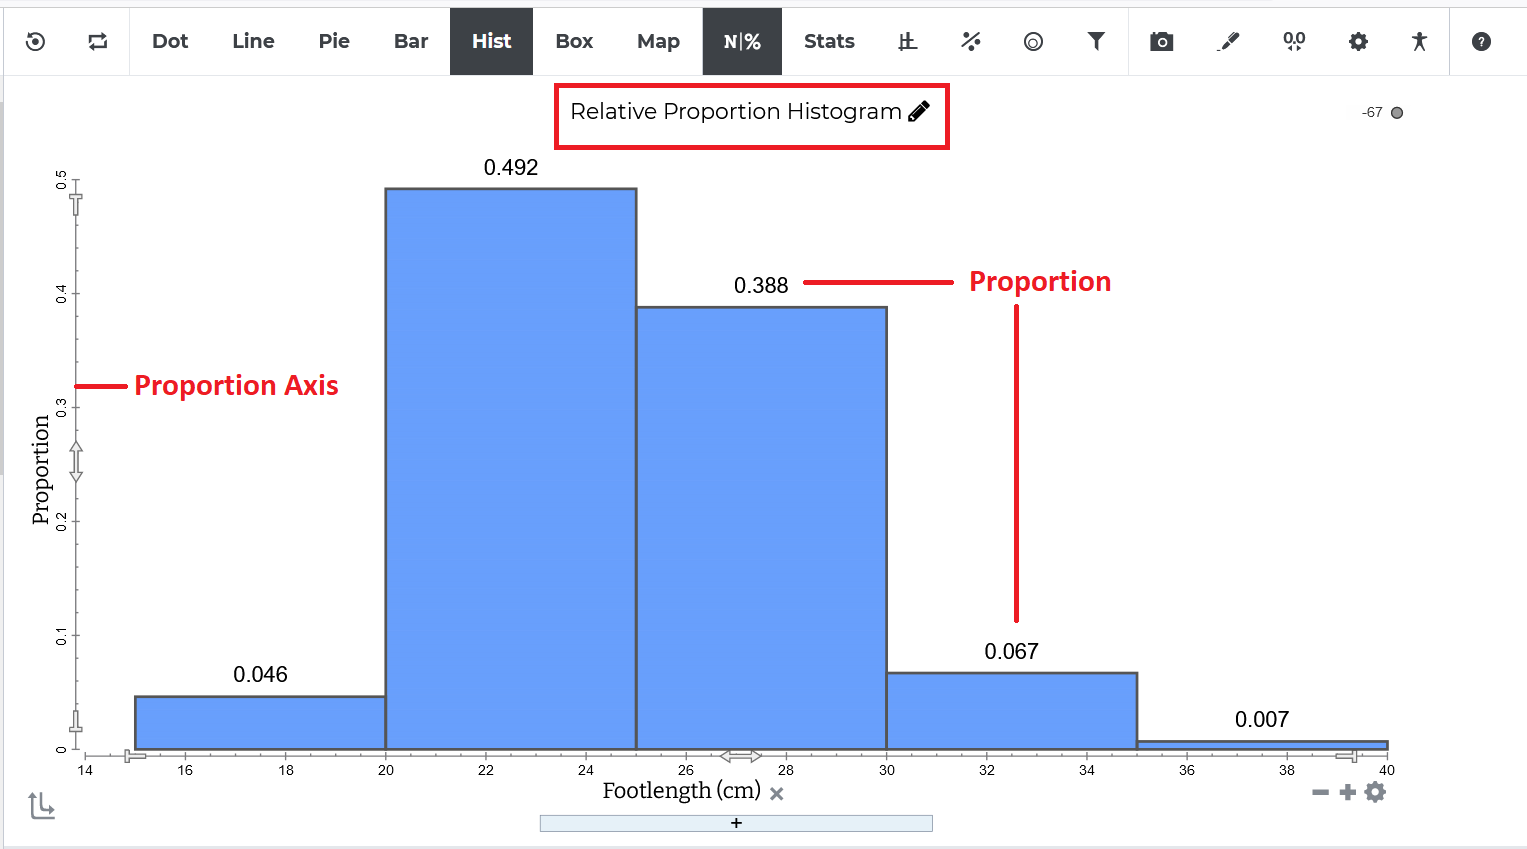
The Relative Proportion Histogram shows the proportion of cases in
a bin as compared to the total number of cases. You can read the proportion of cases
in each bin using the relative proportion axis or the proportion displayed on the
top of each bar.
-
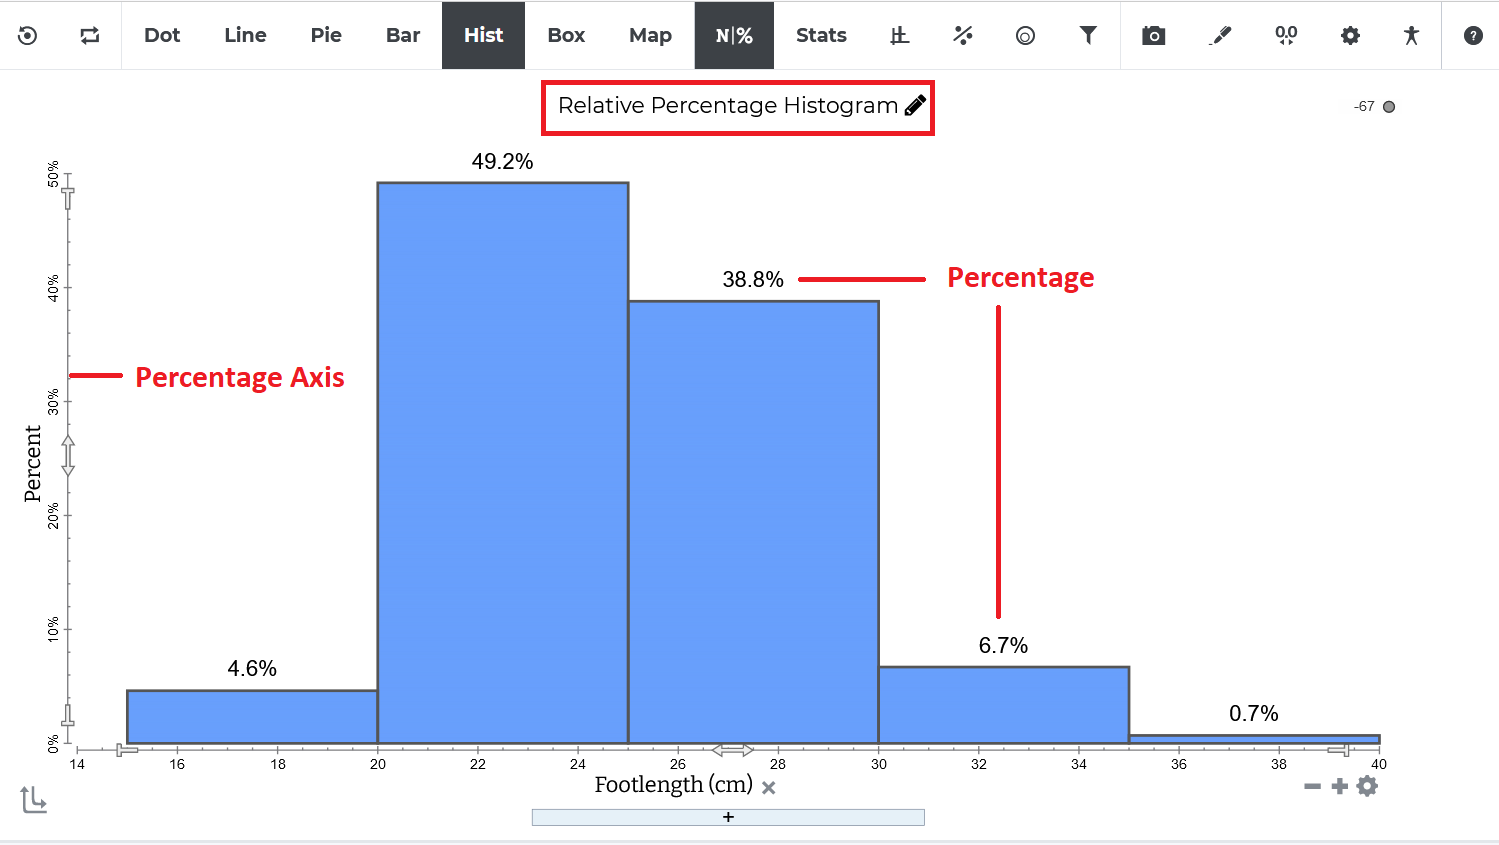
The Relative Percentage Histogram shows the percentage of cases in
a bin as compared to the total number of cases. You can read the percentage of cases
in each bin using the relative percentage axis.
-
The Frequency Histogram has a frequency axis now and it shows the
number of cases in a bin. You can use the frequency axis to read the number of cases
in each bin or use the counts atop the bars.
-
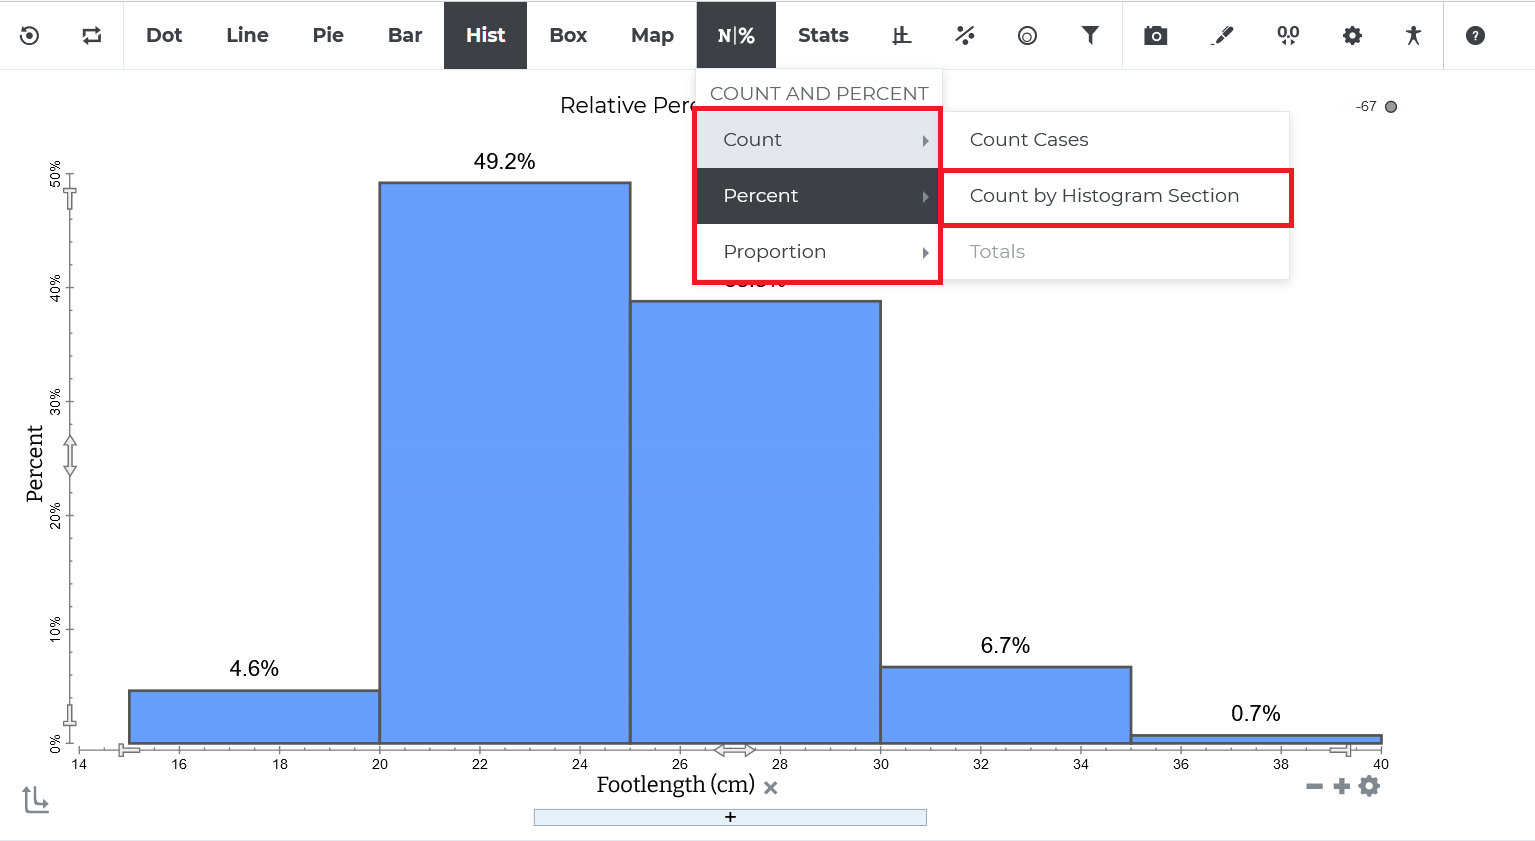
Adding Counts, Percents, and Proportions: What if you wanted to see counts
along with relative percentages and proportions? Well, Tuva allows you to do just that now!
You can use the Count and Percent (NI%) menu in the toolbar to see the relative counts, percentages, as well as proportions.
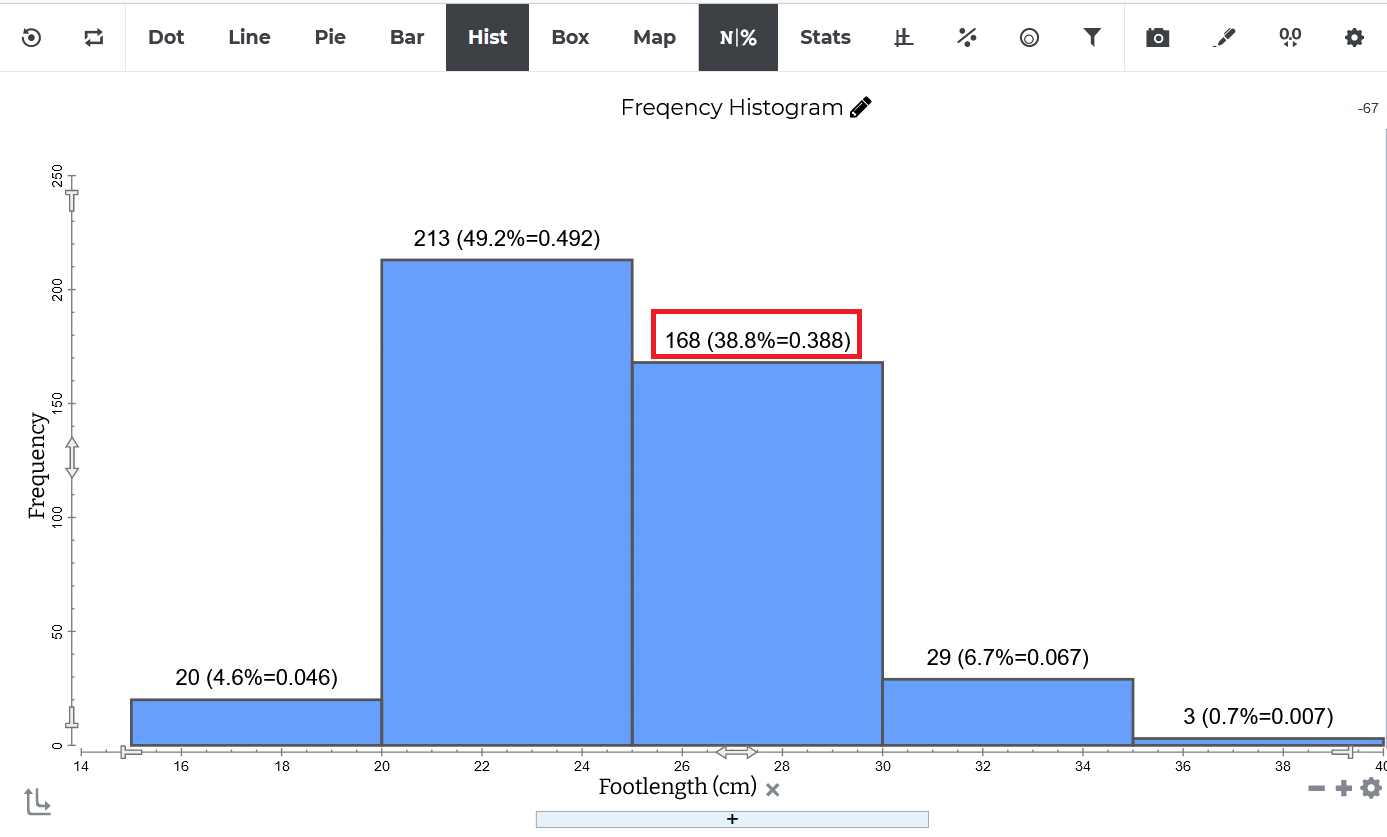
Here's an example of a frequency histogram with both relative proportions and relative percentages enabled.
-
View Only Support for Data Tools Environment: We have provided support for
a ‘View Only Mode' in the Tuva tools environment to provide greater
flexibility to content creators (Tuva and Partners) in designing their content. This mode
disables and hides several components of the tool while still allowing the user to click on
individual cases, sift through the Case Card, and open the Table View. This feature can be
accessed via the authoring environment.
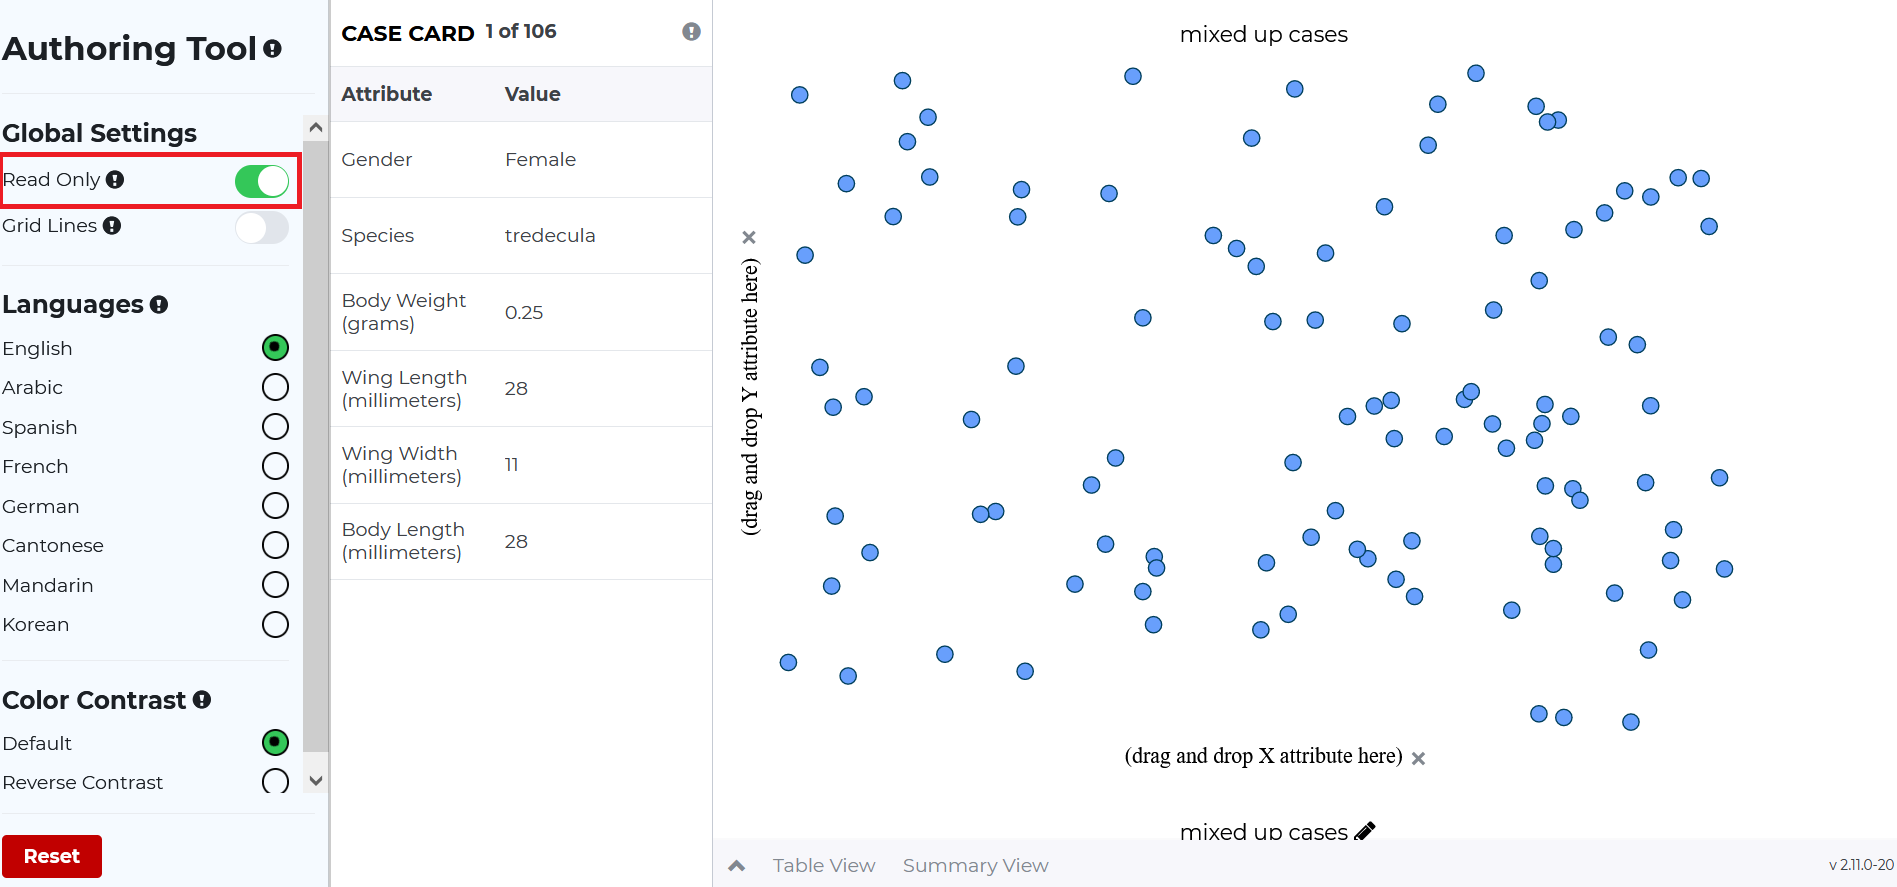
The mode can be enabled using a toggle button in the authoring tool. Once activated, all elements in the environment that could potentially allow the user to change the plot are disabled. -
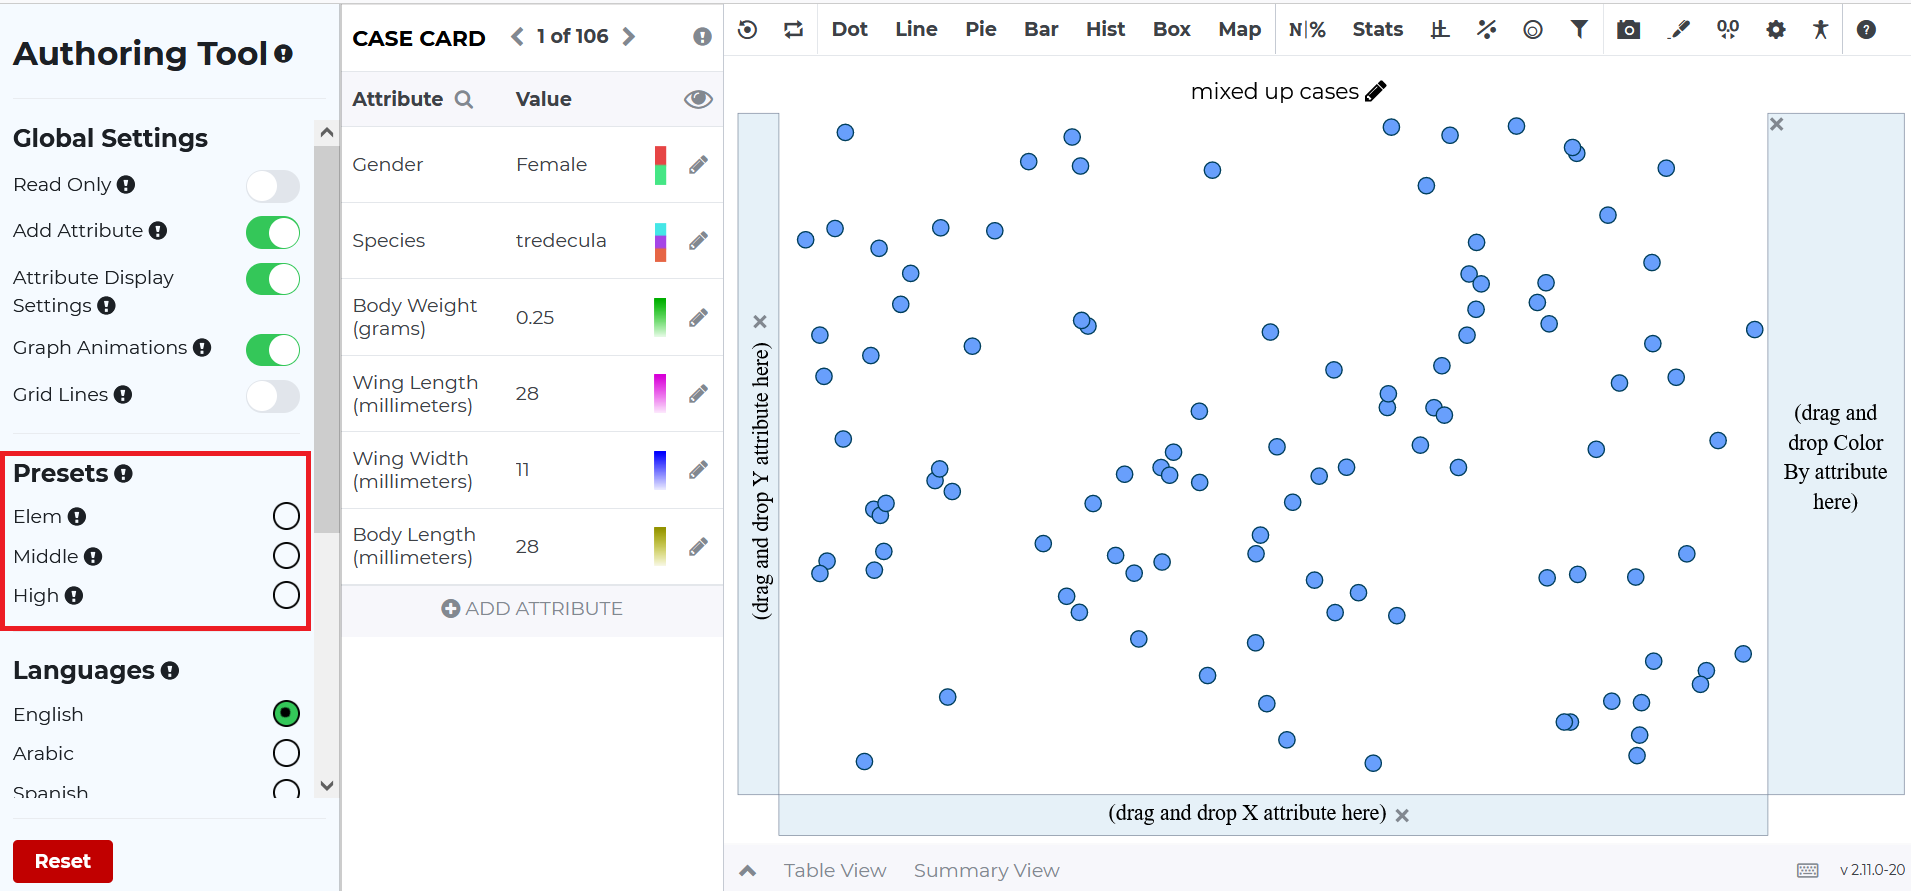
Tuva Tool Presets: We have added another feature to allow content creators
(Tuva and Partners) to adapt the Tuva tools to the needs of their target audience. Creators
can now choose between pre-compiled editions of the tool via the authoring environment.
These editions have been put together keeping in mind the data concepts and graphs relevant
to a given level. To this end, the Tuva Authoring Environment offers three presets: Elem,
Middle, and High. Each of these presets modifies the toolbar by displaying the menus and
buttons relevant to the different school levels.
-
Elem: The Elem edition is activated using a toggle button under
Preset. Most toolbar menu items are hidden and this mode is meant
to cater to students in elementary school. The idea is to reduce the complexity of
the graphing environment so that students can focus on concepts essential to their
level.
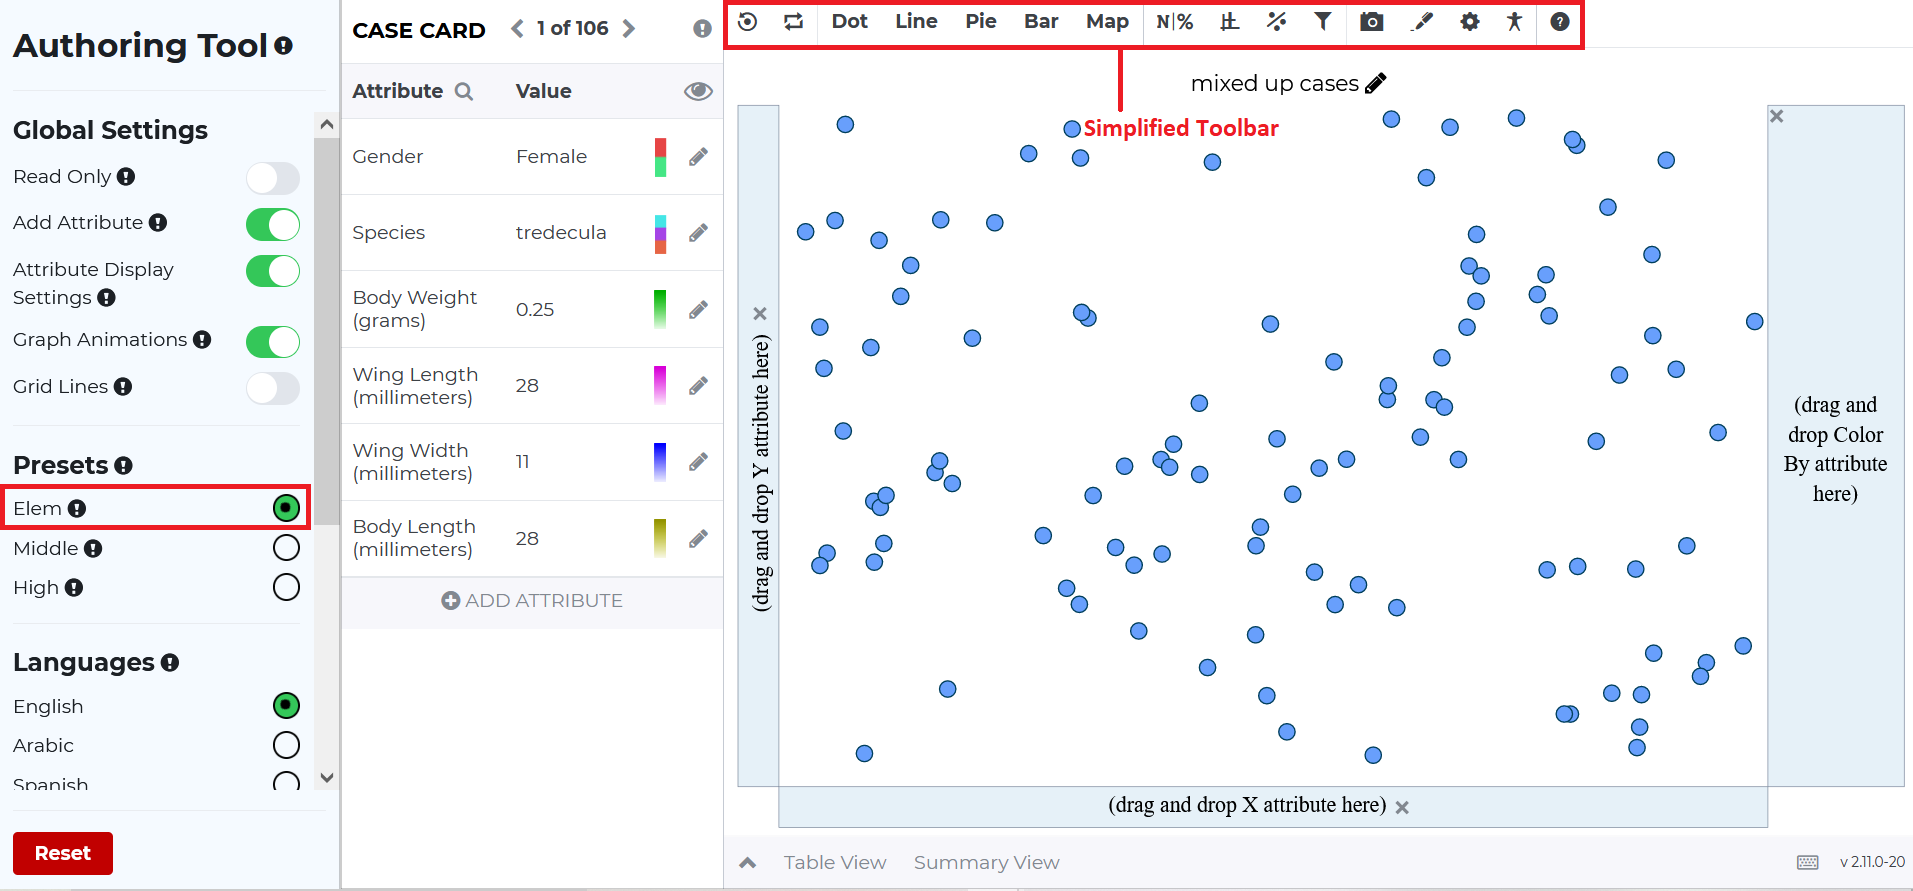
Further, each submenu in the toolbar has fewer options. For example, the Model Data menu only offers the Movable Line. The Least Squares Line and the f(x) functionality have been removed. -
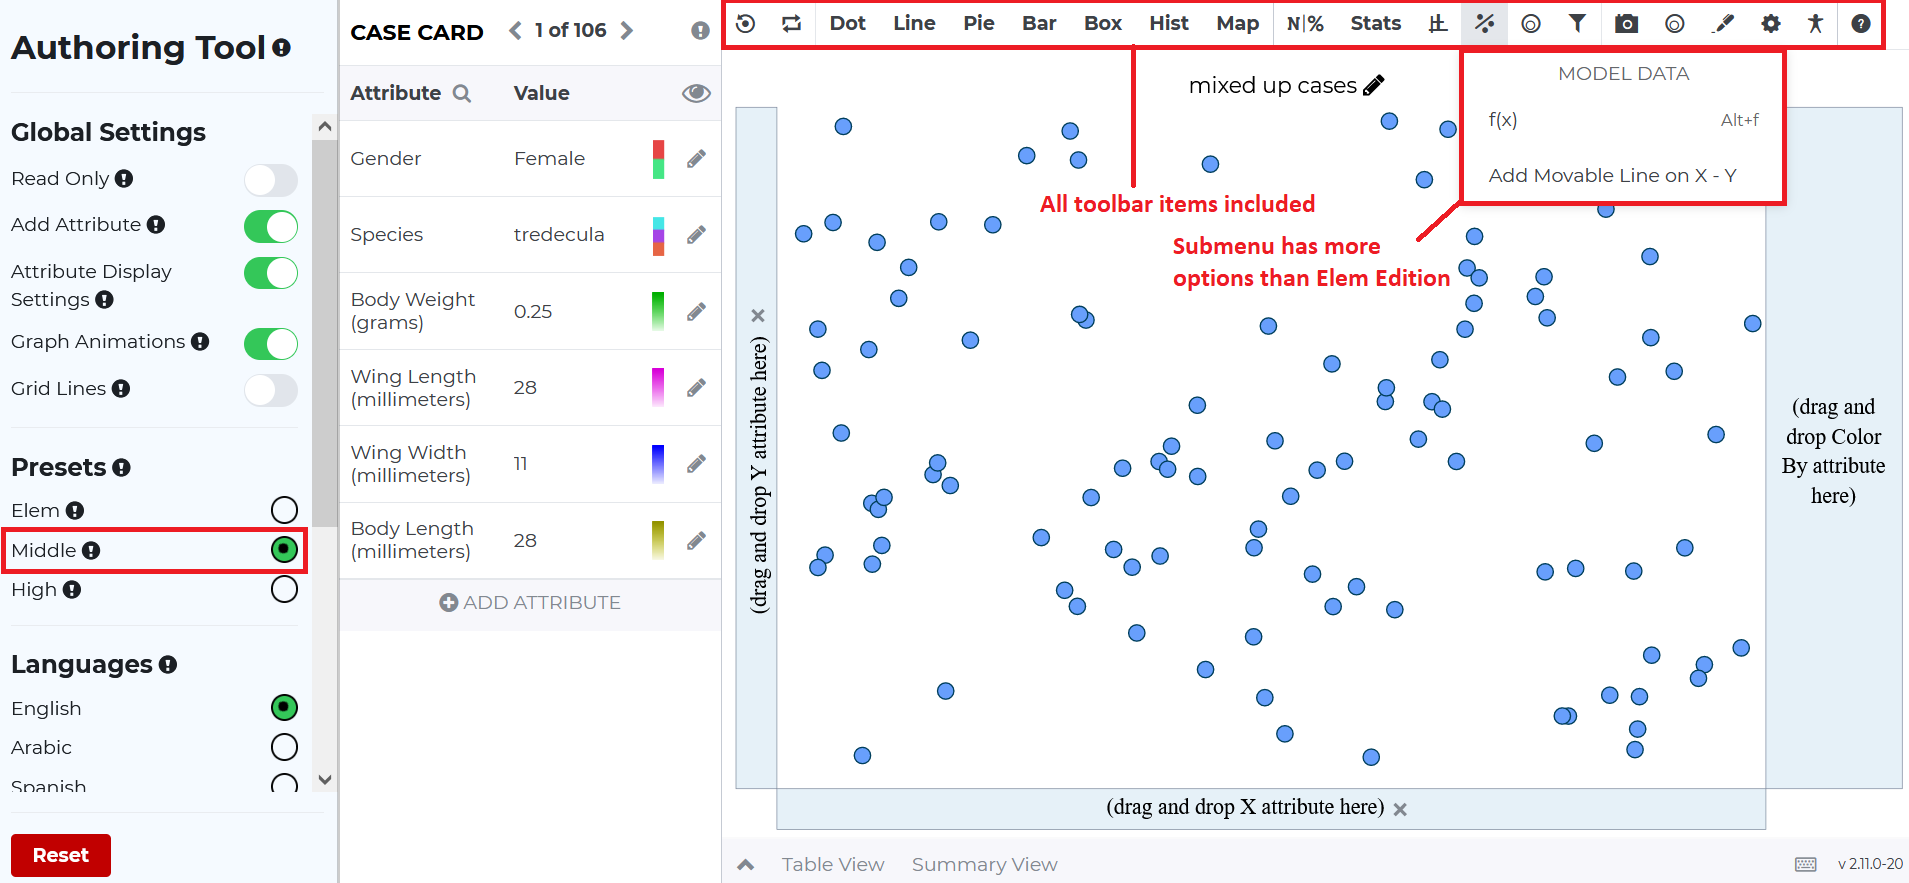
Middle: Most toolbar menu items are available and this mode is
meant to cater to students in middle school. The submenus have more options as
compared to the Elem edition.
-
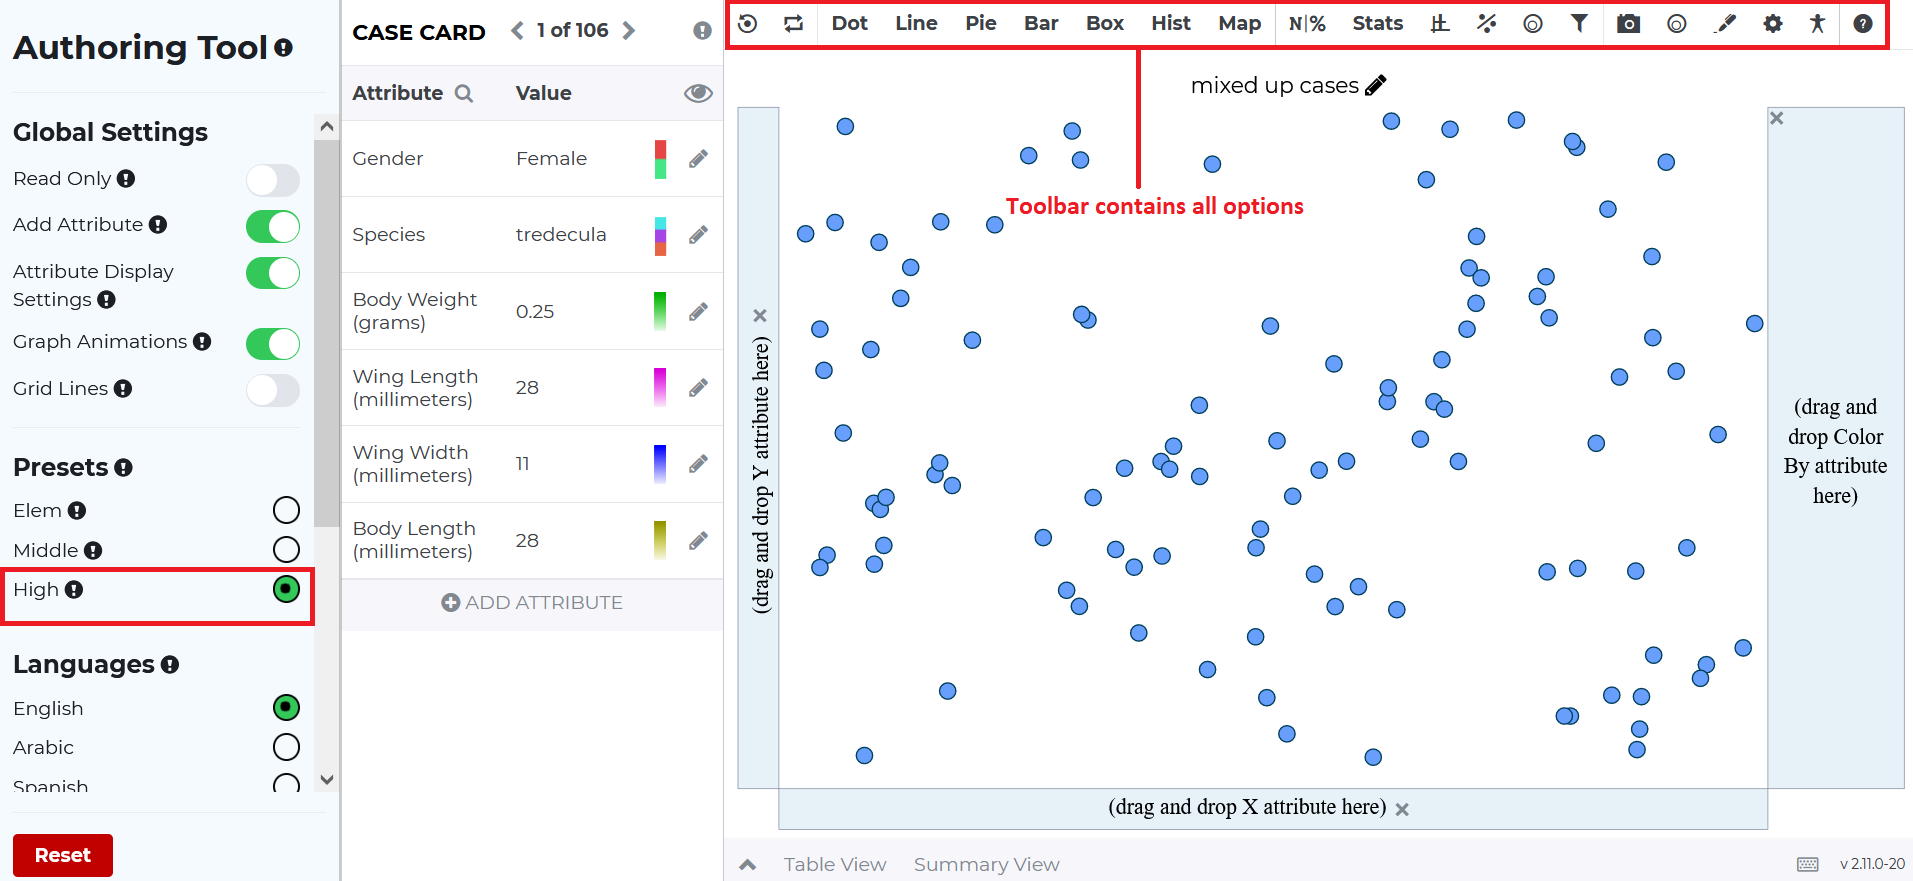
High: The toolbar menu shows all options and this mode is meant to
cater to students in high school.
-
Elem: The Elem edition is activated using a toggle button under
Preset. Most toolbar menu items are hidden and this mode is meant
to cater to students in elementary school. The idea is to reduce the complexity of
the graphing environment so that students can focus on concepts essential to their
level.
Bug Fixes:
-
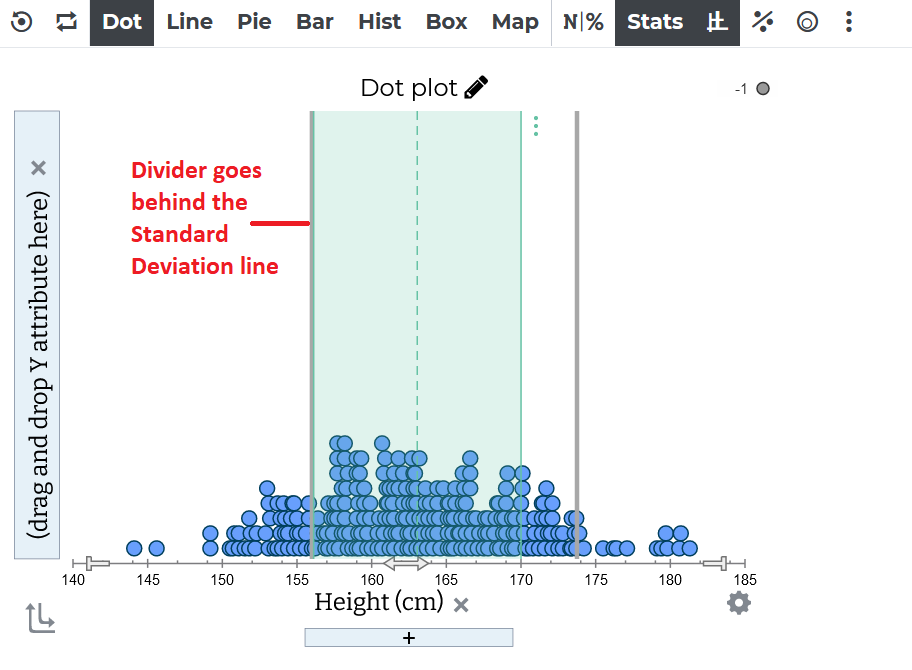
Dividers: We fixed an issue with the dividers where if it was placed over a
stats line such as the mean or the median, you were not able to drag the divider any more.