Tuva Tools v2.9.0
Released 1/25/2021
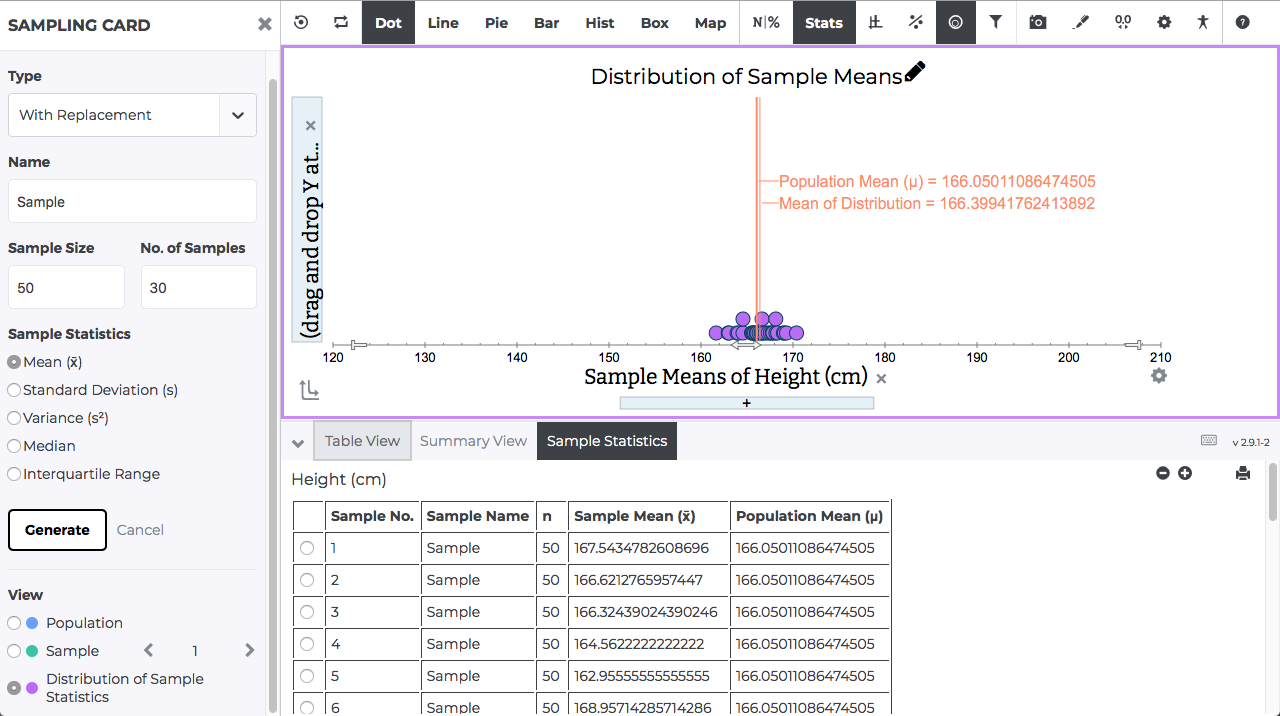
Our main focus with 2.9.0 has been to improve the sampling feature to allow teachers and students to generate a distribution of samples. When someone uses the distribution of samples feature, they will be able to estimate a population's statistical measures (i.e. mean, median, standard deviation, variance, etc.). Continue reading to see a detailed account of the different changes, new additions, and bug fixes.
Changed:
-
Sampling Card: The sampling card
has been changed in a few ways. Let's take a look at
the screenshots below and walk through the changes.
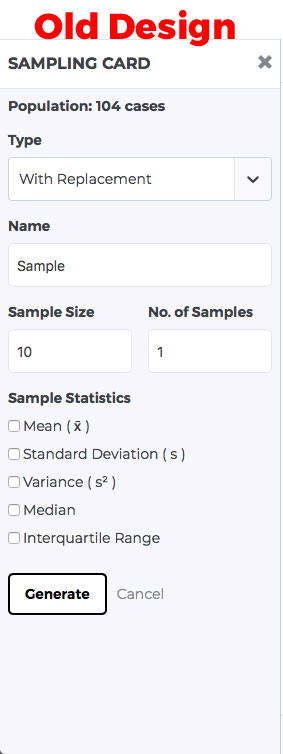
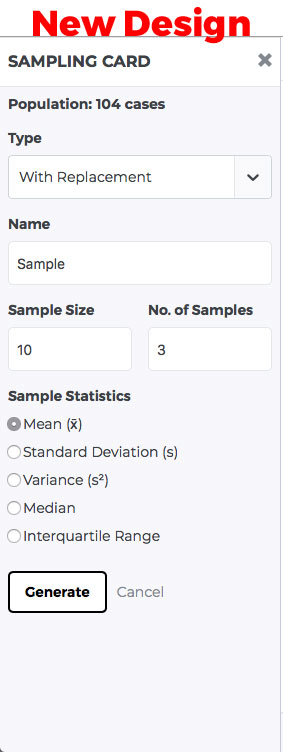
Let's compare the old and the new design. Starting from the top going down, the following changes have been made: - The default Number of Samples has been changed from 1 to 3.
- The Sample Statistics have been changed from checkboxes to radio buttons. While this change does restrict the statistical measures someone may view at a single time, we did this to keep the overall user experience manageable when viewing the distribution of sample statistics.
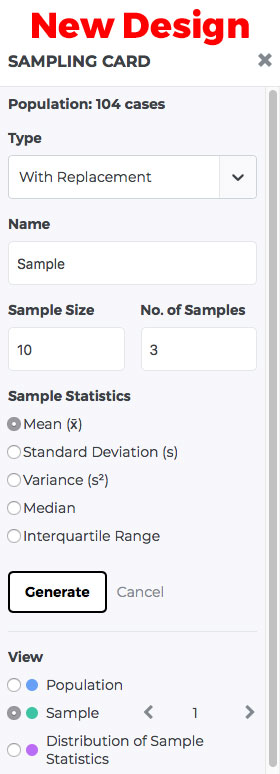
- After the sample has been generated, a new set of radio buttons will appear near the bottom of the Sample Card. These radio buttons will allow the user to quickly switch between the population, individual samples, and the distribution of sample statistics.
- Maximum Number of Samples: We've set an upper limit to the maximum number of samples that can be generated. This upper limit has been set to ensure the Data Tools do not slow down from too many samples being generated and visualized when the user selects the distribution of samples.
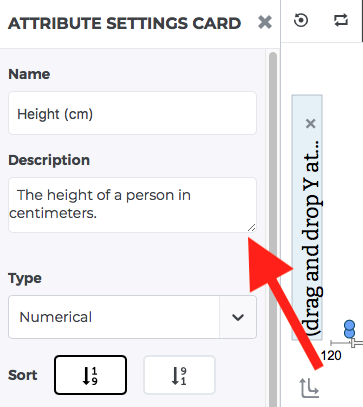
- Attribute Description: The attribute description now goes into multiple lines to accommodate longer descriptive sentences. Previously, this field would only show one line of text, making it difficult to read an attribute description. See screenshot below.
- Add New Attribute Moved from Metadata to Plotstate: While this change will not affect any frontend experience for users, we have changed how we're saving attributes when users click "Add New Attribute" from the bottom of the Case Card. Previously, it was saving the new attribute to a place called the dataset metadata. When the metadata was updated with a new attribute, any plots that were saved from the original dataset would be altered due to their reliance on the metadata. Since this change moves the new attribute form the metadata to the plotstate, users can now add new attributes to a dataset so the new attribute remains contained within that specific instance. It won't affect any plots that were saved from the original dataset.
- Least Square Regression Line: We've changed the label that shows when hovering over the Least Square Regression Line to show r instead of r^2. The r^2 value is still available for viewing in the summary view.
Added:
- Distribution of Sample Statistics: A new sampling feature that's been added is the ability to visualize all generated samples as cases in a plot. This will allow users to more learn how sampling can be used to estimate a population's statistics by measuring the statistics of the distribution of samples. In the screenshot below you will see an example distribution of samples.
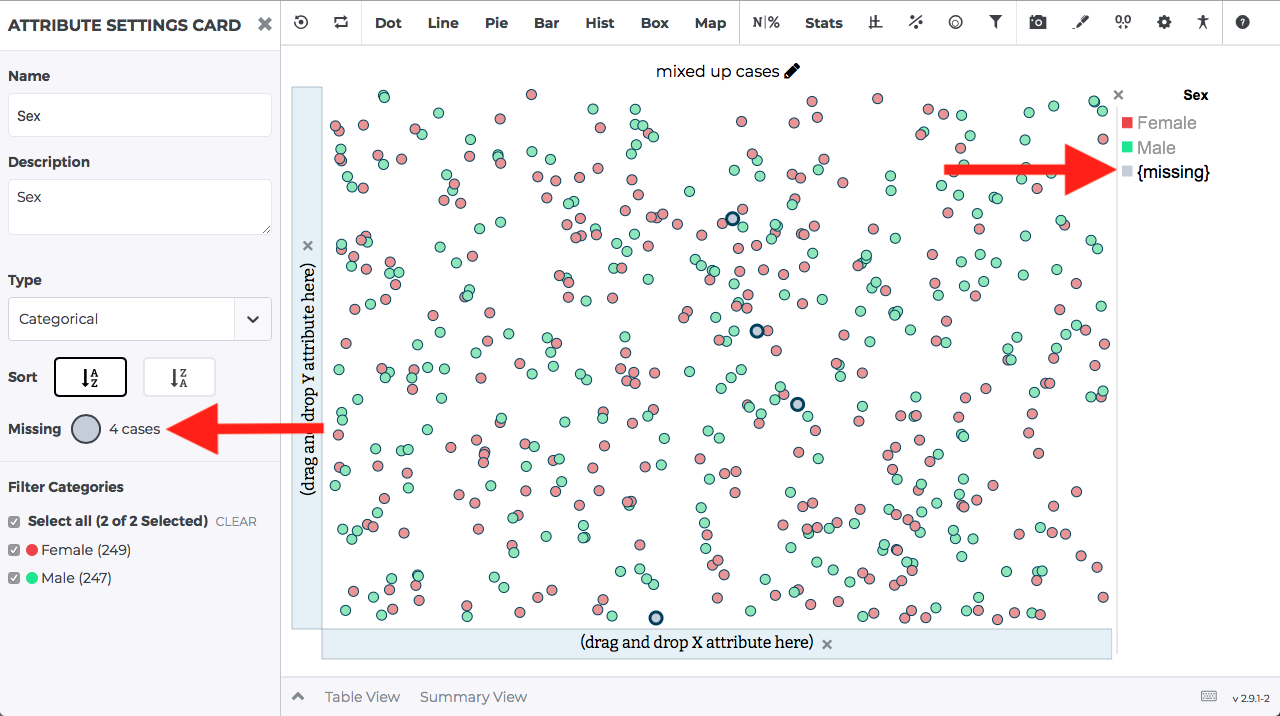
- Selecting Missing Values: Users are now able to select the missing cases from the legend and from the attribute settings card. This will allow users to filter out missing cases, if they please. See the screenshot below for the exact locations.
- Line Annotation: Users may now draw straight lines from by selecting "Line" from the annotation menu.
- Plot Title Added to Tab Index: We've added the plot title to the tab index. This will allow users that only use the keyboard to navigate to the plot title, press enter to focus on the title field, and then type in a new plot title.
Bug Fixes:
- Stretched Bar Chart: We fixed an issue with the stretched bar chart not properly displaying numeric attributes on the Y-Axis.
- Modeling Card: We fixed an issue in the modeling card where the model function dropdown was not showing the hover state when the mouse was over a menu item.
- Plot Settings Card: We fixed an issue with the minimum and maximum fields for the X and Y axes. The issue was only allowing a single update to the min and max fields, and then would refuse any further changes. Users had to close the plot settings card and reopen it to make another change. This has been fixed.
- Spanish Text Align Issue: We fixed an issue with a few words in Spanish not having the proper alignment due to their overall length.
- Histogram and Sampling Bug: We fixed an issue where the bin size for the histogram kept decreasing when switching to view a different sample from the Sample Statistics table.