Tuva Tools v2.1.3
Released 11/11/2019
Added:
-
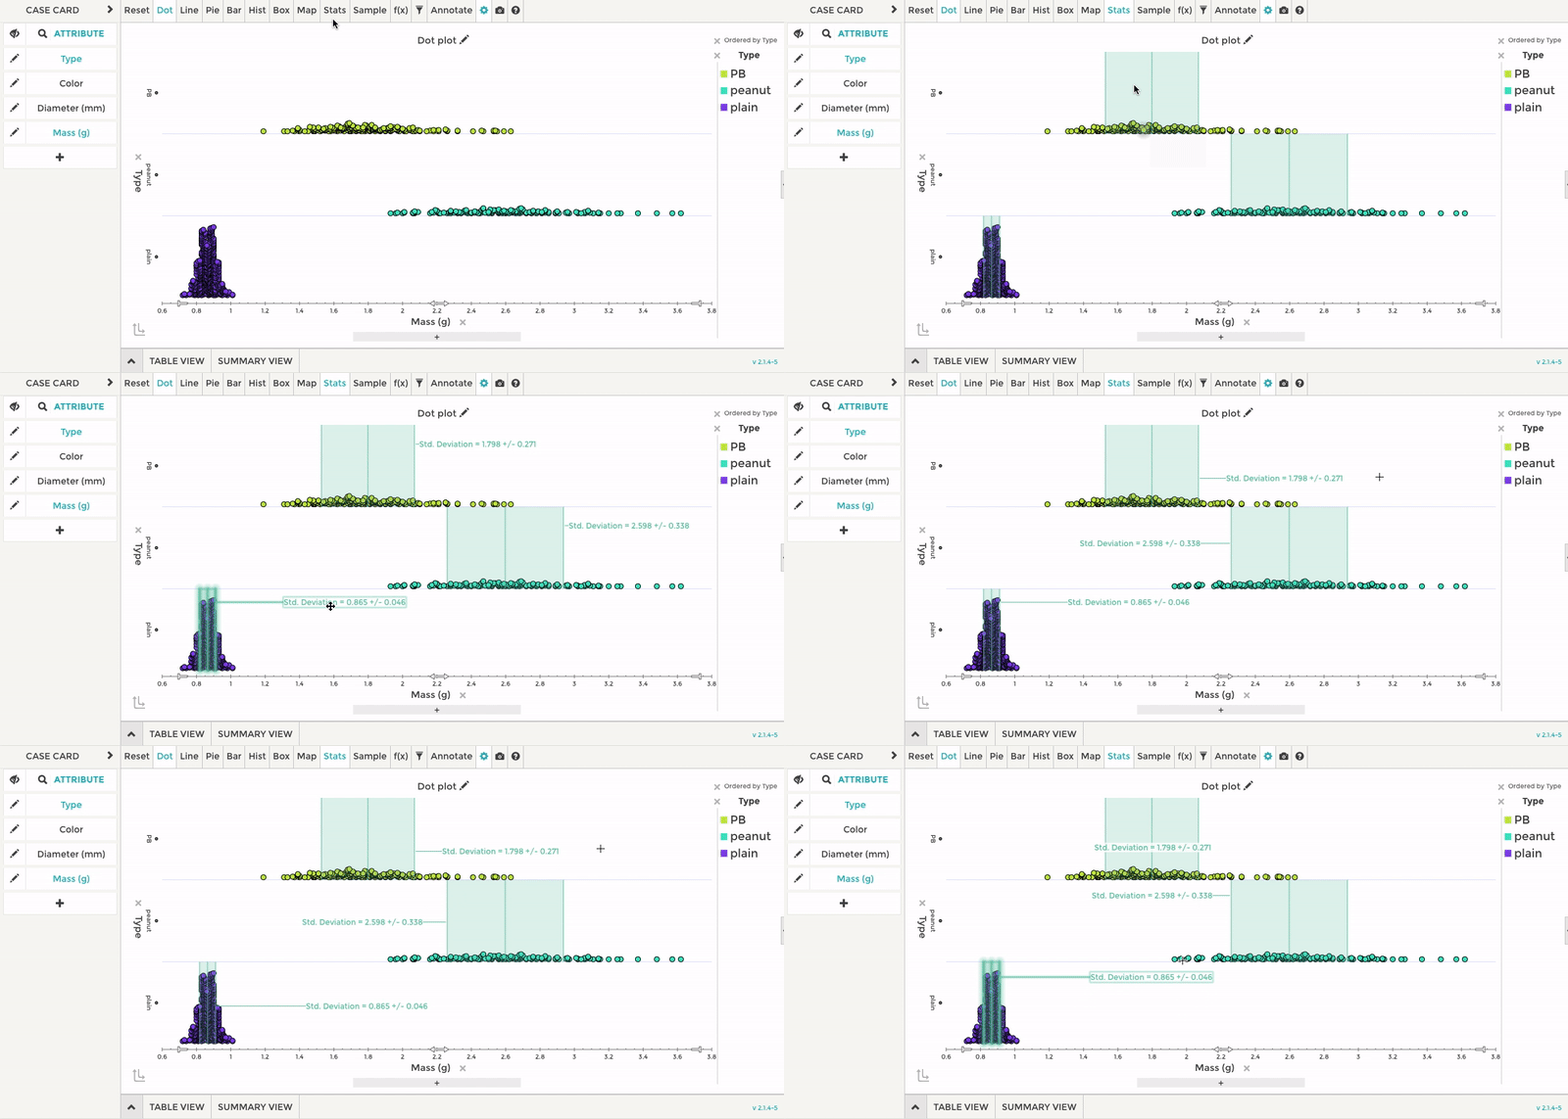
We've added labels to appear alongside the following
statistical measures: mean, median, mode, variance,
standard deviation, interquartile range, least
square regression line, and movable line. These
labels can be enabled or disabled via the stats
menu. This will allow teachers and students to view
the statistical values directly in the plotting area
without having to open the summary view.
These labels are off by default and have to be enabled from the stats menu to show them in the plotting area. The labels are also draggable, so they can be repositioned and organized by the user. They have a background white opacity so the labels will be readable when placed on top of cases. They will also intelligently place themselves to avoid colliding into each other, if the user does not manually place their locations.