Tuva Tools v2.14.0
Released 7/21/2022
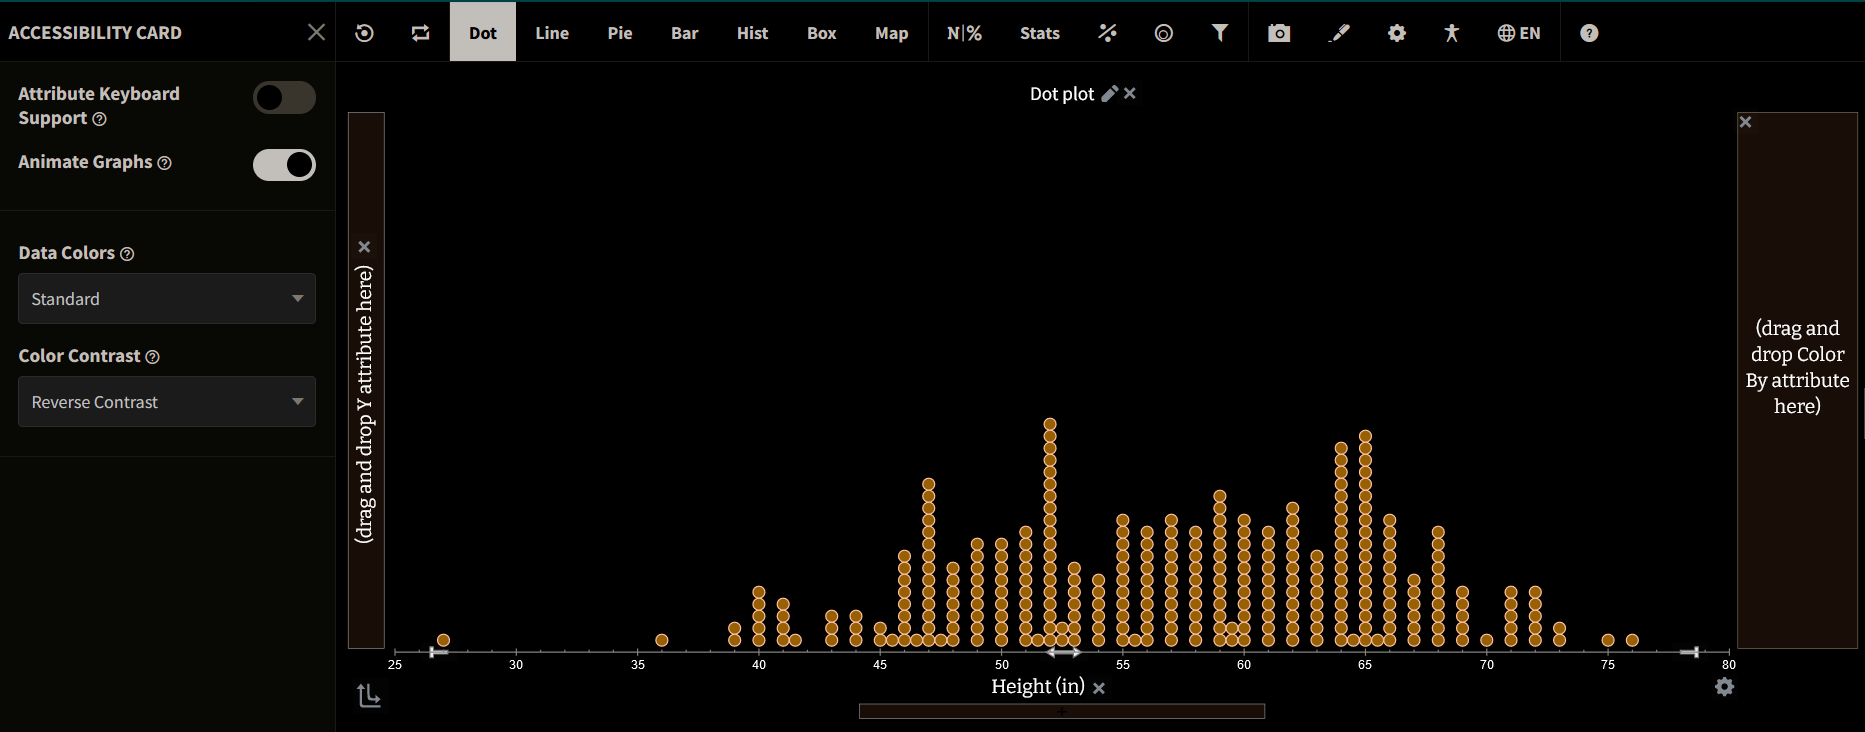
This release focuses on three major items: enhancing reverse contrast to improve accessibility and promote inclusion, providing a context menu for easy discoverability of relevant graphing features and actions for a finer user experience, and supporting recognition of a variety of Month-Year formats to equip the user to source and work with a wider range of time-series data. Apart from these, we have also made several small enhancements and bug fixes.
Added:
-
Context Menu: We have added a context menu that allows you to learn at a
glance the variety of actions you can take with a given graph or an object on the graph
without having to open several toolbar menus or Cards. You can access the menu by clicking
on its icon. Currently, we have enabled it for the following elements:
-
Standard Deviation Display: The context menu icon appears on the
top right of the right fence of the Standard Deviation display.
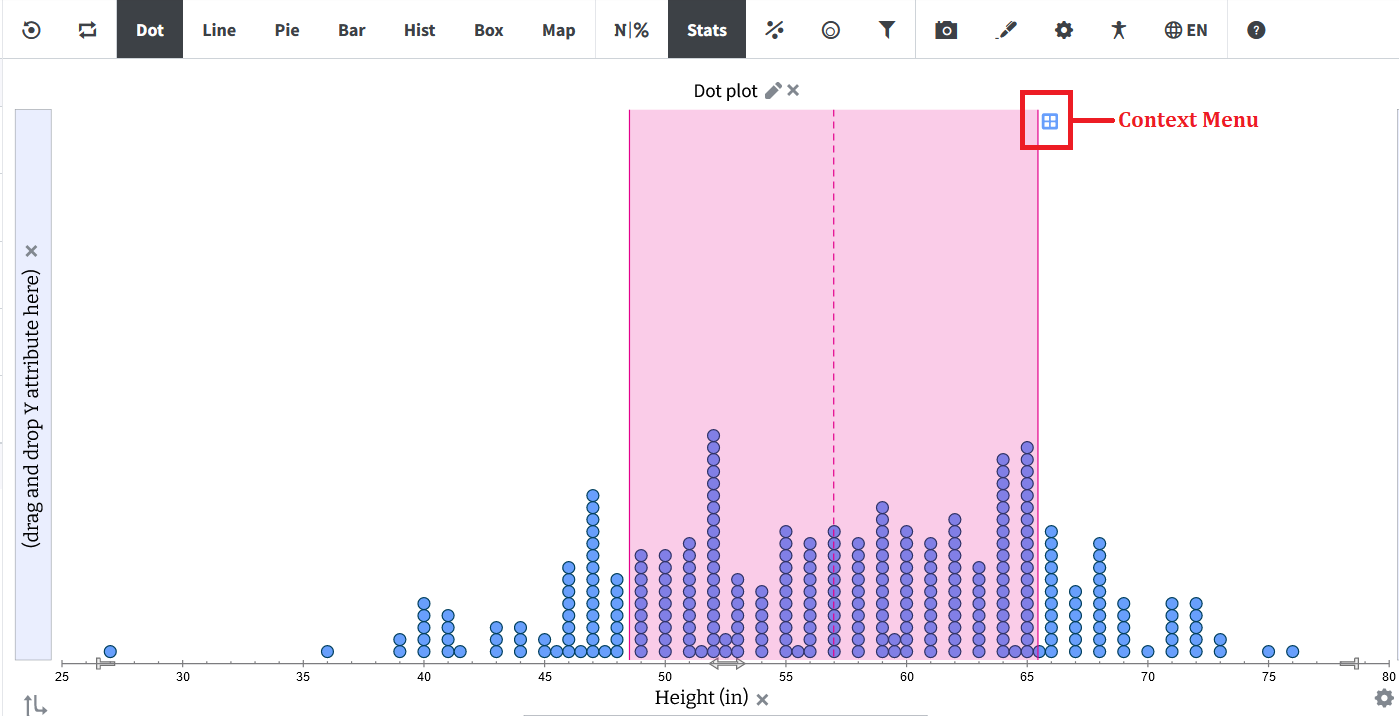
Clicking the icon opens the following context menu.
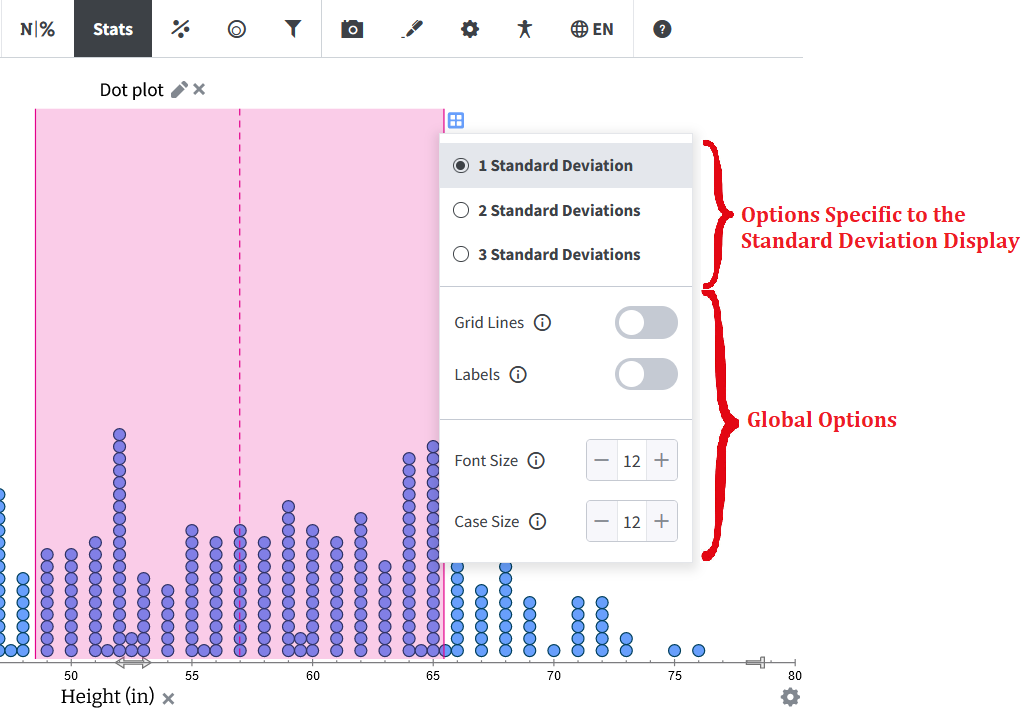
The context menu has two sections. The top section is devoted to specific actions you can do with the element it is tied to and the bottom section gives you generic options related to graphing. For example, in the Standard Deviation(SD) display context menu, the top section allows you to choose the number of SDs you want displayed on the graph while the bottom section lets you tweak the case icon and font sizes and display grid lines and labels. -
Movable Lines & Least Squares Line: You will find the same context
menu for movable and Least Square lines, the only difference is that the icon now
appears where the color picker icon used to be.
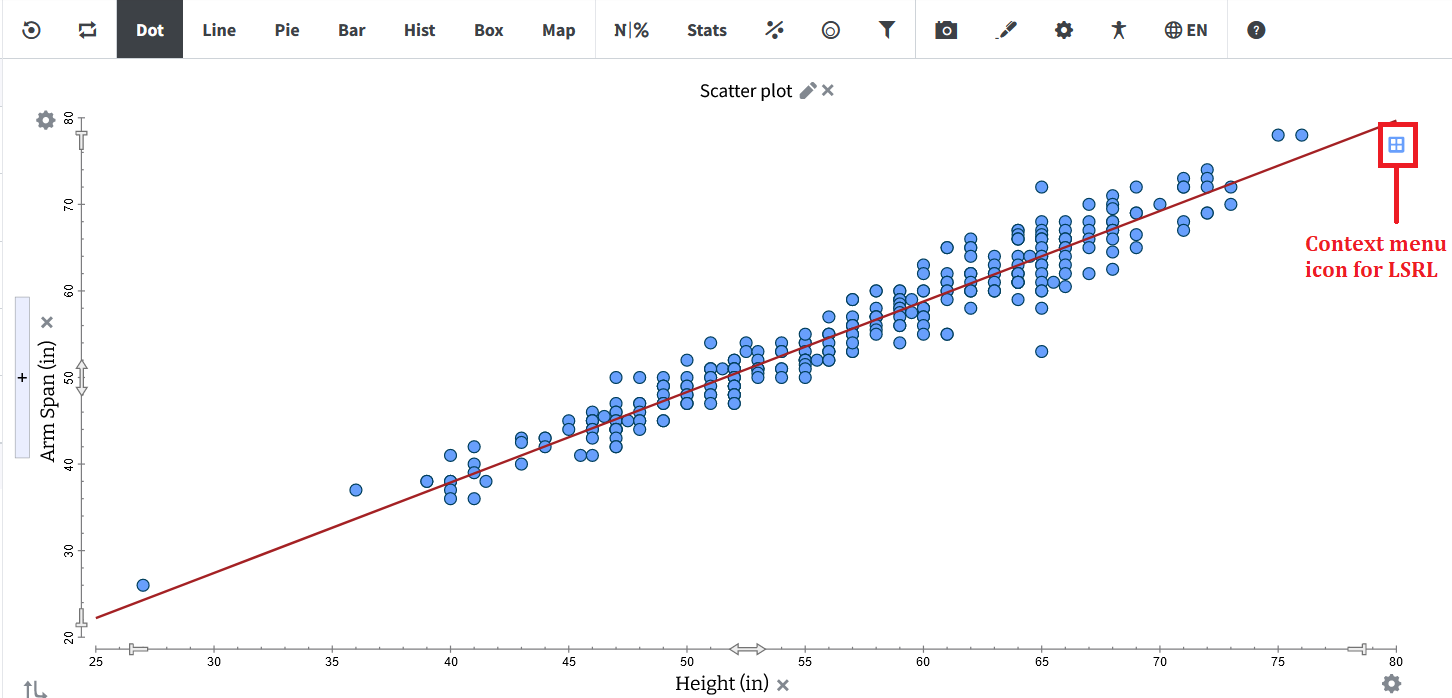
Clicking the icon opens the following context menu.
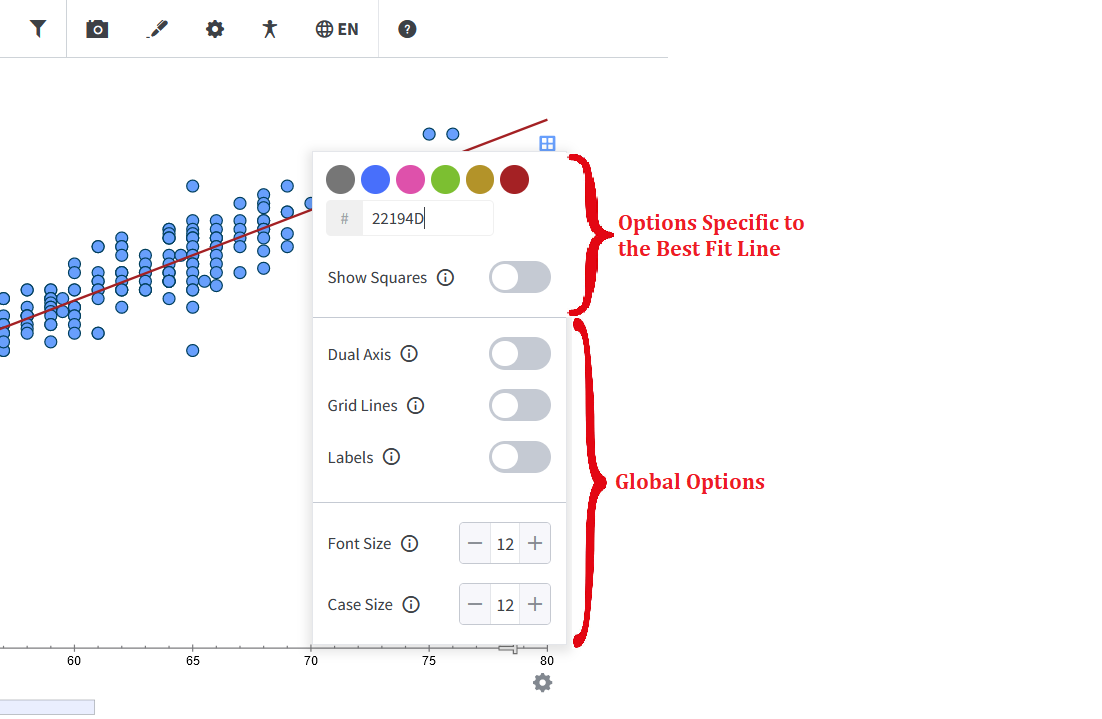
Note that the top section again gives you options relevant for the best fit line such as the color picker and showing residuals and the bottom section gives you generic graphing actions. An addition in the global options section is the Dual Axis which will only show up in the menu when you have a scatter plot. -
Reference Lines and Annotations: A similar context menu is
available for reference lines and the annotations. The menu icon appears where the
color picker icon used to be located for these elements.
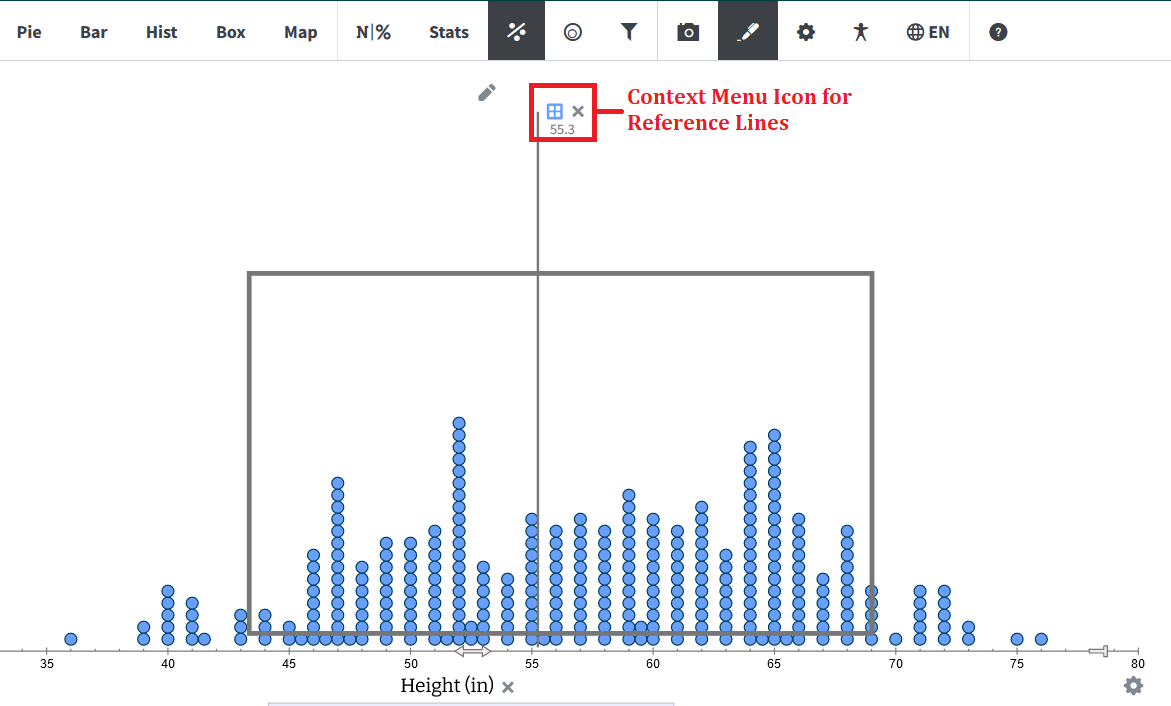
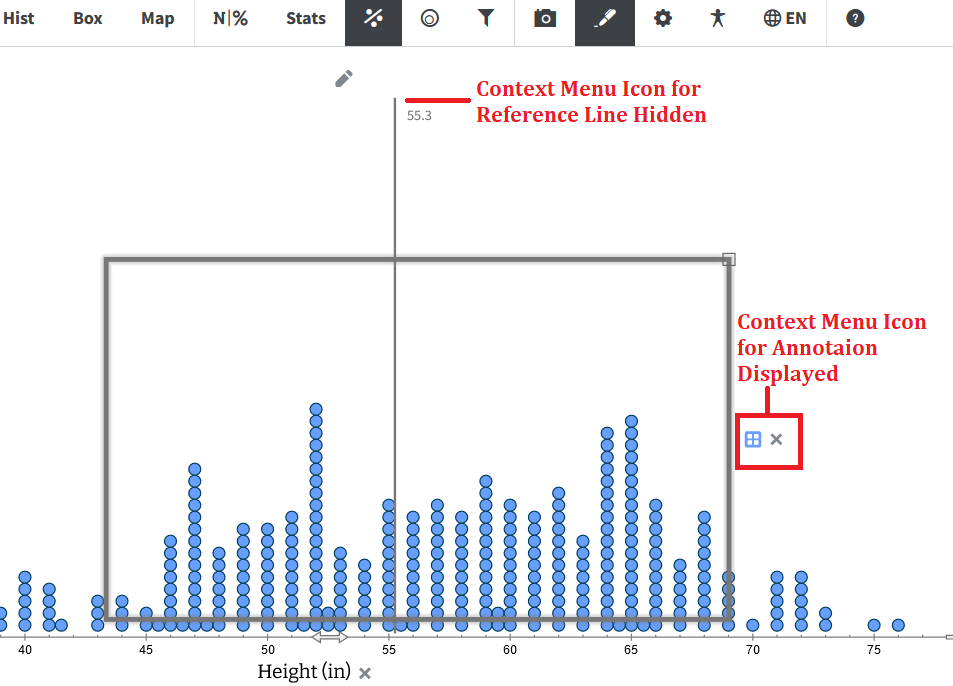
Note that when you have multiple objects in the graphing area, each with their own context menus, only one menu icon for the selected or last added element will appear. For example, in the above screengrab, the reference line has been added after the rectangular annotation, therefore, the menu icon for the reference line is displayed while the menu icon for the annotation is hidden.
If you click on the annotation, then its menu icon will be displayed while the icon for the reference line will be hidden.
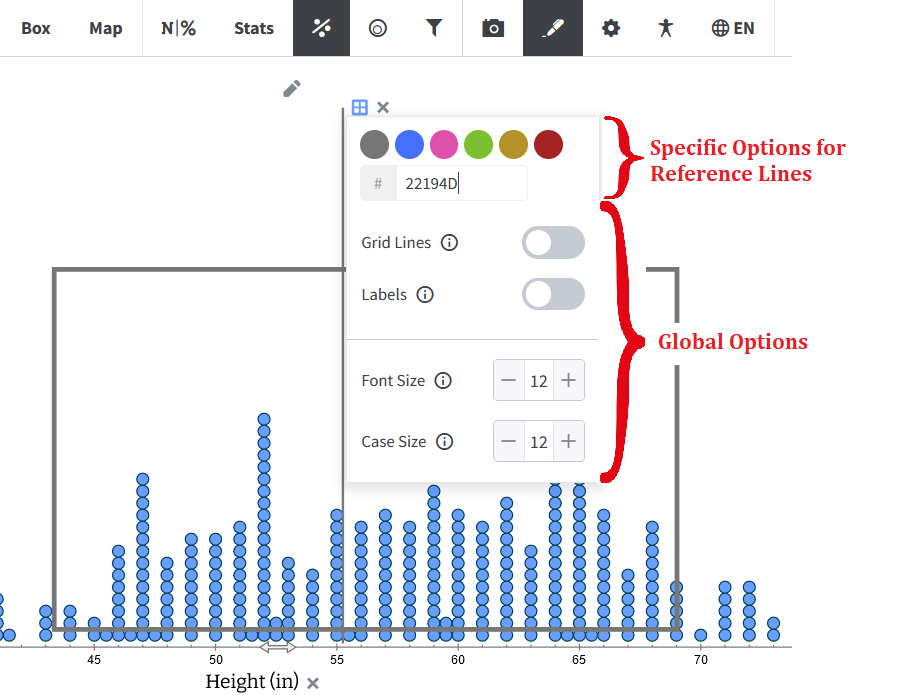
The context menu for both reference lines and annotations looks like this:
-
Standard Deviation Display: The context menu icon appears on the
top right of the right fence of the Standard Deviation display.
-
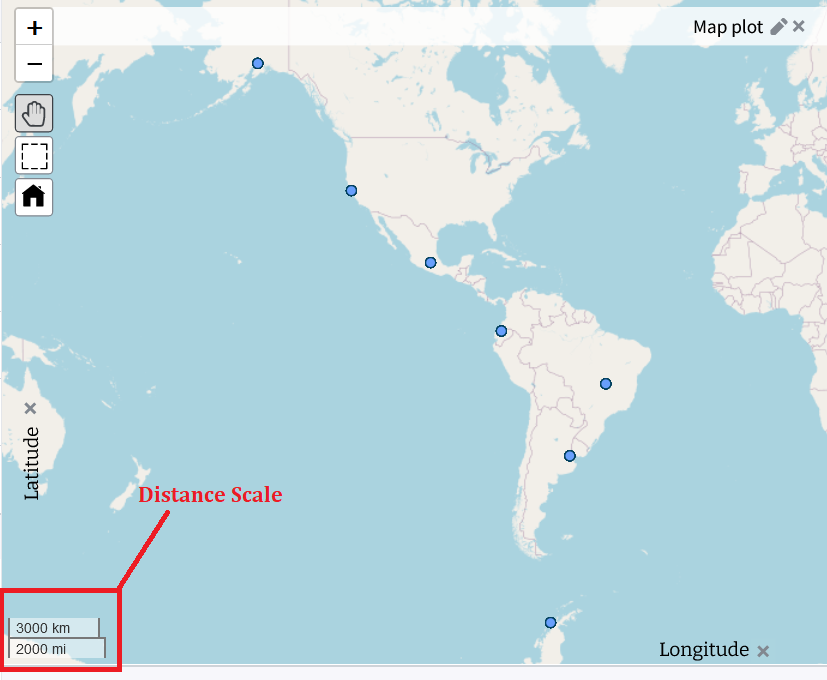
Distance Scale for Map Plots: We added a basic distance scale for Map
plots.
Changed:
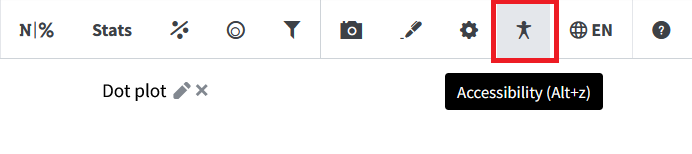
Clicking the tab opens the Accessibility Card on the left of the graphing area.
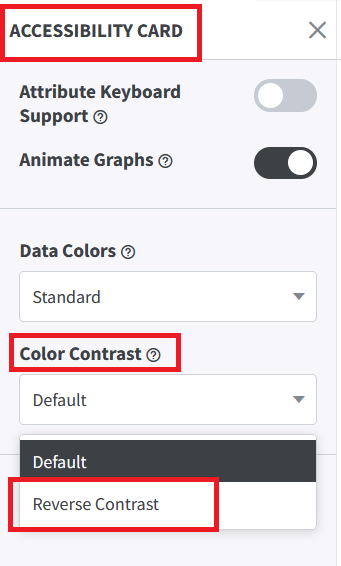
The reverse contrast mode can be selected and enabled from the dropdown under Color Contrast.
-
The Tuva tool can recognize and render diverse month-year formats. Here are a few key
formats that are supported now:
-
MonthName-YYYY and YYYY-MonthName: These formats are recognized under the
following conditions:
- The Month Name is either the full month name (upper or lower case) or an abbreviation with 3+ letters. For example, "Sep", "sept", "September" will be recognized, but not "Se".
- The separator is dash, slash, comma, space or comma-space. Examples: "Jan-1900", "Jan/1900", "Jan 1900", "Jan,1900", "Jan, 1900".
- Year must be 4 digits, so recognized dates range from 0001 to 9999.
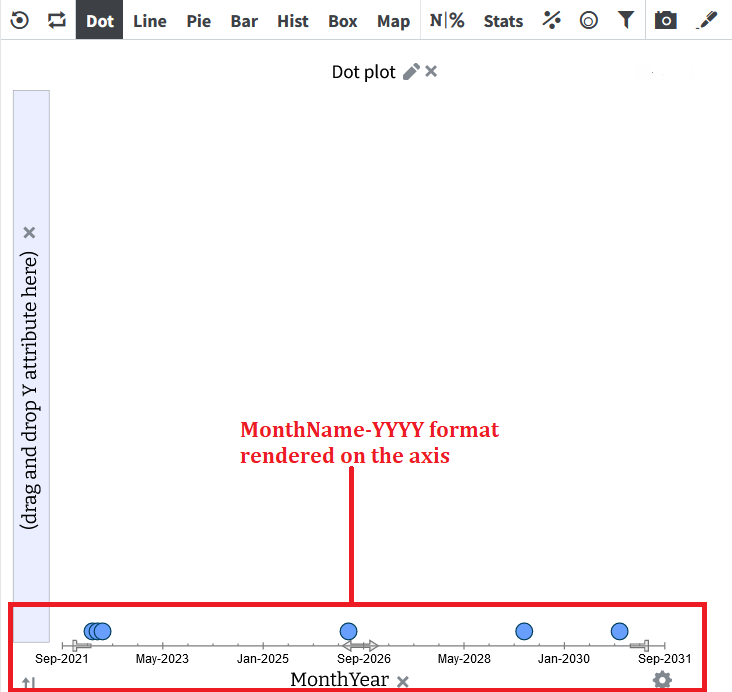
-
YYYY-MM and MM-YYYY: These formats are recognized under the following
conditions:
- Month is 1 or 2-digits
- The separator is slash, dash or period
- Year must be 4 digits, so recognized dates range from 0001 to 9999
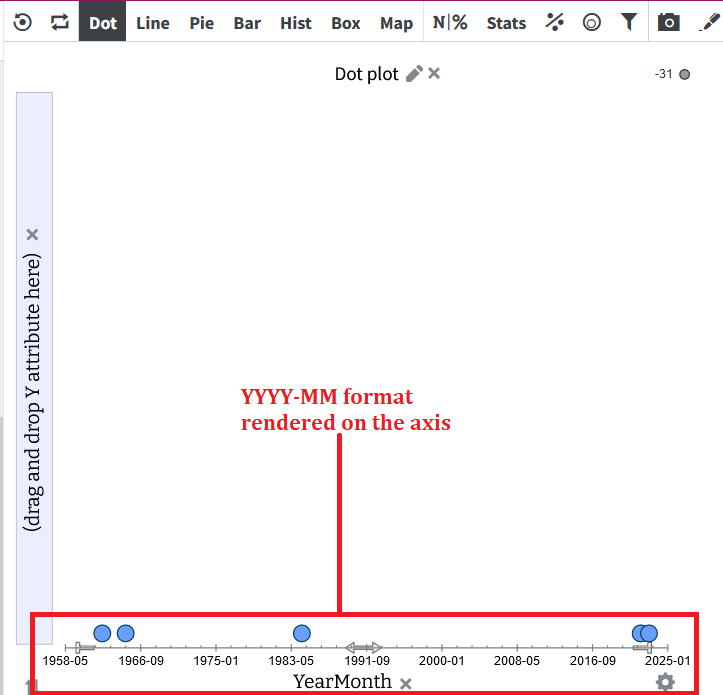
Counter-examples. The following are NOT valid month-year or year-month values:- 01/02 (must be 4 digits before or after slash to know which is year)
- 1/2022
- 2022/01/15 (this is a date, not a month-year)
- March.2022 (wrong separator)
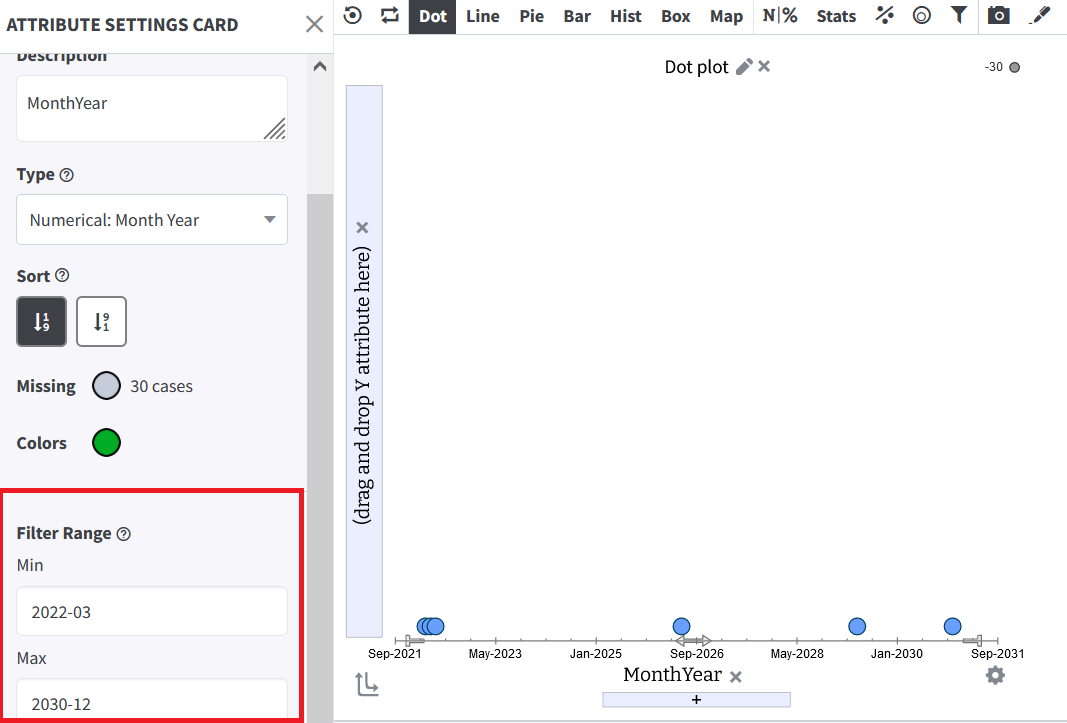
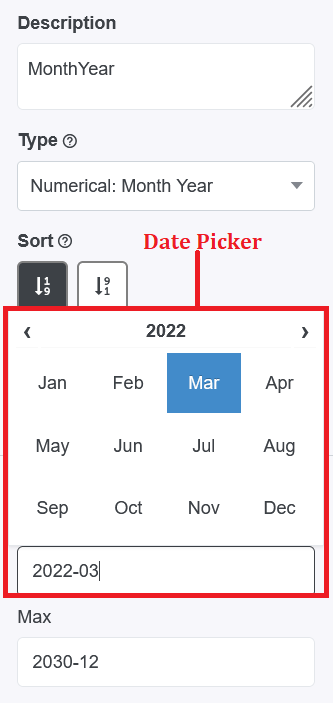
Clicking on the Min/Max fields under the Filter Range opens a nifty date picker using which you can easily set the range.
- The Tuva tool can now convert date formats (YYYY-MM-DD) to Month-Year format as well.
-
MonthName-YYYY and YYYY-MonthName: These formats are recognized under the
following conditions:
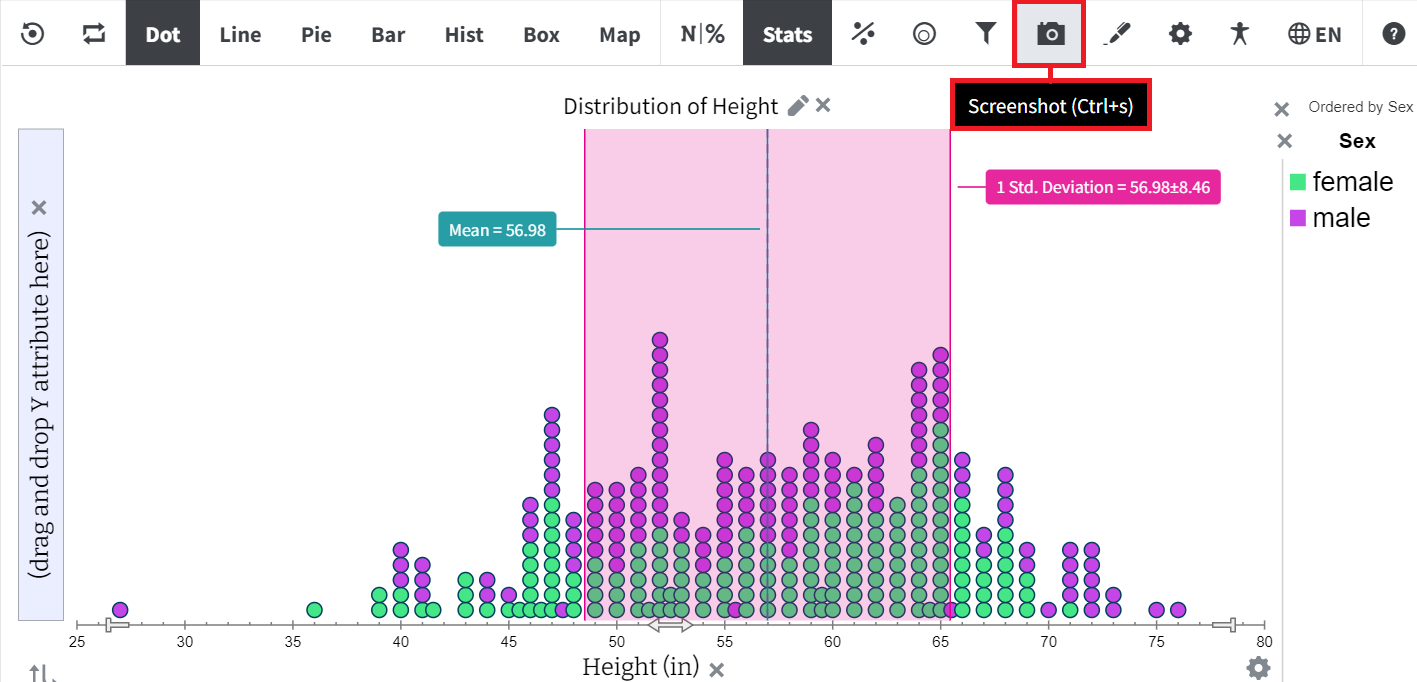
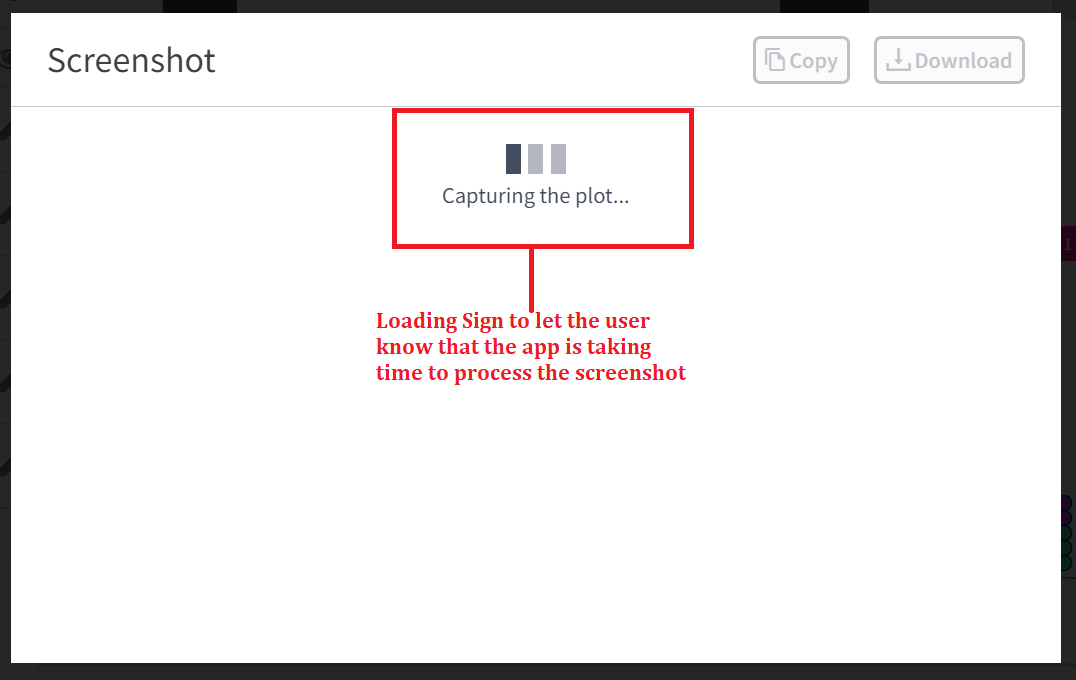
We have enhanced the Screenshot feature to show a loading sign to inform the user that the app is capturing the screenshot.
After the screenshot is captured, a preview of the image is displayed along with the choice to copy or download.
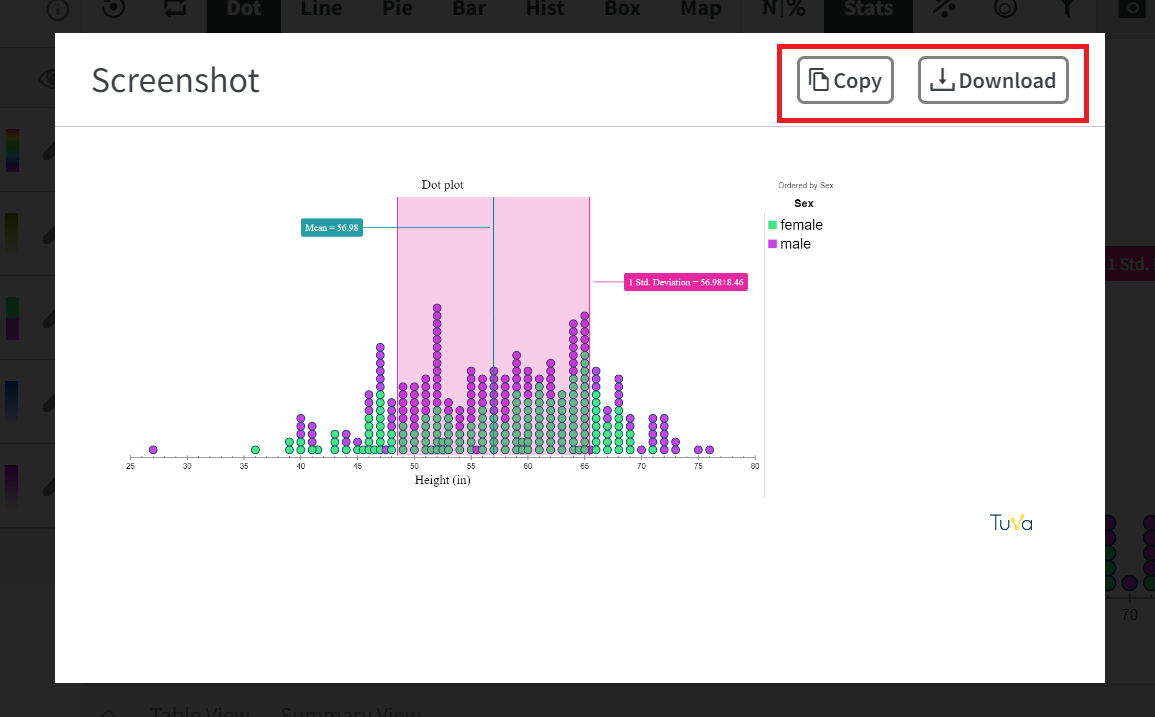
You can use the Copy tab to directly copy and paste the image in a chat window or a document. Choosing Download saves the image file on your computer.
Bug Fixes:
We fixed several bugs of which the major ones are listed below:
-
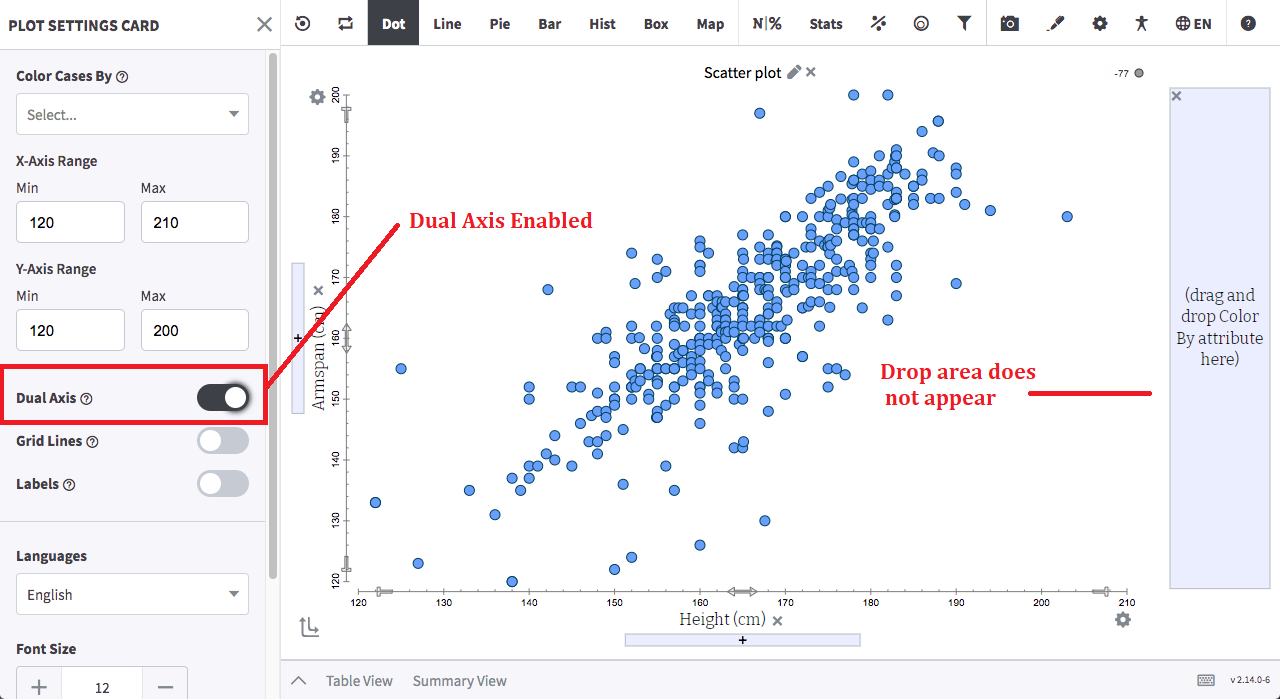
Y2 drop area was not appearing after enabling the Dual Axis
-
A background behind the plot title was appearing in the reverse contrast making it illegible

-
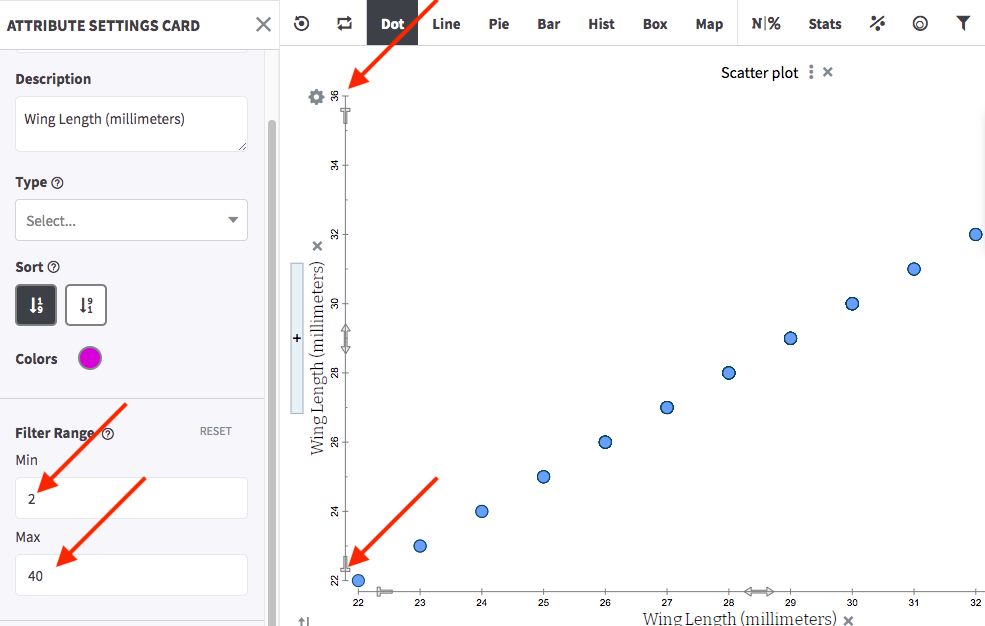
Updating the Min-max values for a numerical attribute in the attribute settings card was not
reflecting the change on the corresponding axis
-
When sorting a numerical attribute with values containing commas, the Table View sorting was
ignoring all digits after the comma