Screen Reader & ARIA Compatibility
Tuva is committed to making data exploration accessible to all learners. ARIA labels are implemented throughout the data tools — across attribute cards, the toolbar menu, and the plotting area — so learners who use screen readers or text-to-speech software can fully participate in data analysis.
Who benefits
- Students with blindness or low vision using screen readers
- Students with reading impairments using text-to-speech software
See it in action
Demonstration: Screen reader navigating Tuva's data tools via ARIA labels
Data Color Modes
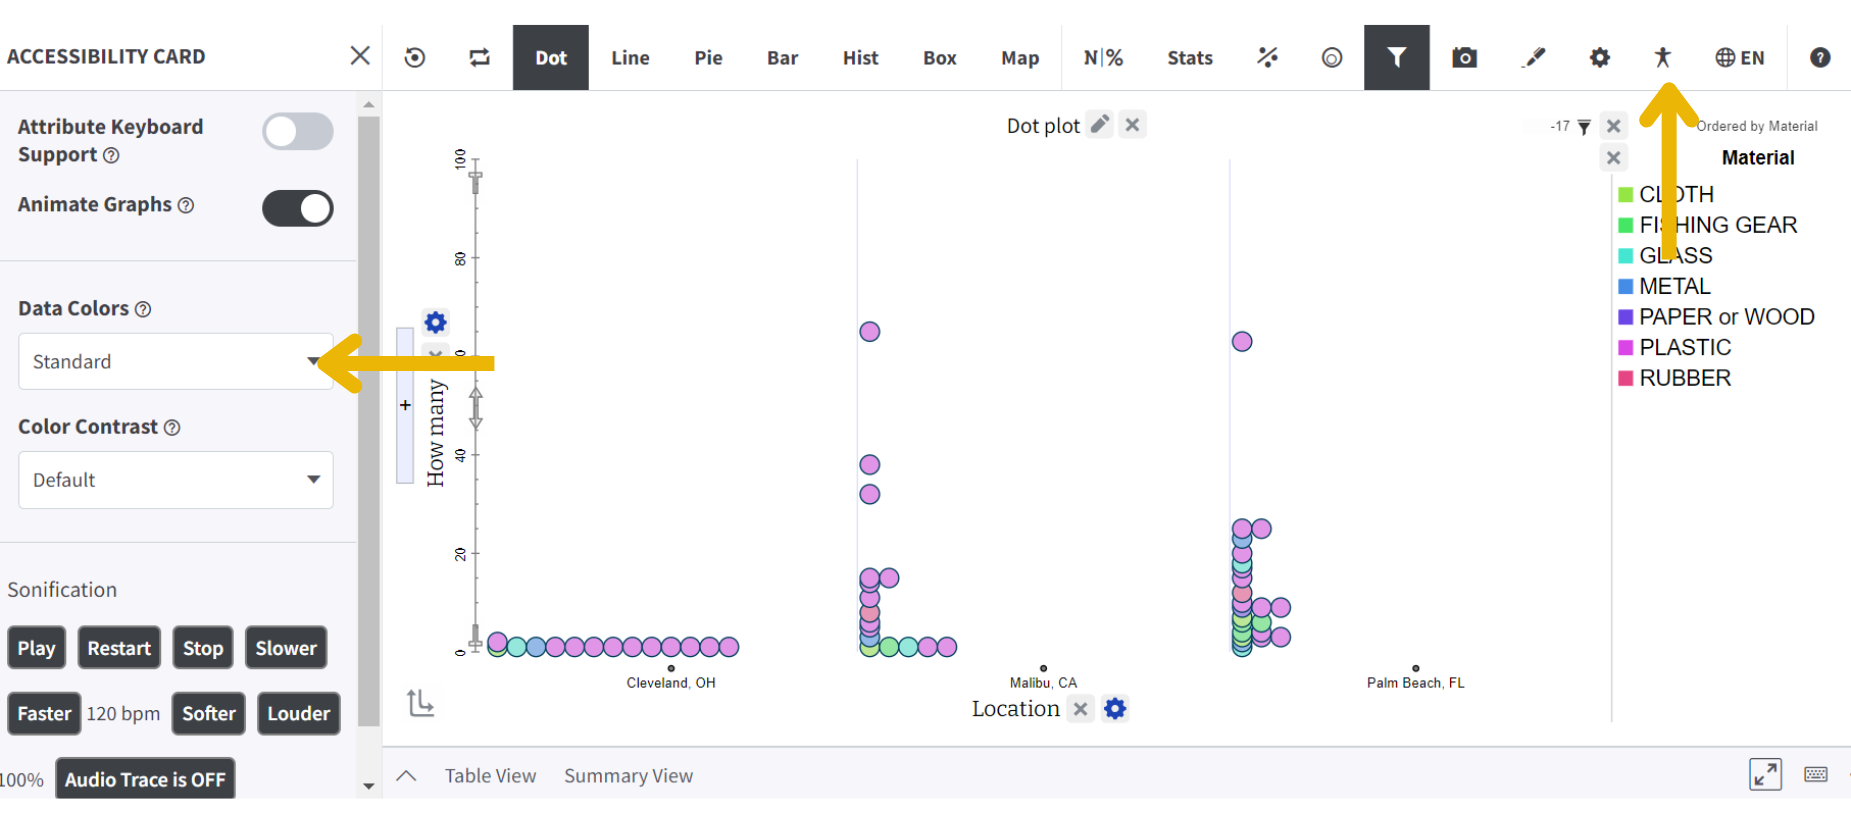
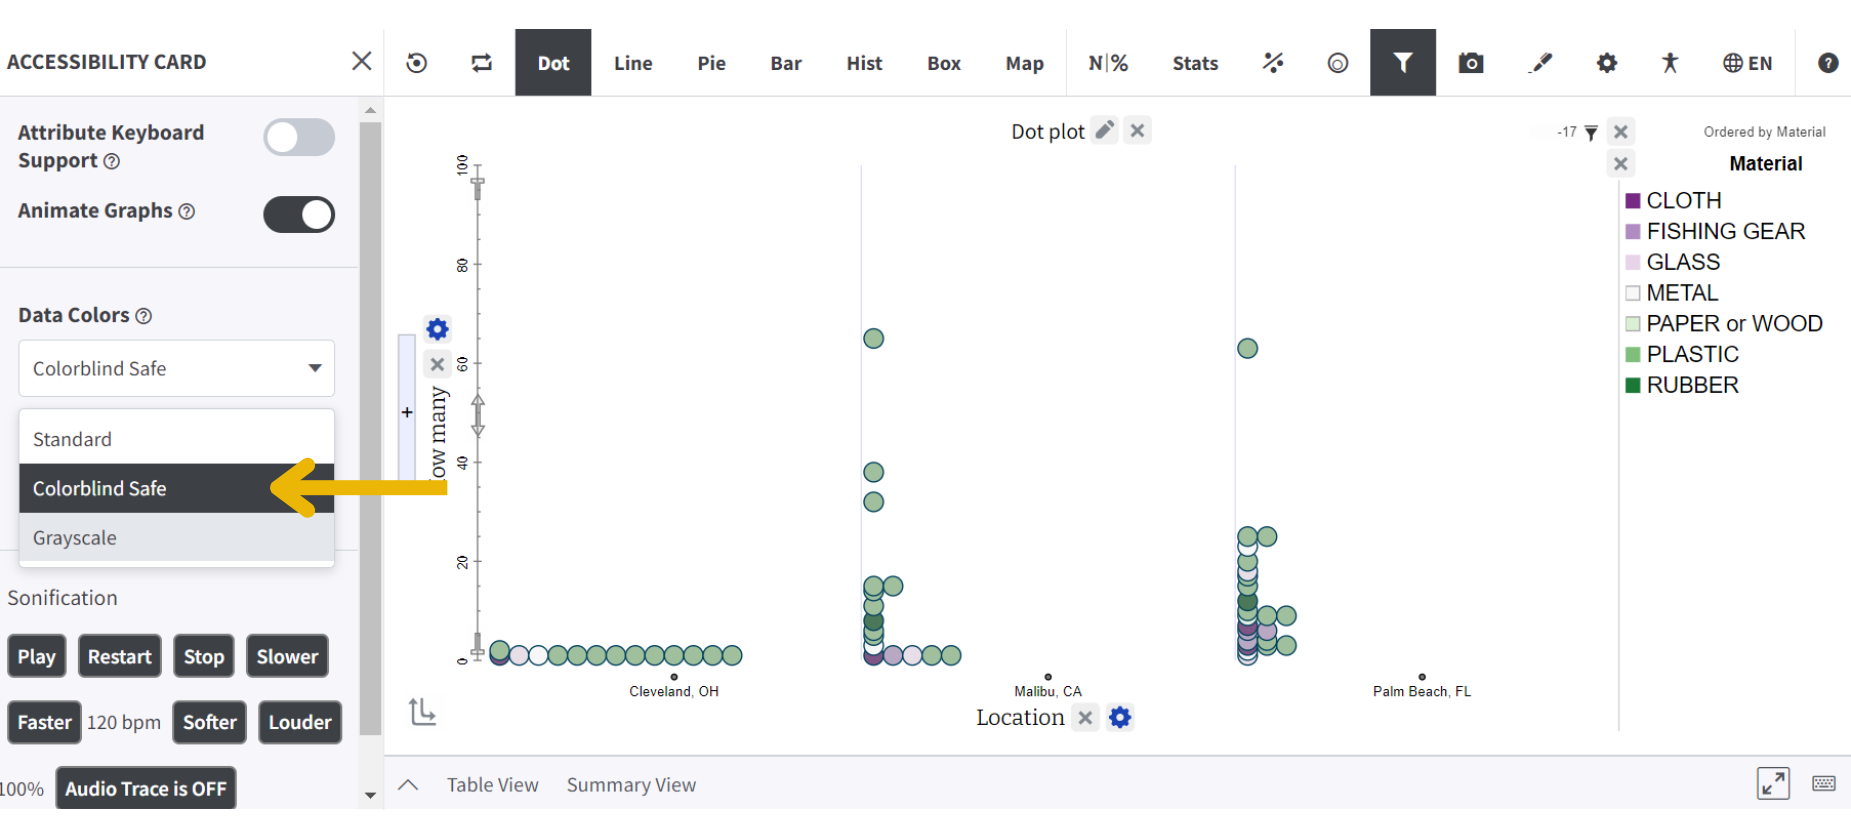
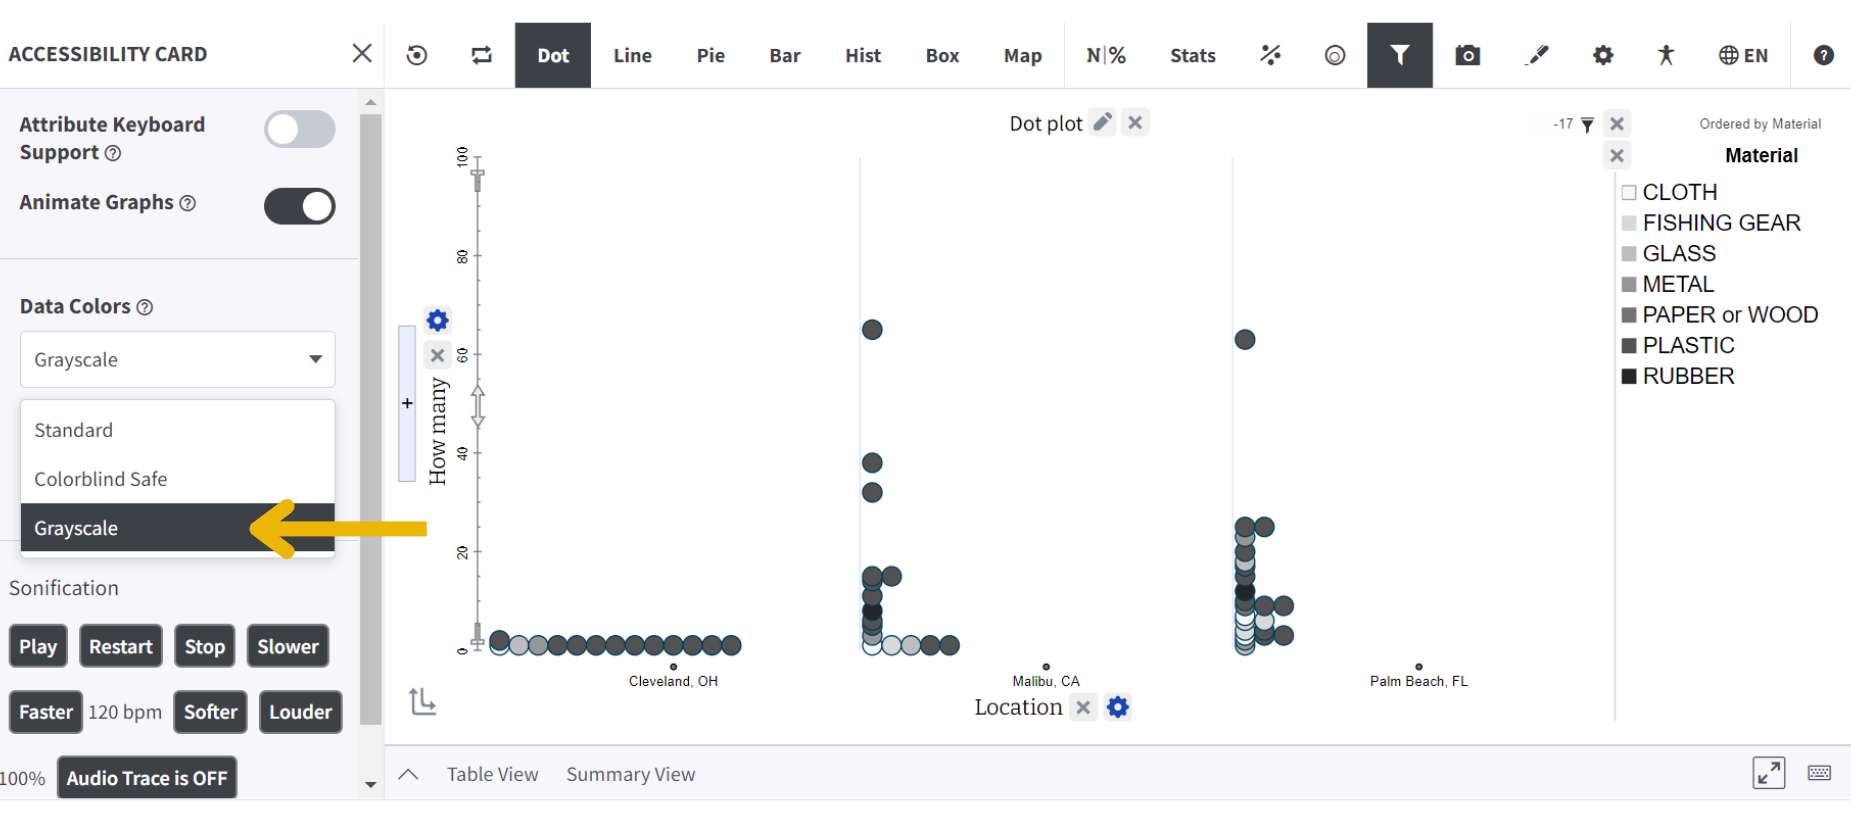
Tuva's color settings let learners with colorblindness distinguish and interpret data clearly. Changing the mode updates the colors assigned to all data points across the plotting area.
Available color modes
- Standard — default palette
- Colorblind Safe — modified palette distinguishable for common types of colorblindness
- Grayscale — removes all color, useful for high-contrast printing or severe colorblindness
How to change data colors
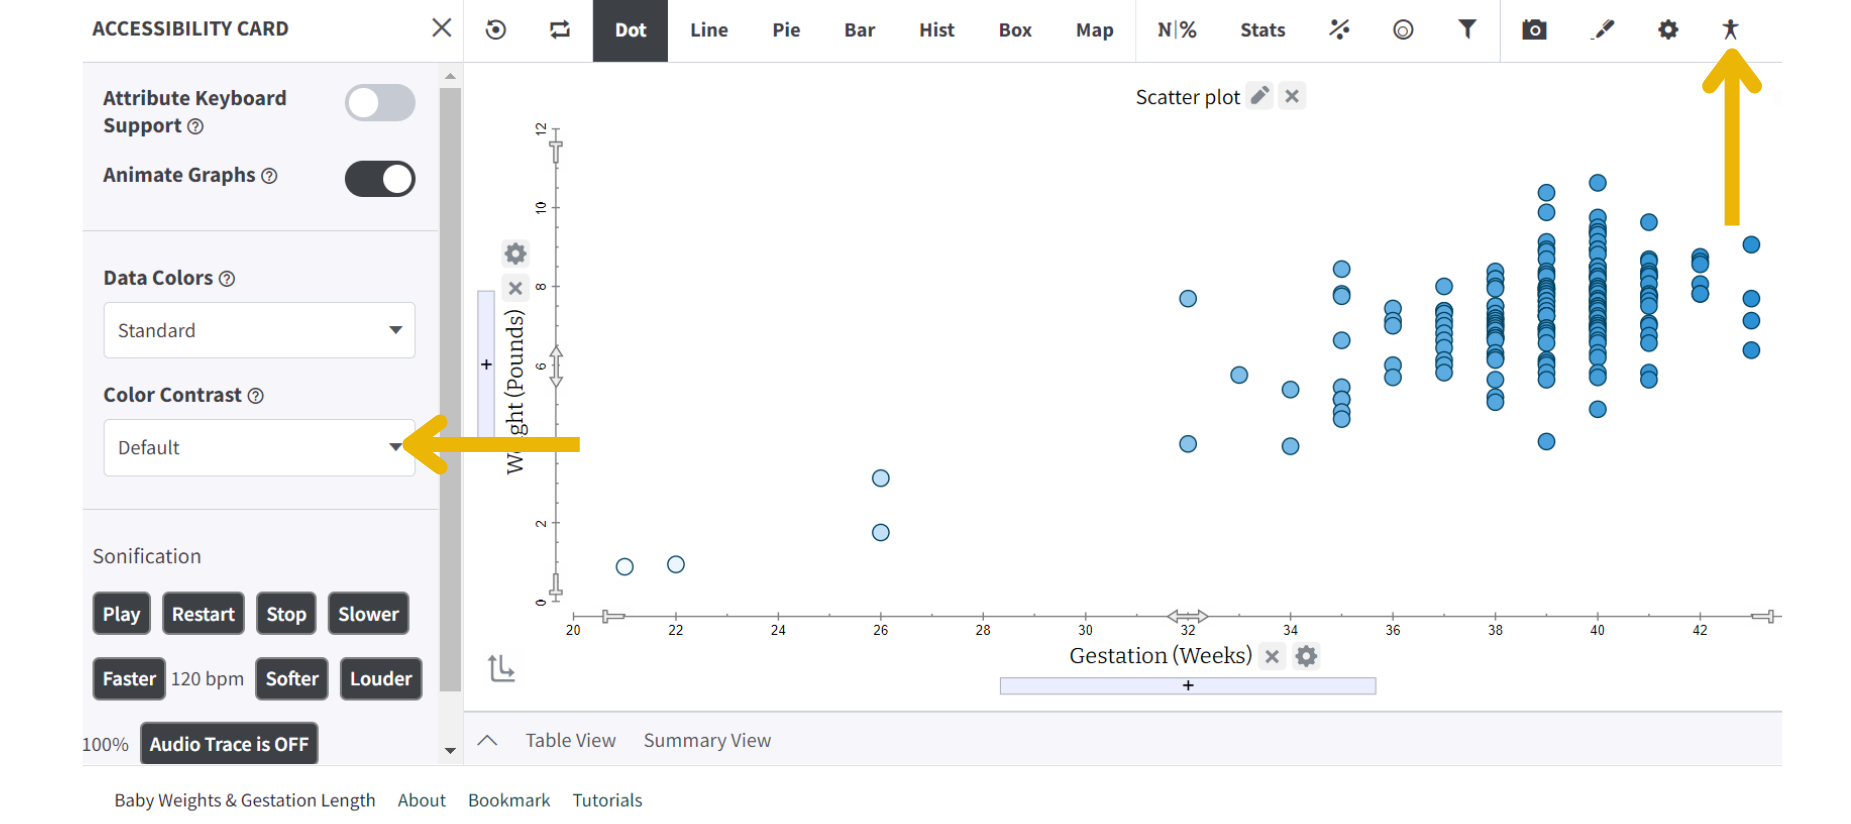
- Click the Accessibility button in the toolbar to open the Accessibility Card.
- Locate the Data Colors dropdown menu within the Accessibility Card.
- Select Colorblind Safe or Grayscale. Colors of all plotted attributes update immediately.
Color Contrast Settings
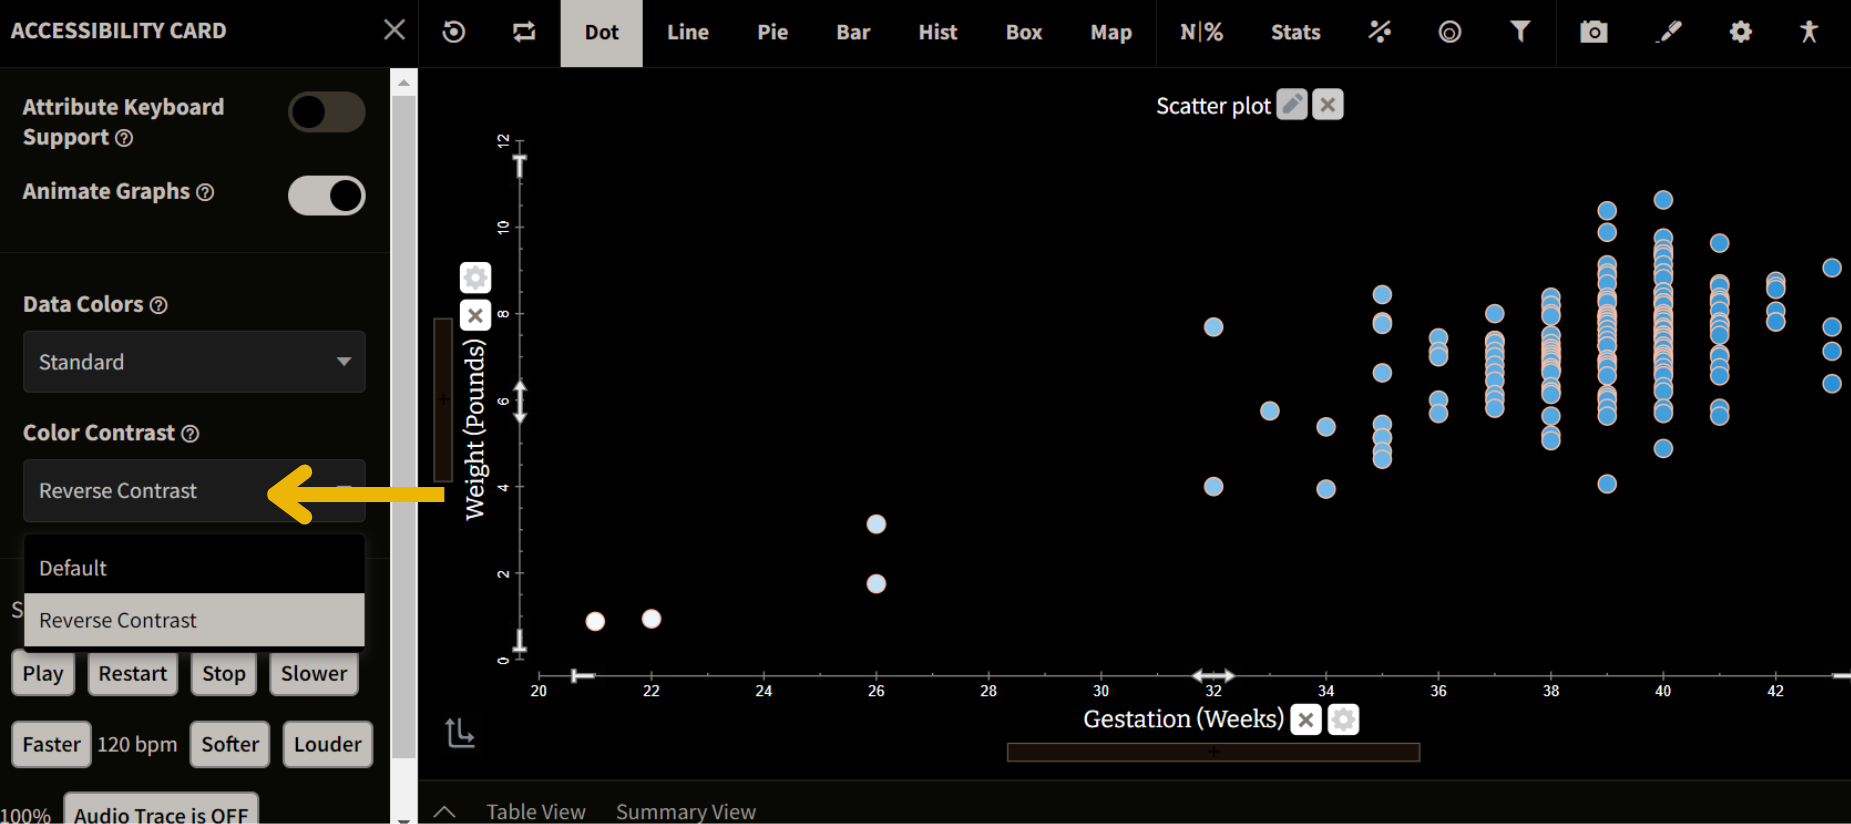
Adjusting color contrast helps learners with low visual acuity read on-screen information more easily. This setting modifies the foreground, background, and text colors across the tool.
Available contrast modes
- Default — standard contrast
- Reverse Contrast — inverts the color scheme for users who find light-on-dark easier to read
How to change contrast
- Click the Accessibility button in the toolbar.
- Locate the Color Contrast dropdown in the Accessibility Card.
- Select Default or Reverse Contrast. The display updates immediately.
Font & Case Size
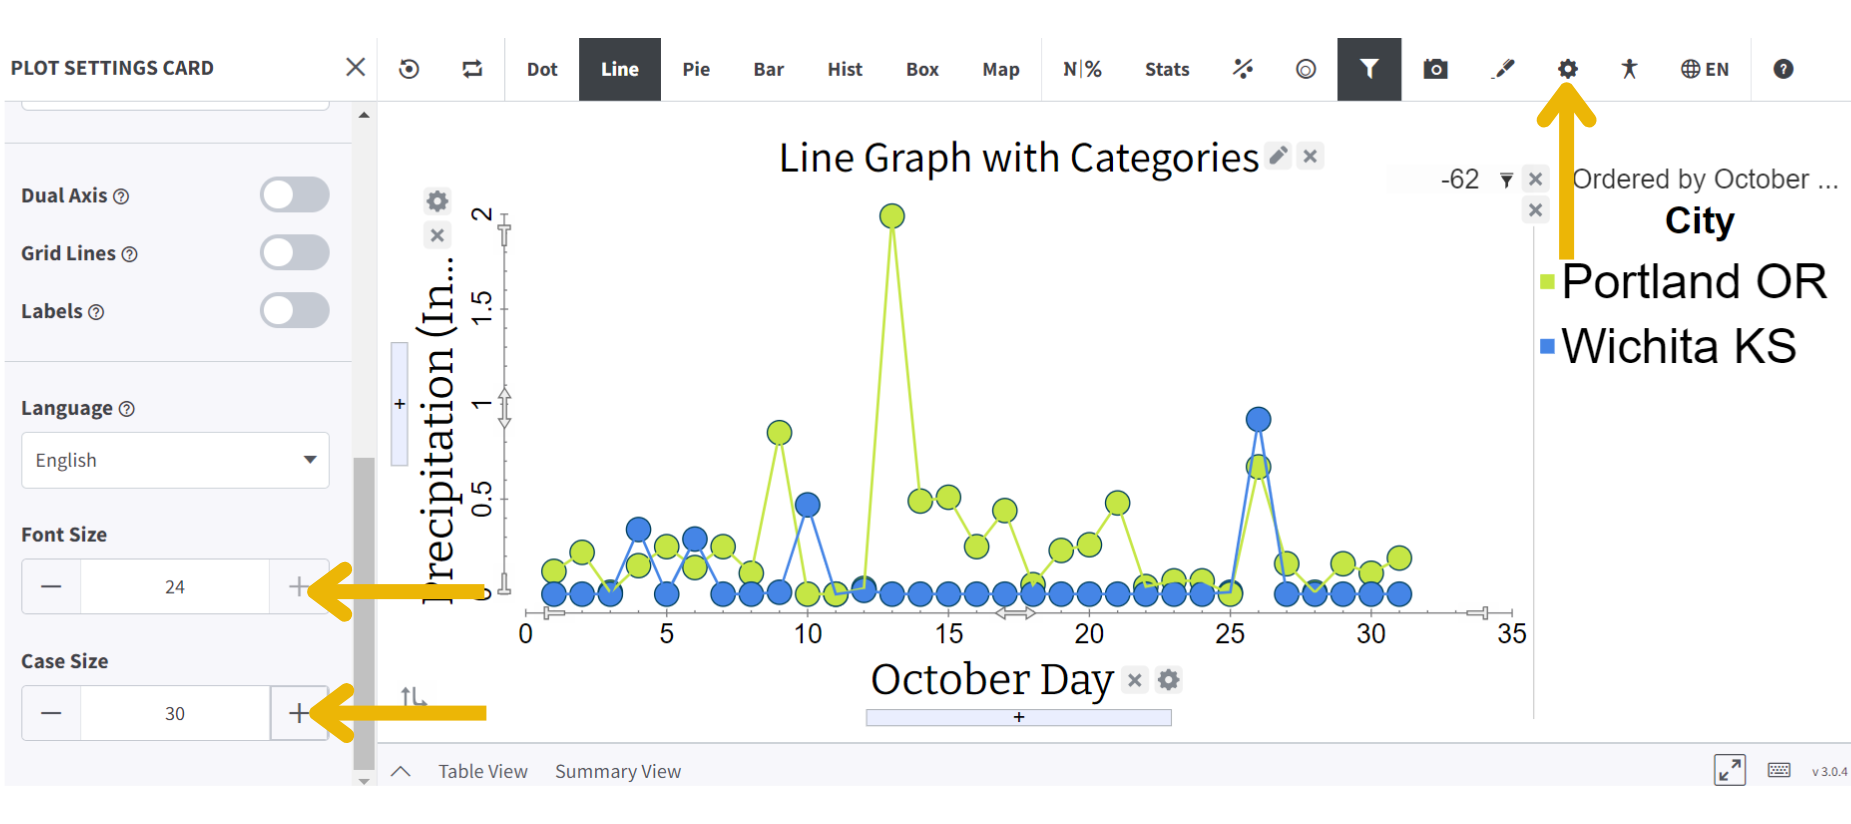
For learners with low visual acuity, Tuva lets you independently adjust both the font size and the case (dot) size within the plotting area — making charts easier to read without changing anything else.
How to adjust font and case size
- Open the Plot Settings Card via the toolbar.
- To increase Font Size: locate the font size controls at the bottom of the card and click "+". All text in the plotting area grows.
- To increase Case Size: find the case size controls in the same card and click "+". All data point circles grow.