Animation Control
For learners who are sensitive to or easily distracted by motion, Tuva provides a toggle to disable all animations in the data tools. This creates a quieter, distraction-free environment for data analysis.
Who benefits
- Students with vestibular disorders who experience nausea or dizziness from on-screen motion
- Students with ADHD or attention challenges who are easily distracted by movement
- Students with sensory processing differences who find animations overstimulating
By default, animations are enabled because they provide visual feedback that helps most learners draw connections between different graphical representations of their data. Disabling them does not affect any functionality.
How to Turn Off Animations
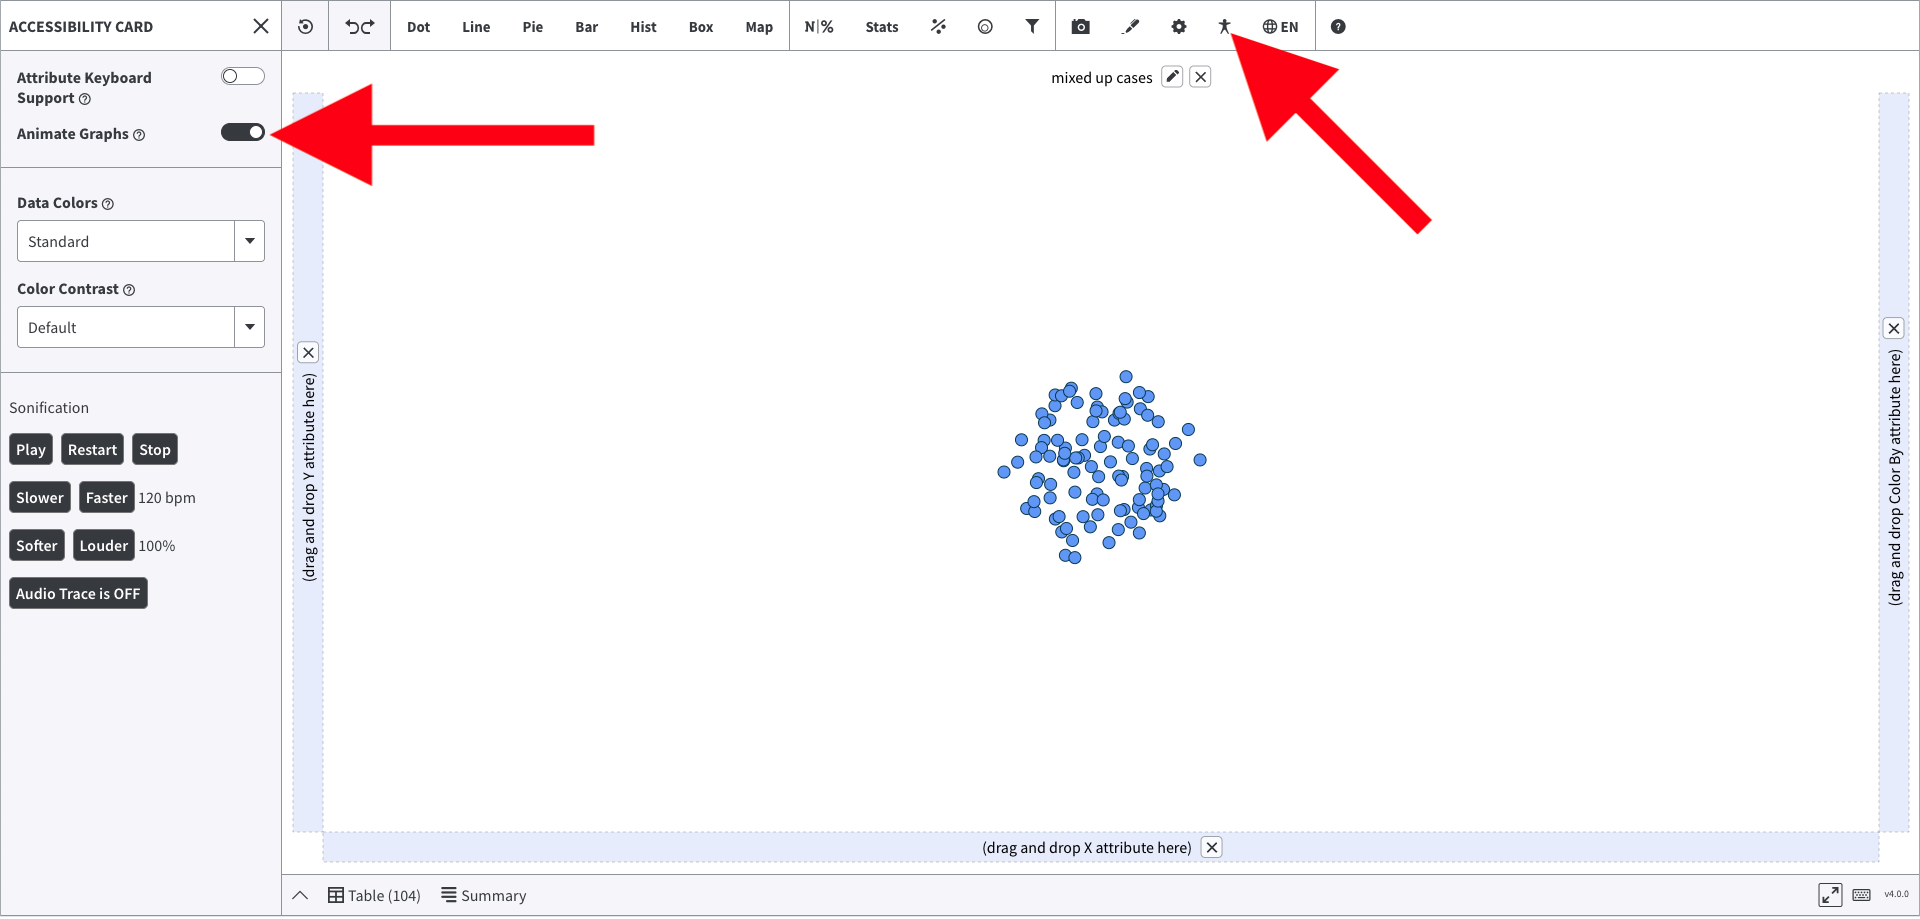
- Click the Accessibility button in the toolbar to open the Accessibility Card.
- Inside the Accessibility Card, find the Animate Graphs toggle.
- Slide the toggle left to disable animations. The change takes effect immediately.
Data Sonification Beta
Data sonification lets users hear their data rather than, or in addition to, seeing it. Tuva's sonification feature maps the visual data in the plotting area to audio tones, giving learners with blindness or severe visual impairments a way to engage in data exploration through sound. This feature is currently in beta — it is available to try but is still under active development.
Who benefits
- Students with blindness who cannot perceive visual graphs
- Students with severe low vision who benefit from an audio layer reinforcing what they see
See it in action
Demonstration: Data sonification in Tuva — data values mapped to audio tones