12/20/2025
Release 3.6.1
Version 3.6.1 of Tuva Tools focused entirely on strengthening usability and accessibility across Tuva Jr., the core Tuva tools, and the Insert Data environment. The team initiated the transition of the underlying table-view library from Handsontable to ReactGrid. This is a significant upgrade and will span multiple development cycles. Additional improvements include enhancements to axis-origin behavior, improvements to the Bar Chart of Frequency, the introduction of a guided tour for both Tuva and Tuva Jr., and an updated screenshot pop-up experience.
-
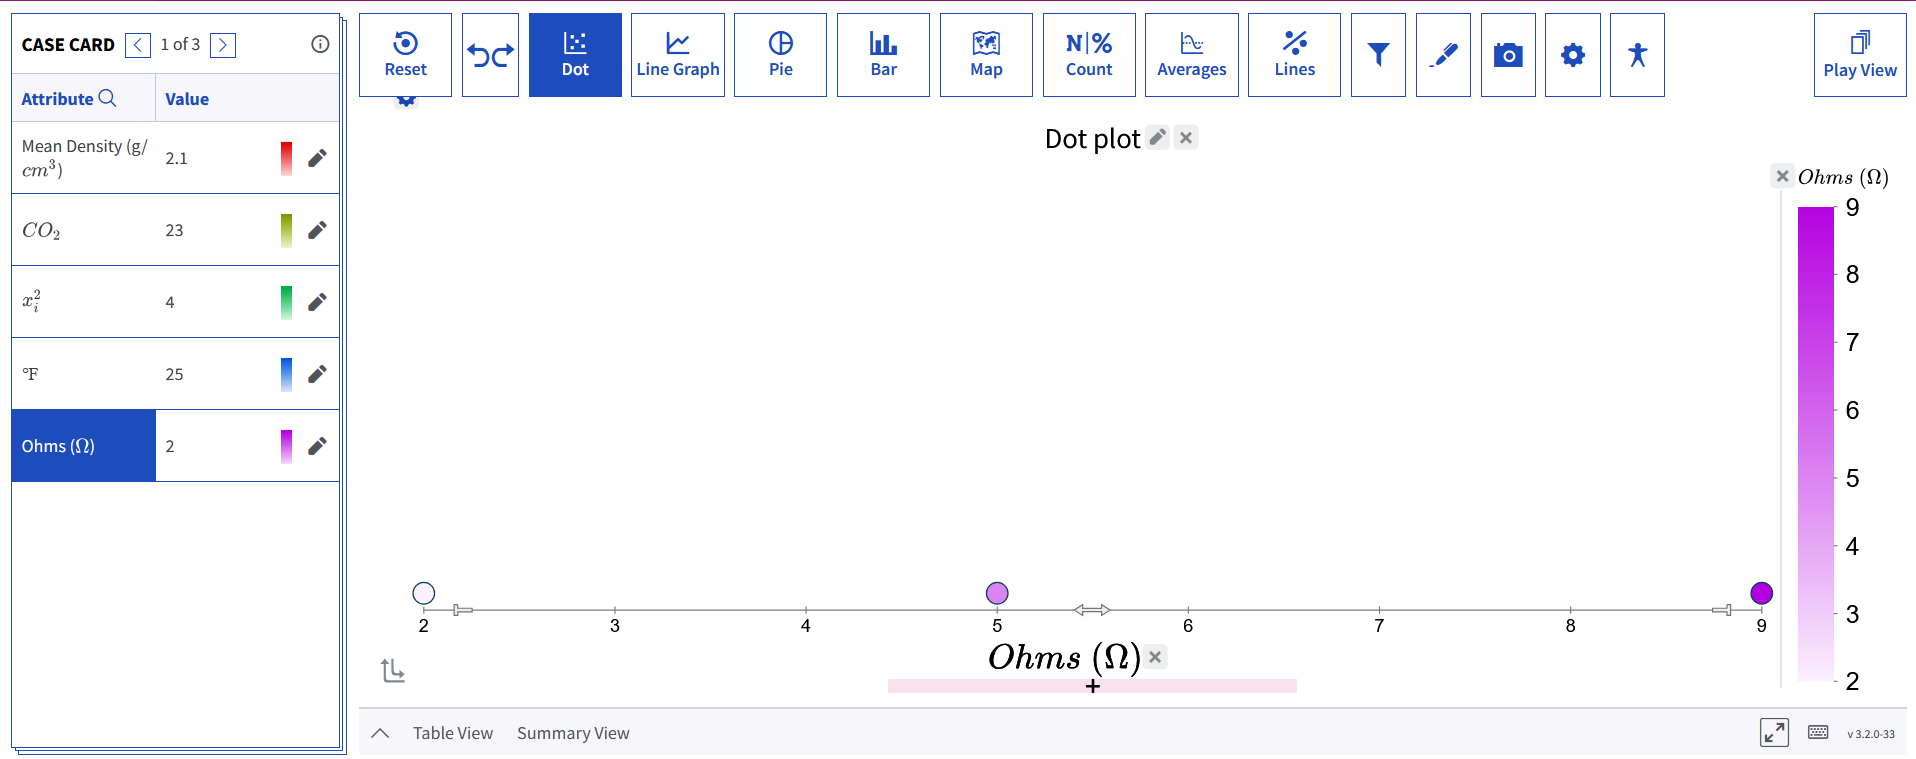
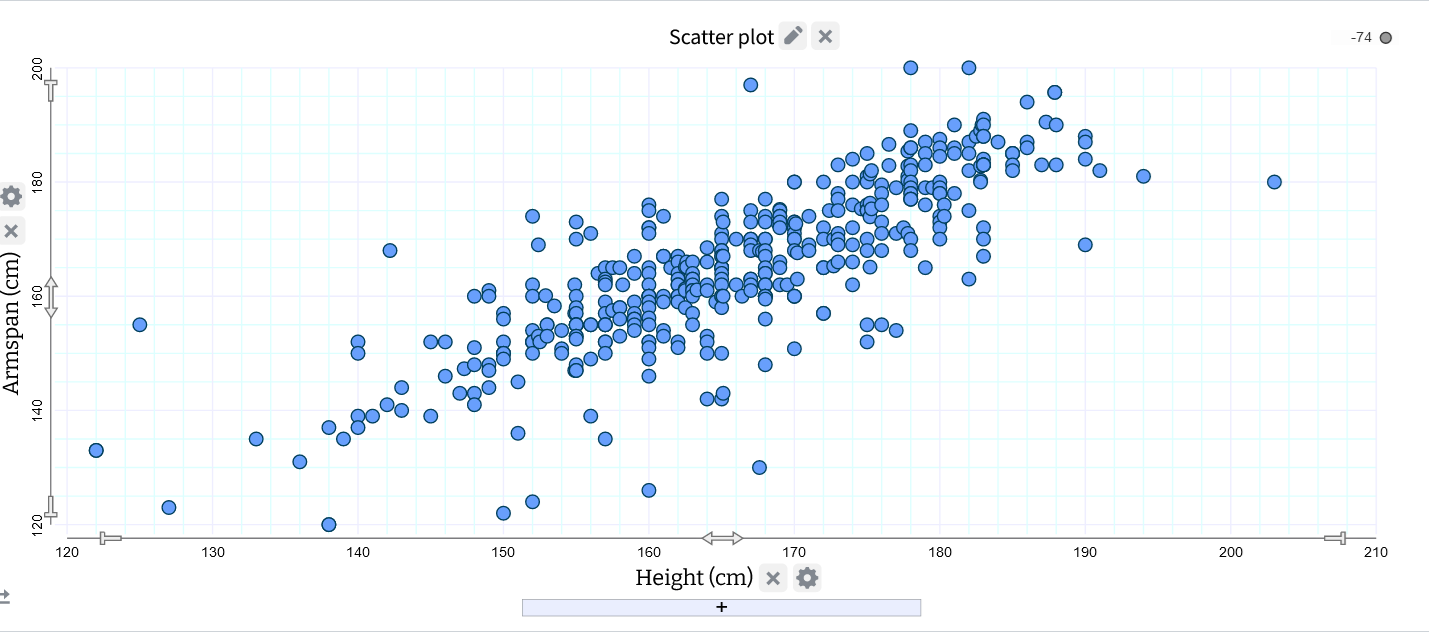
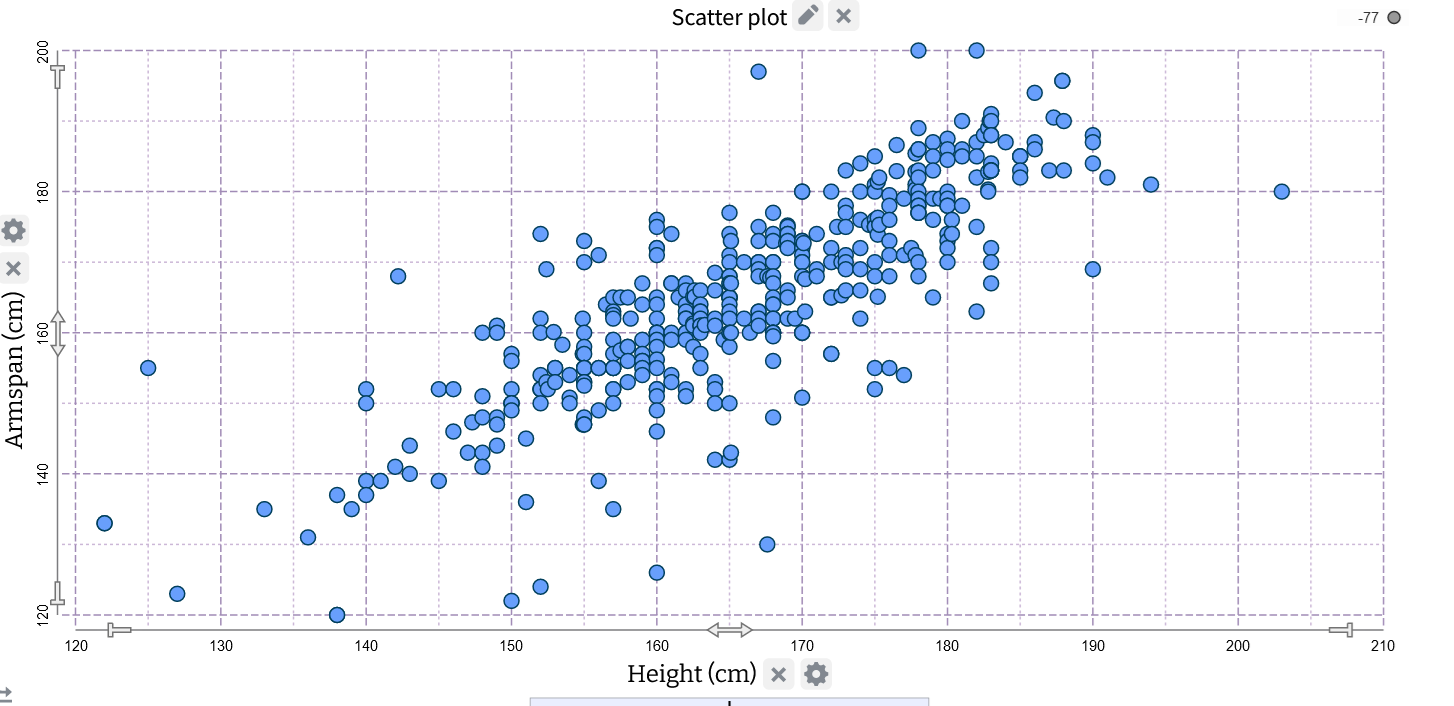
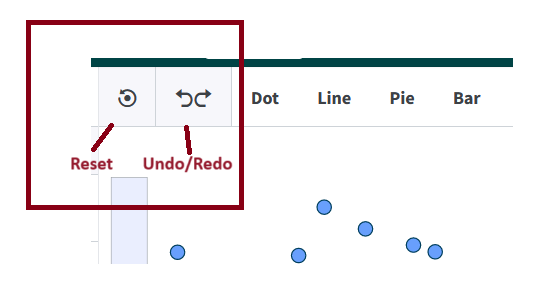
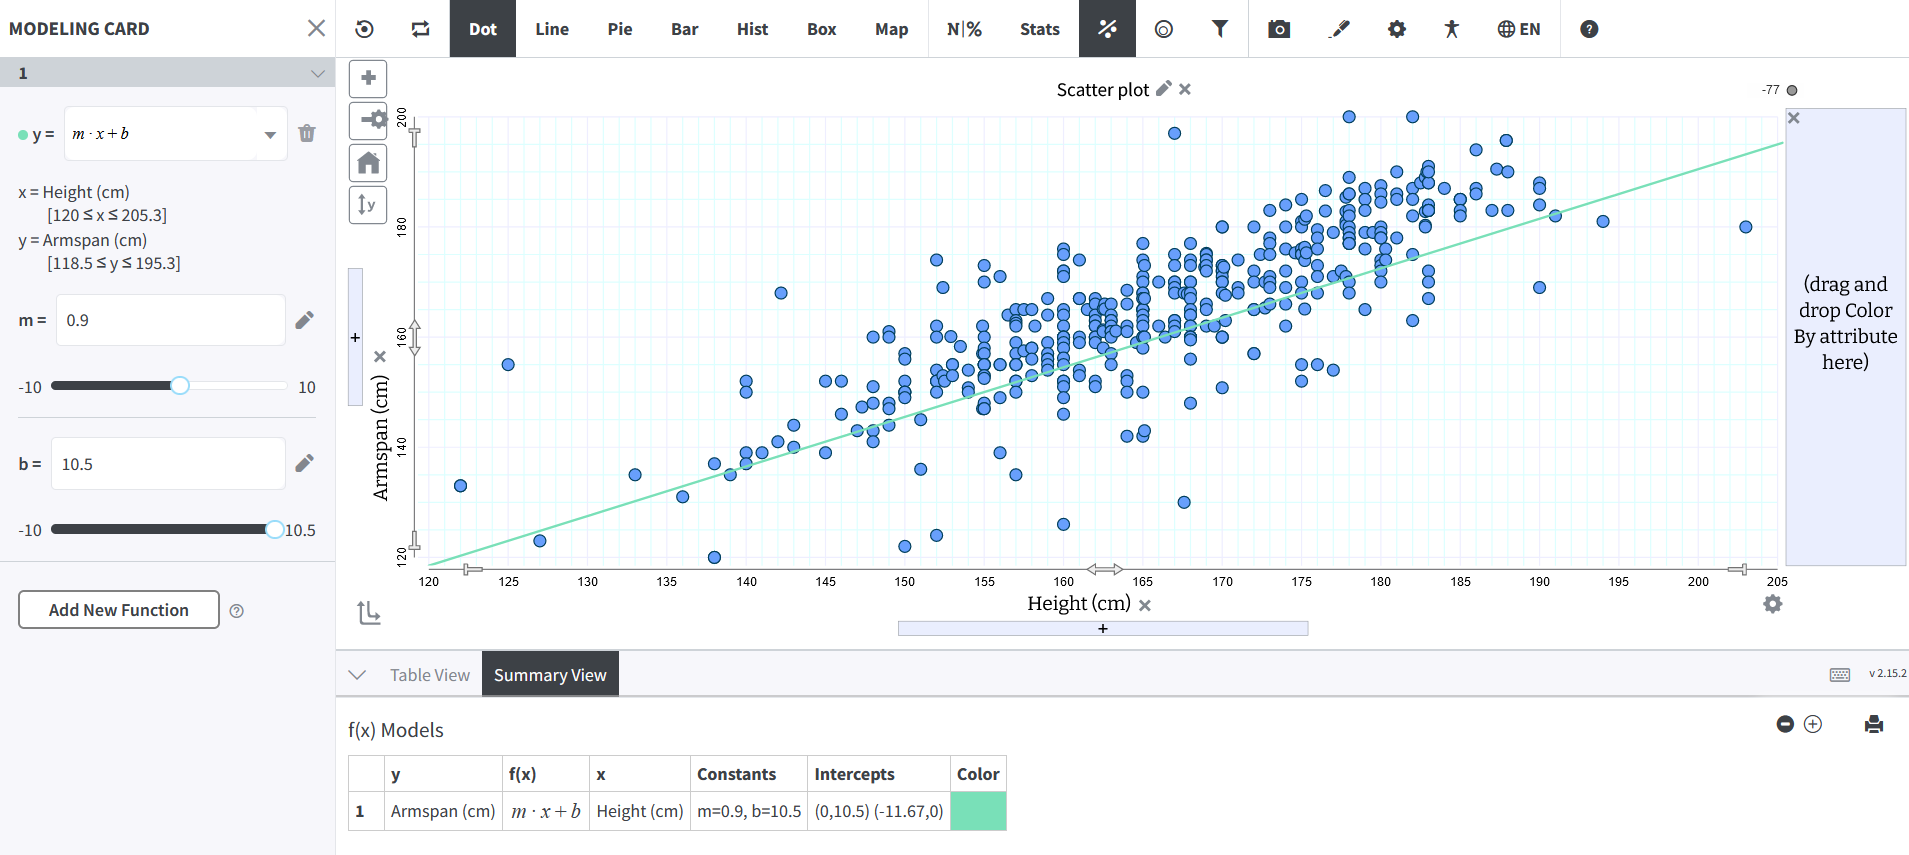
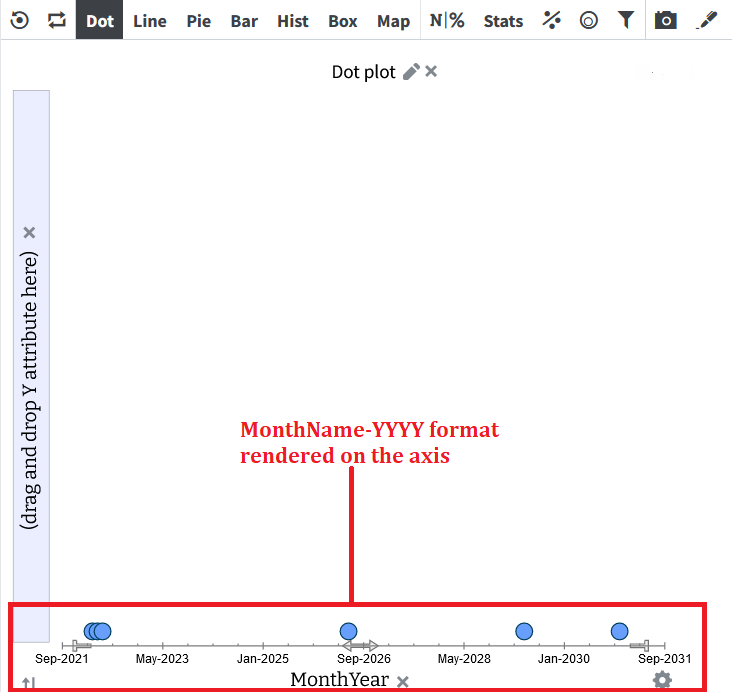
Enhancements to the Axis Origin:
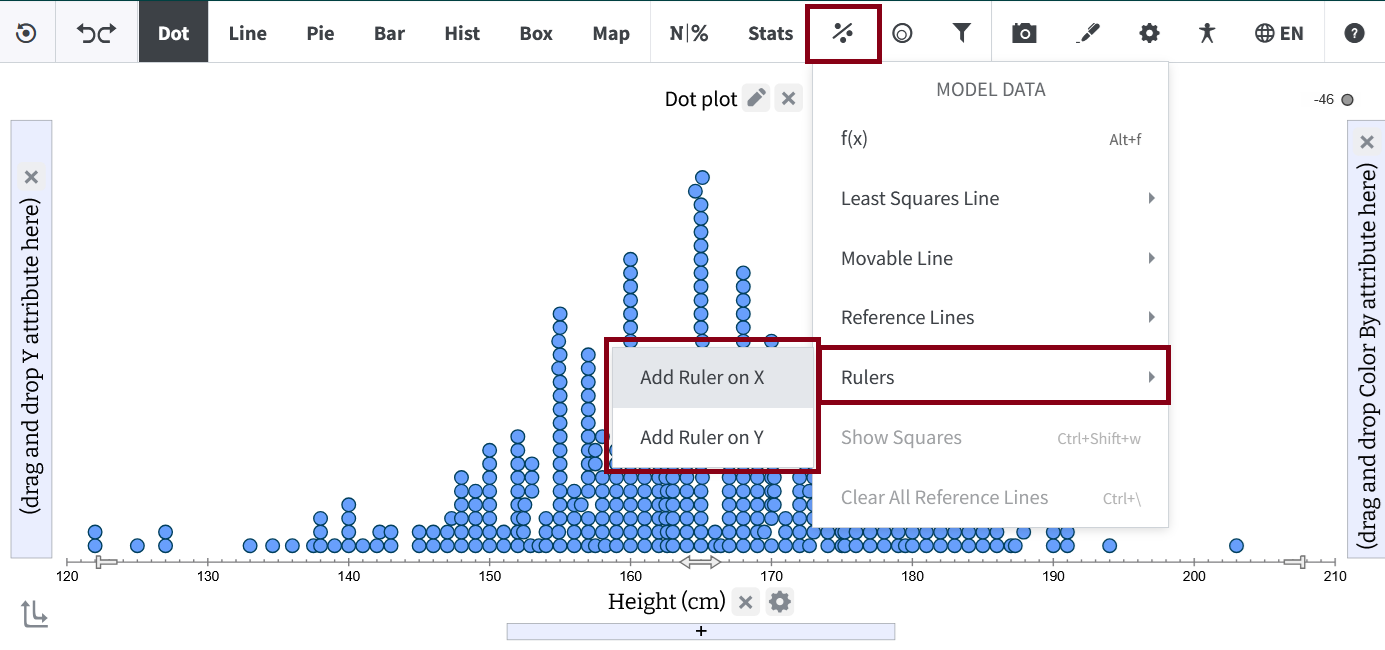
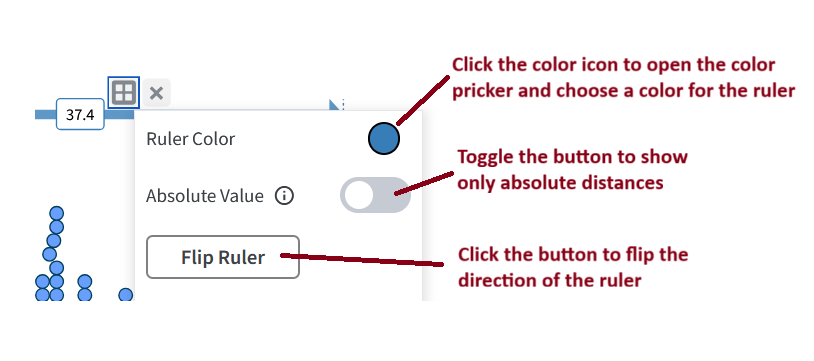
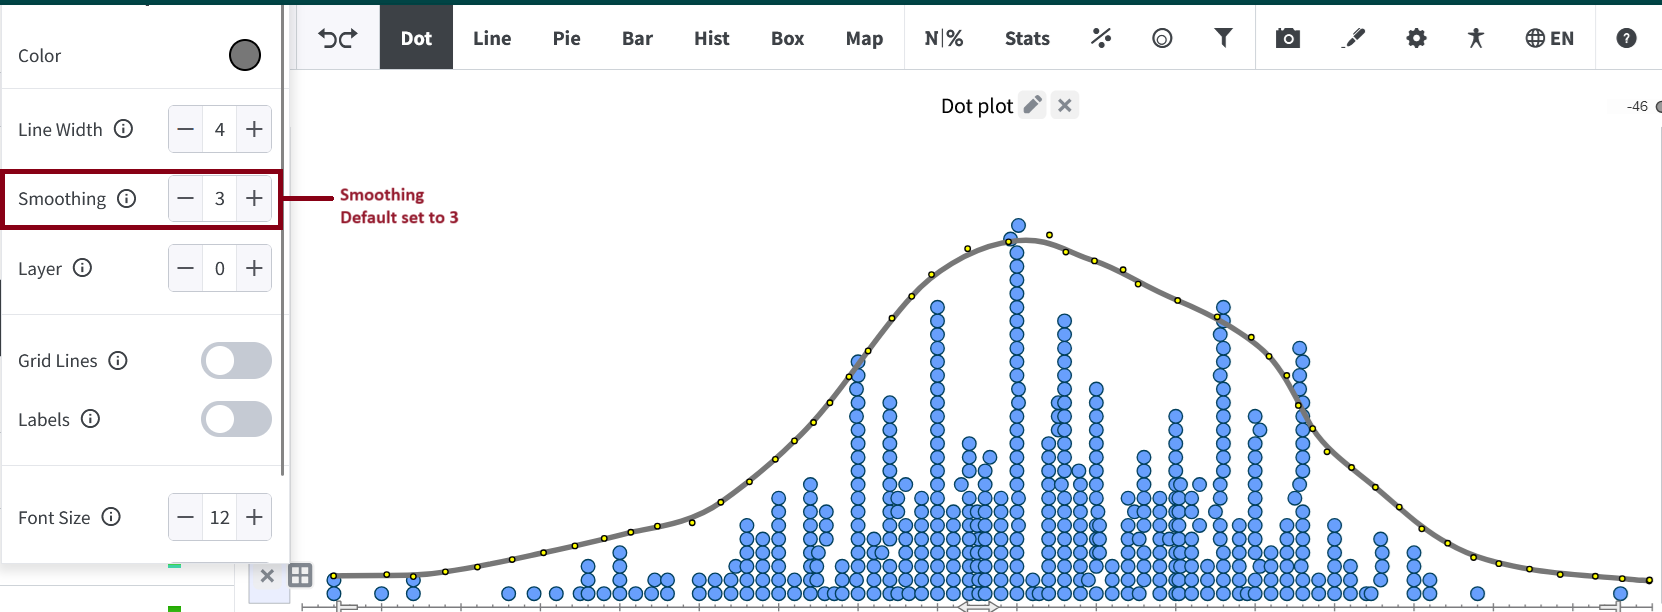
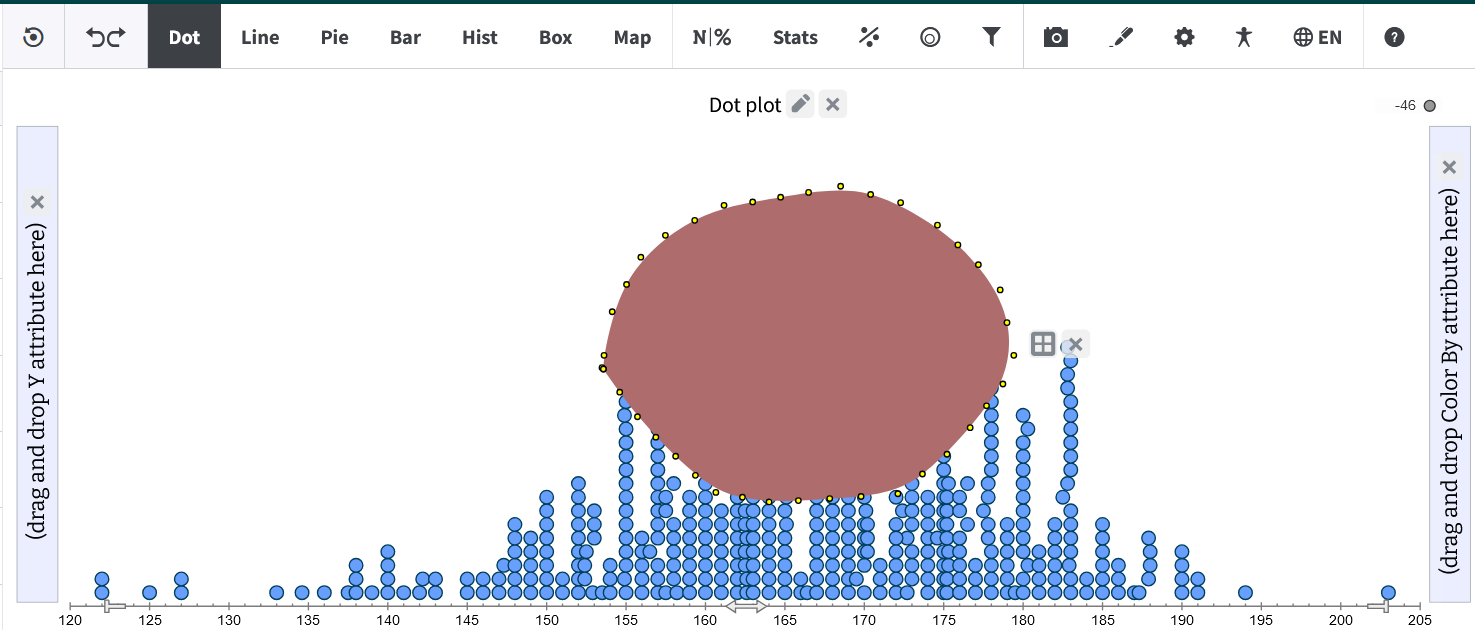
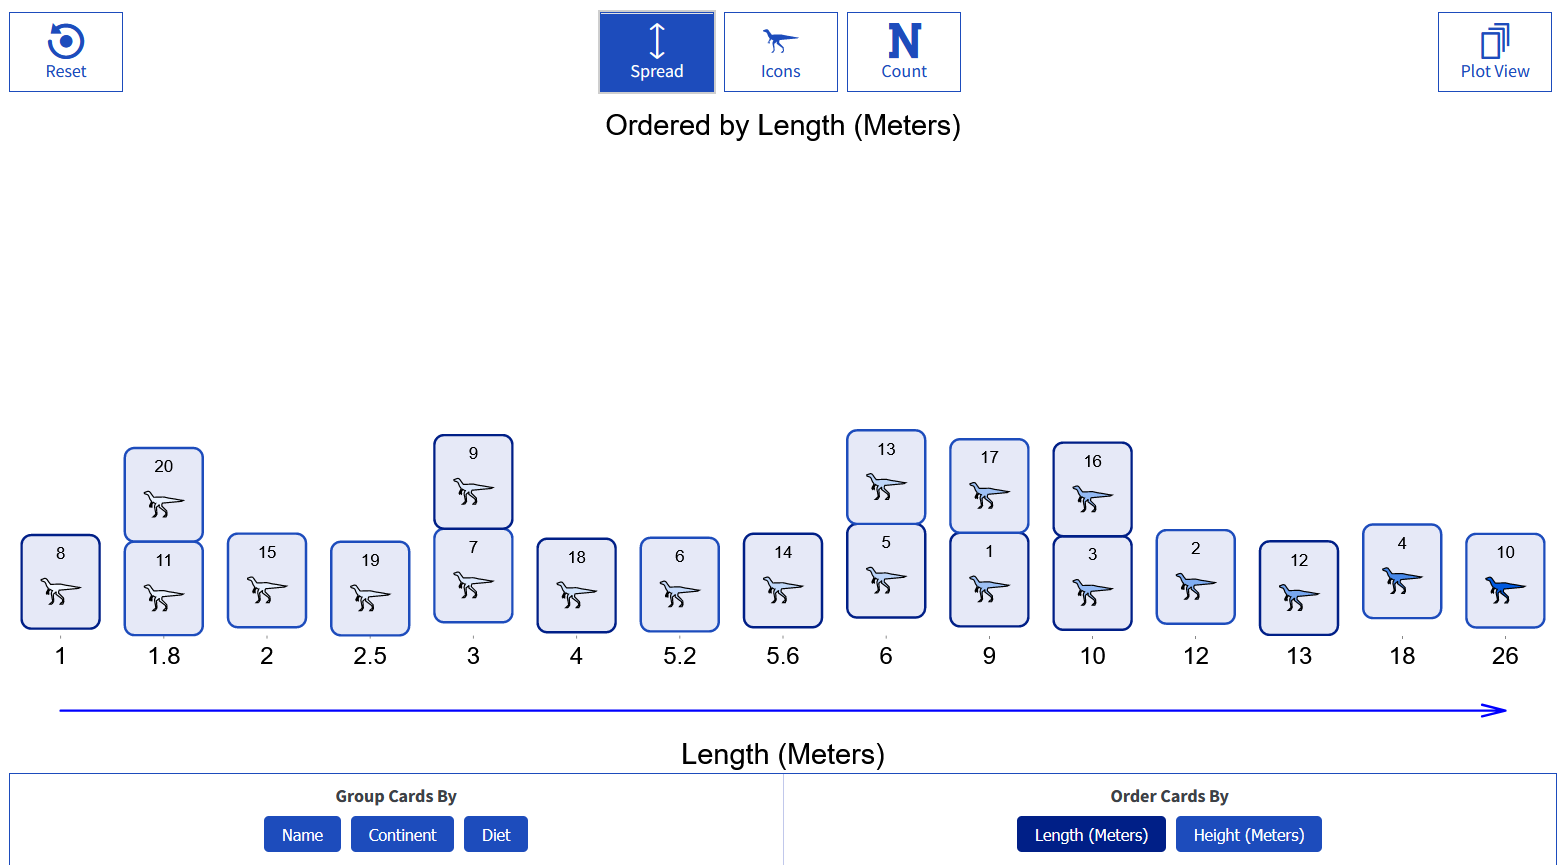
We have introduced the Ruler Tool, giving students a tangible way to interact with data on graphs. With this tool, learners can:
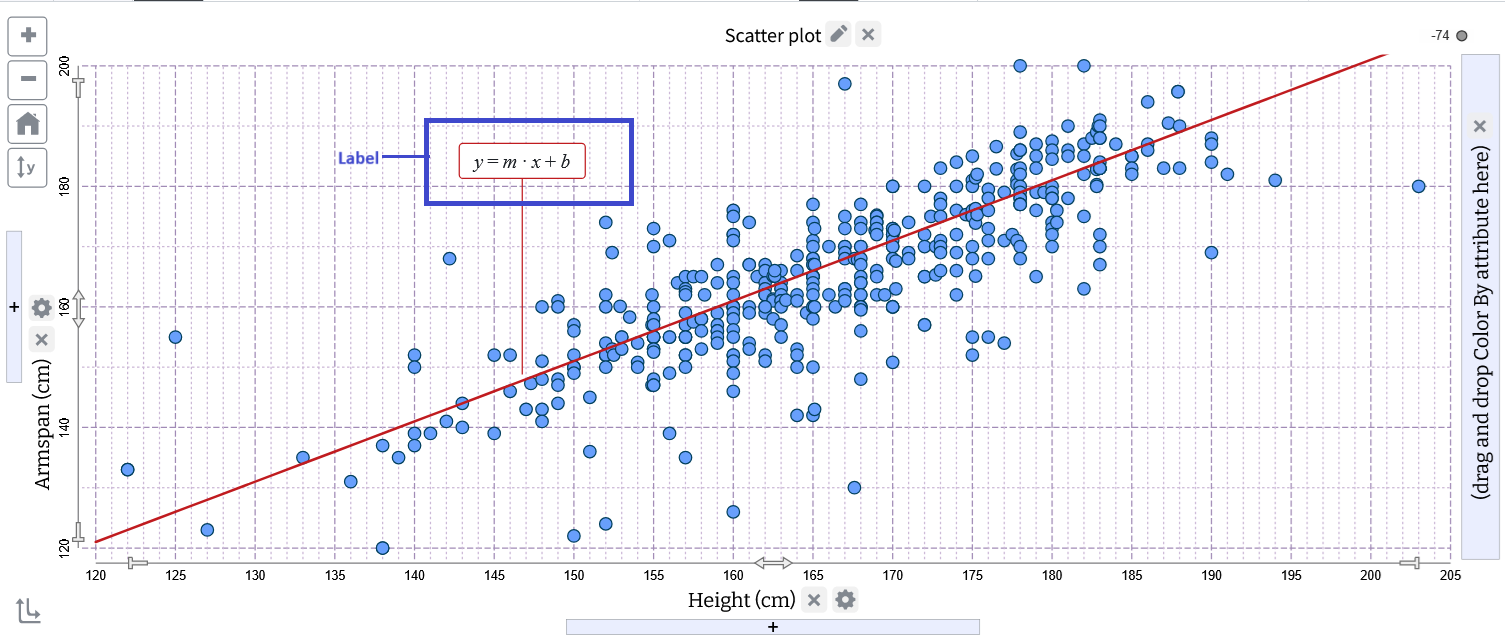
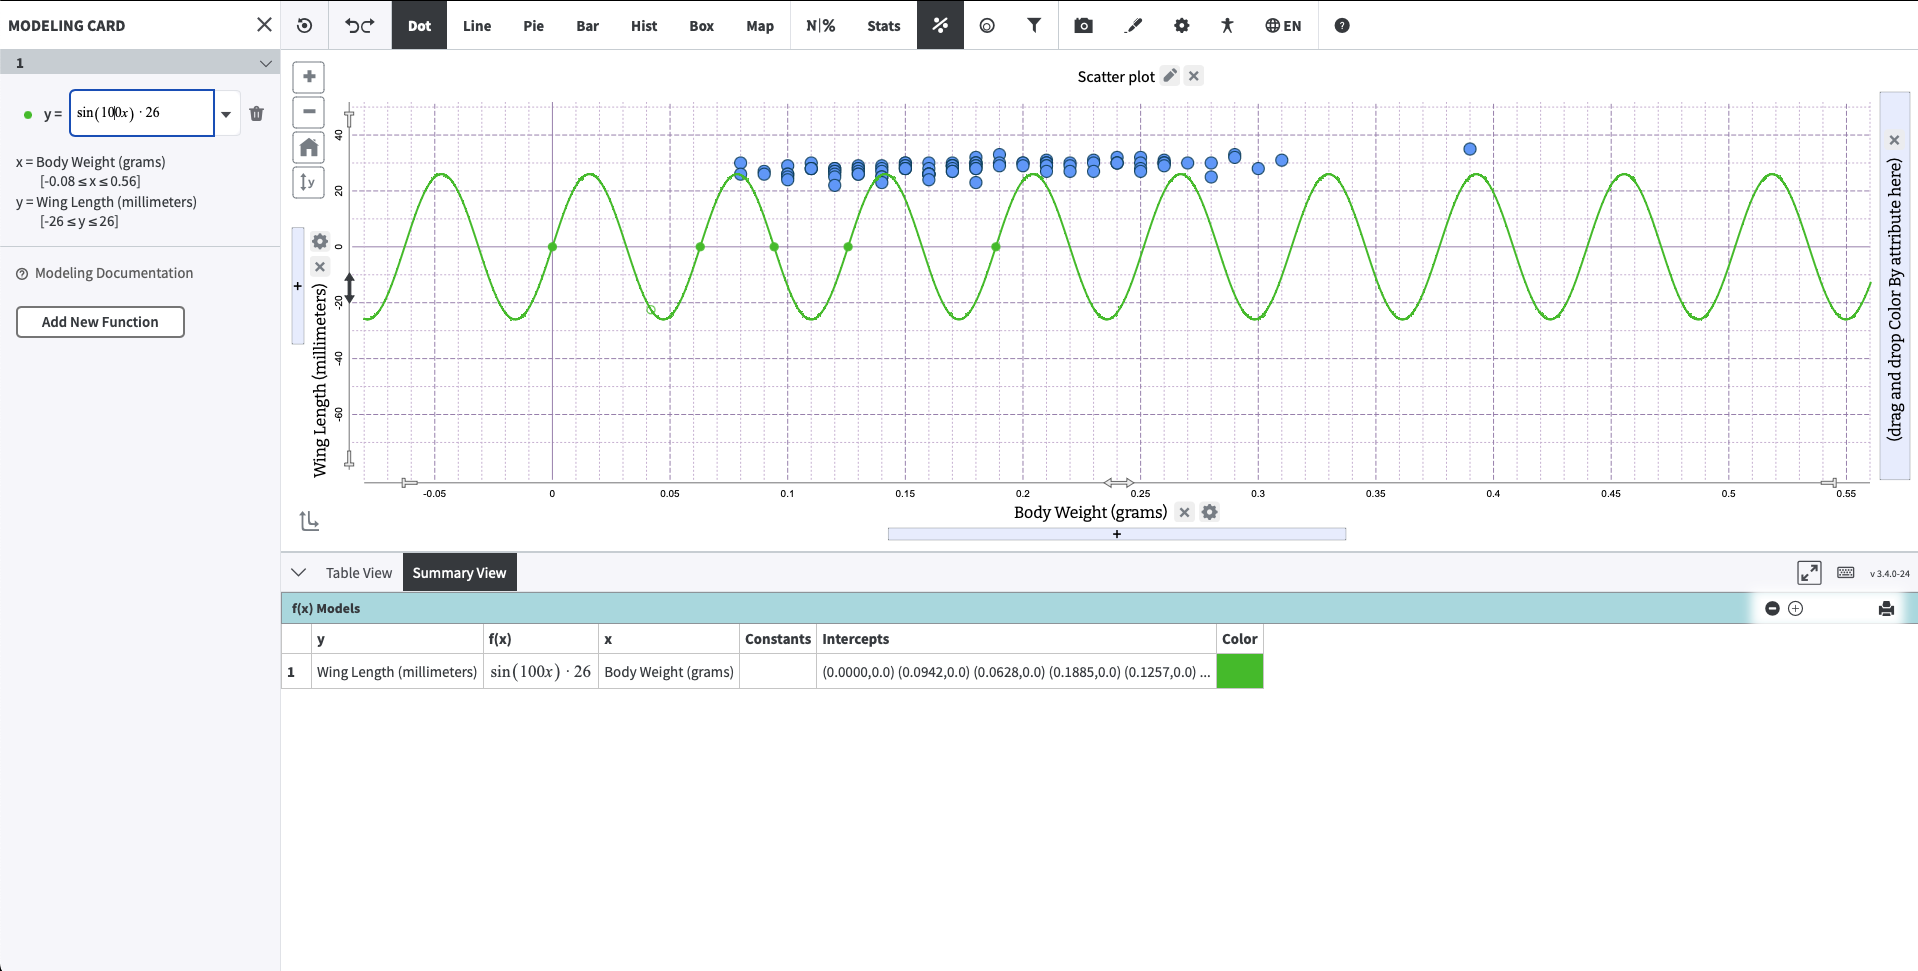
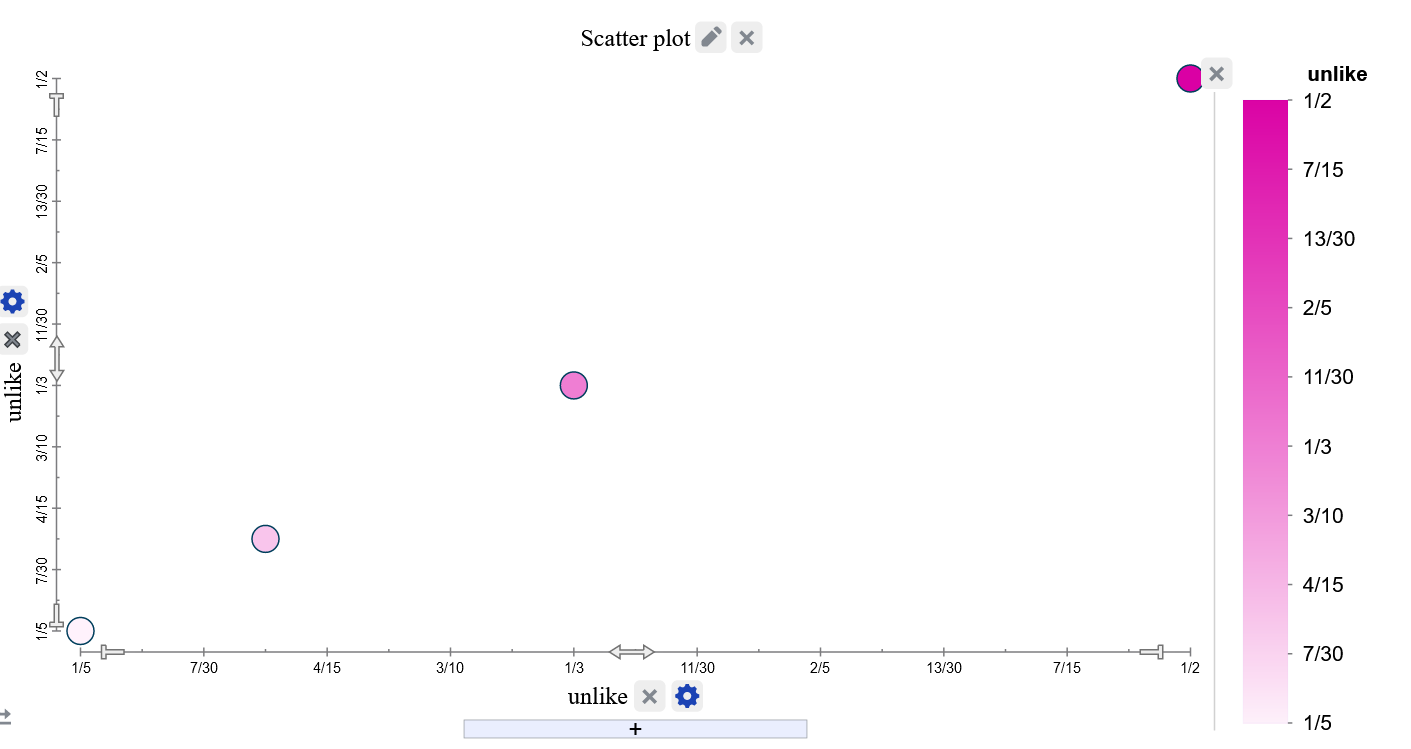
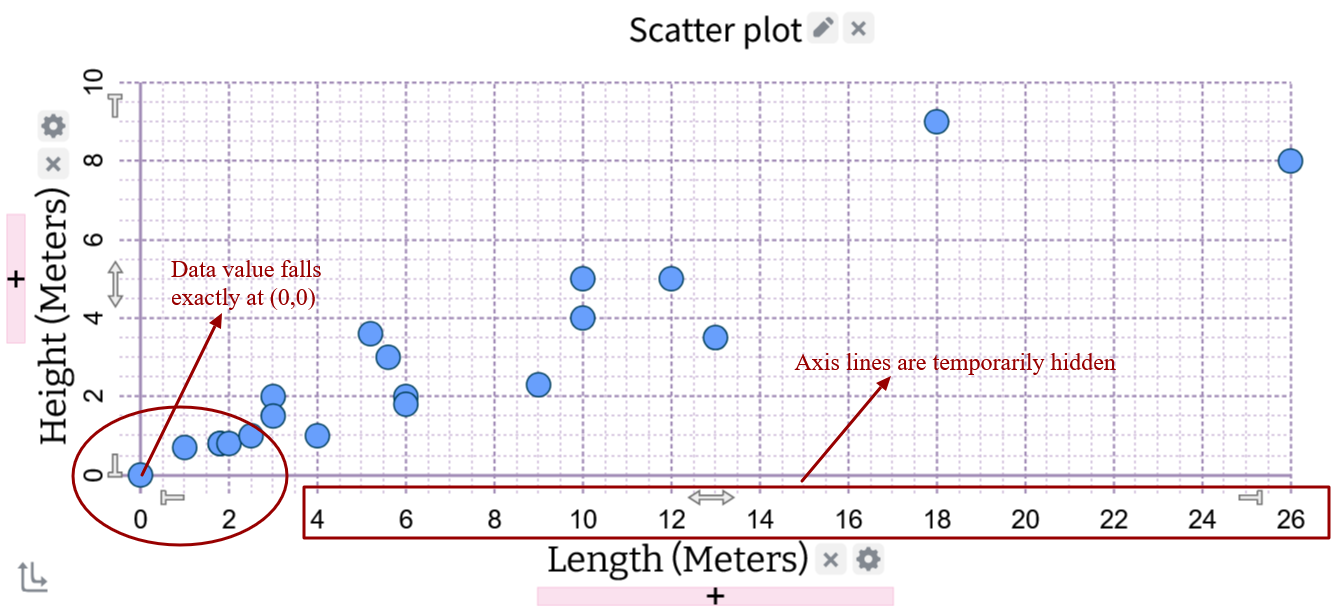
- The x- and y-axis lines now intersect at the origin, which aligns better with the conventional way students learn and interpret coordinate axes.
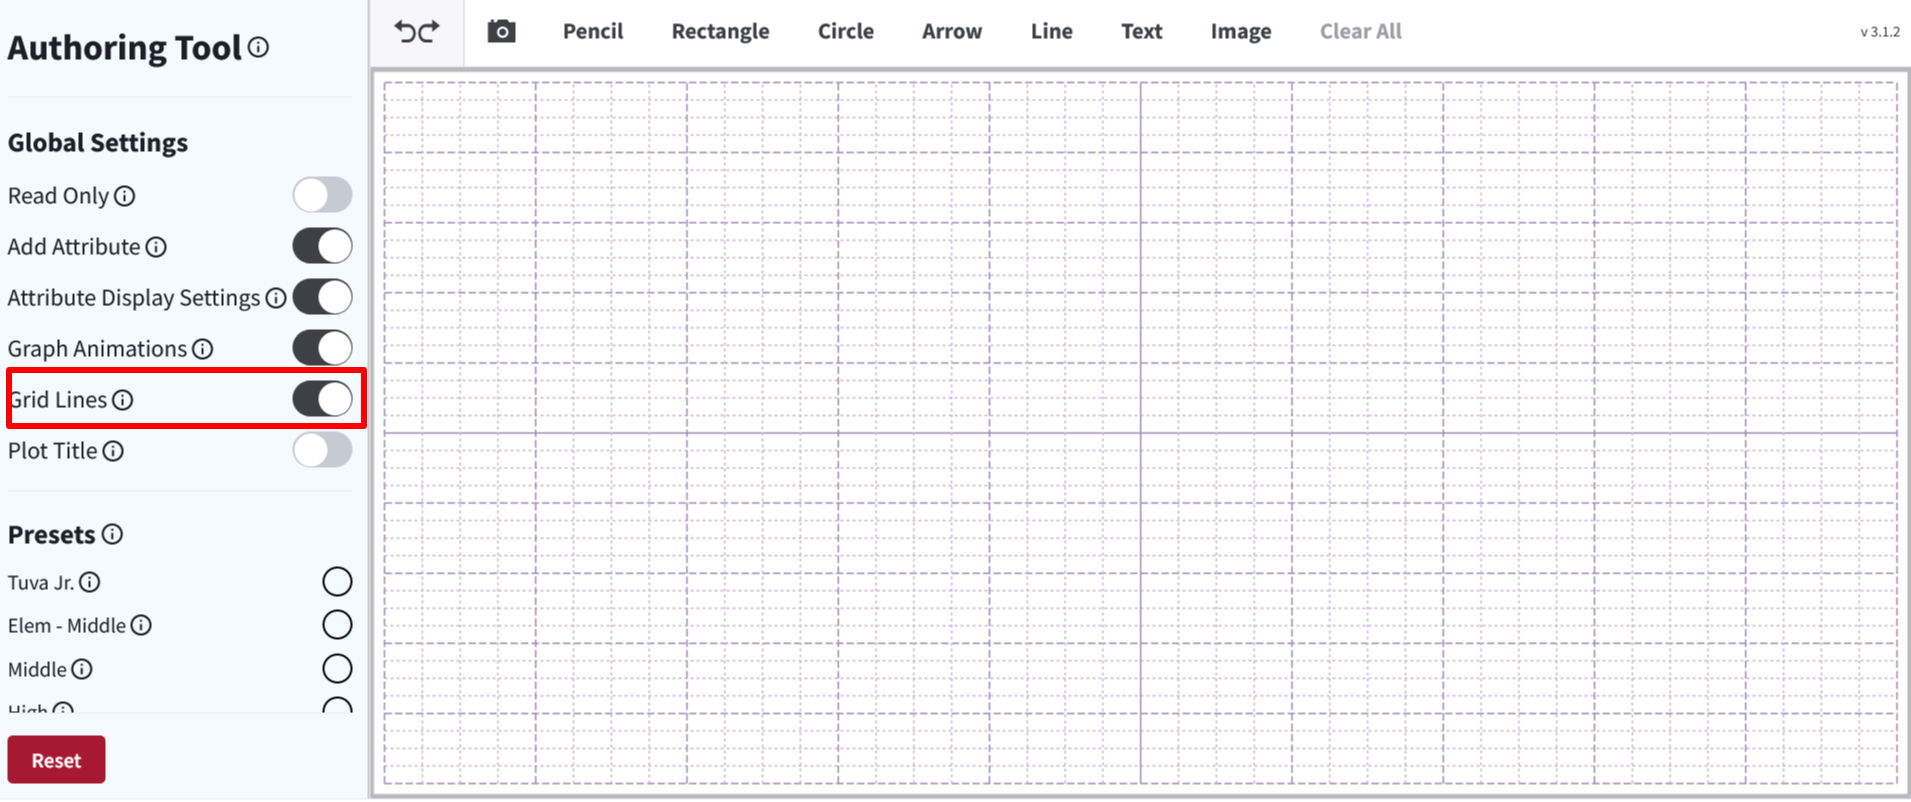
- When gridlines are enabled and a data value falls exactly at (0,0), the axis lines temporarily hide. This provides a cleaner and more intuitive reference point for visualizing values near zero, ensuring the gridlines remain clearly visible.

-
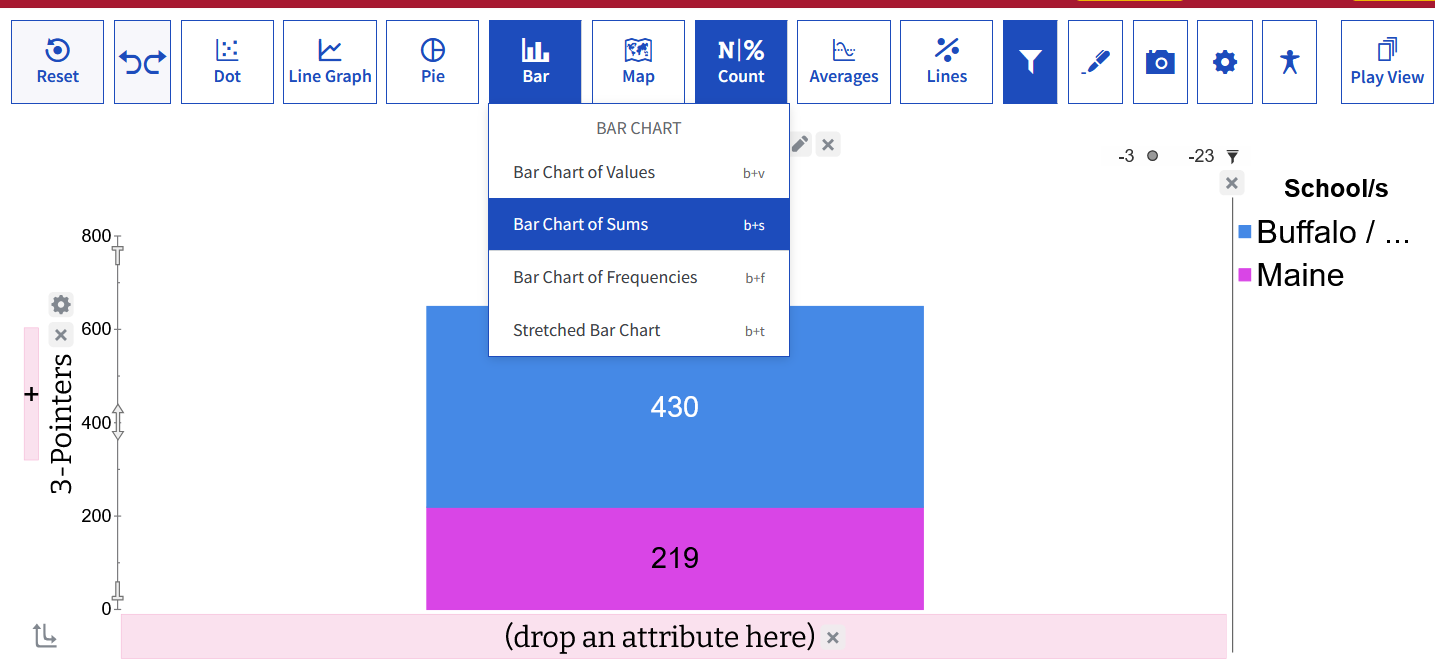
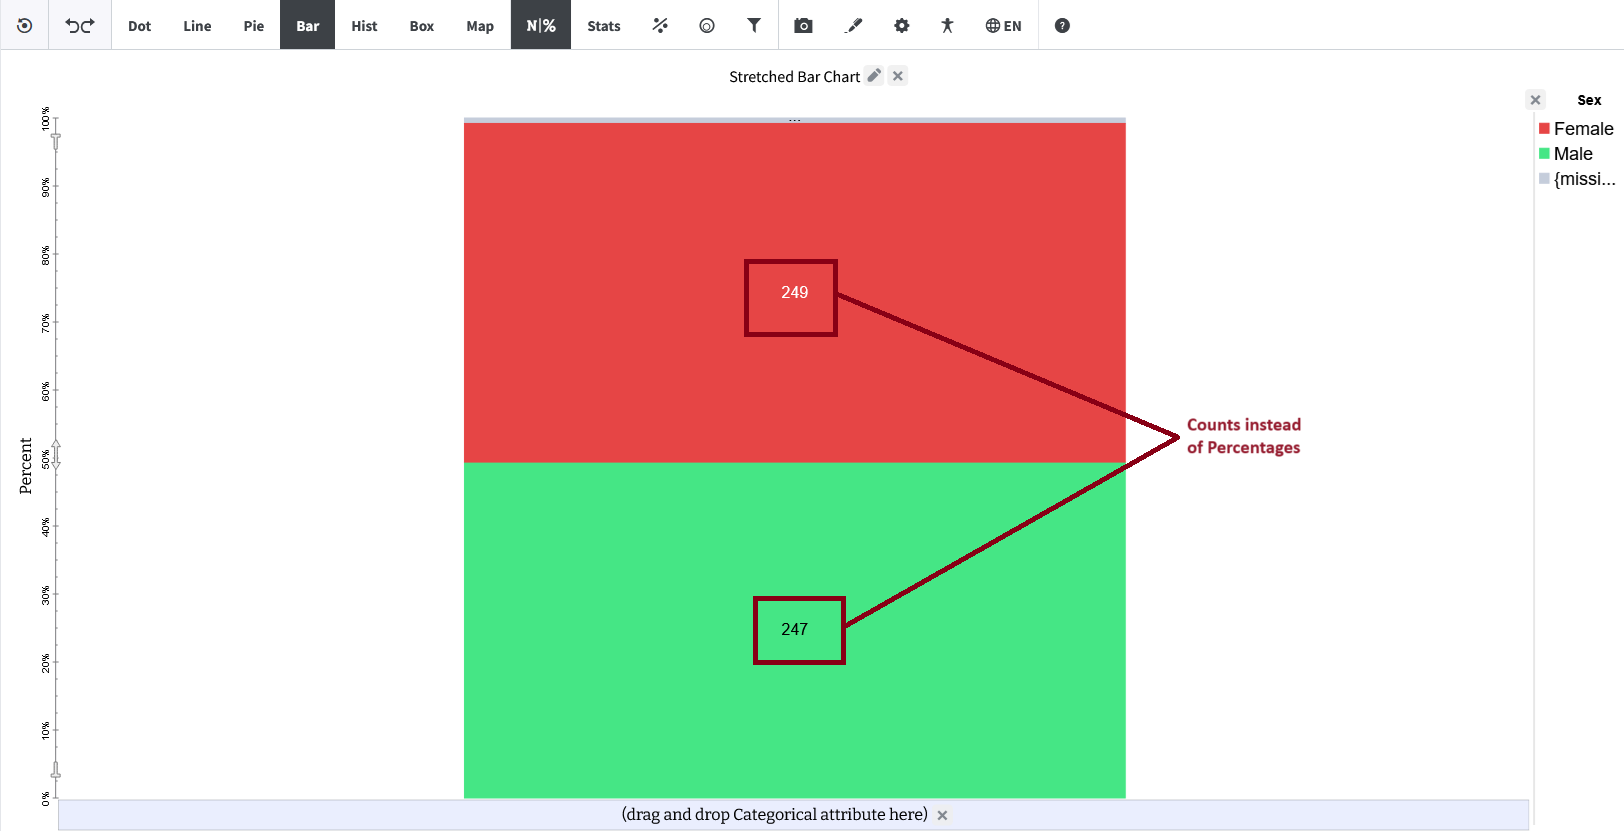
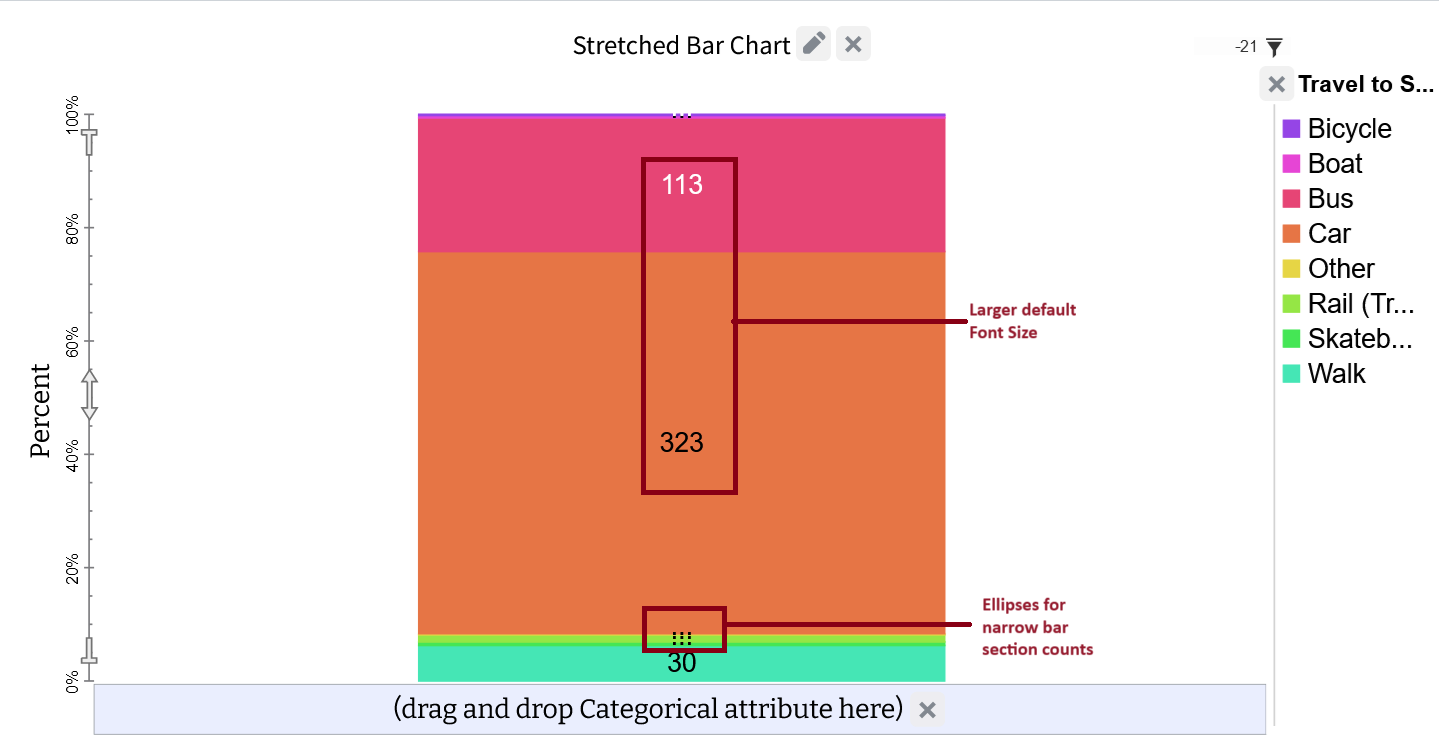
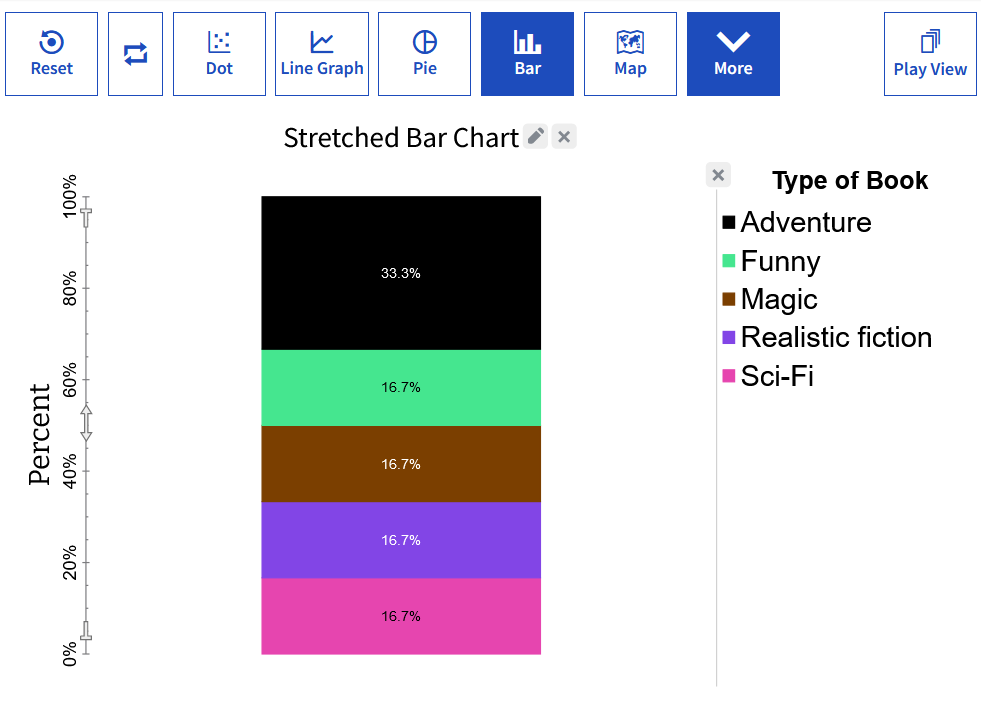
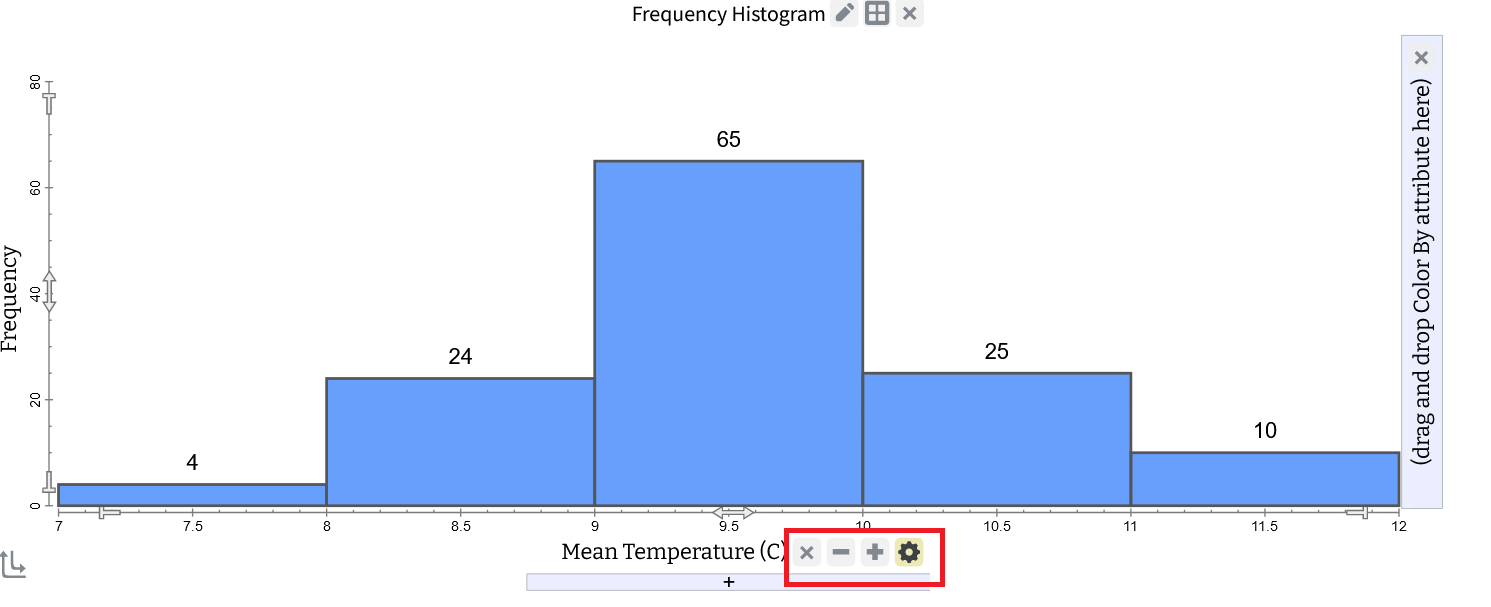
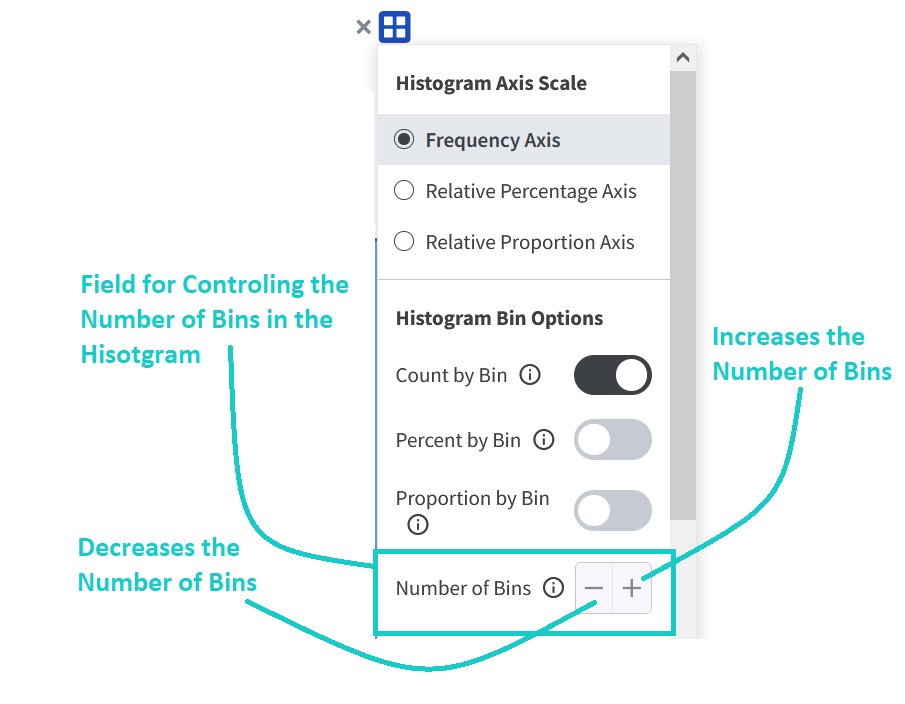
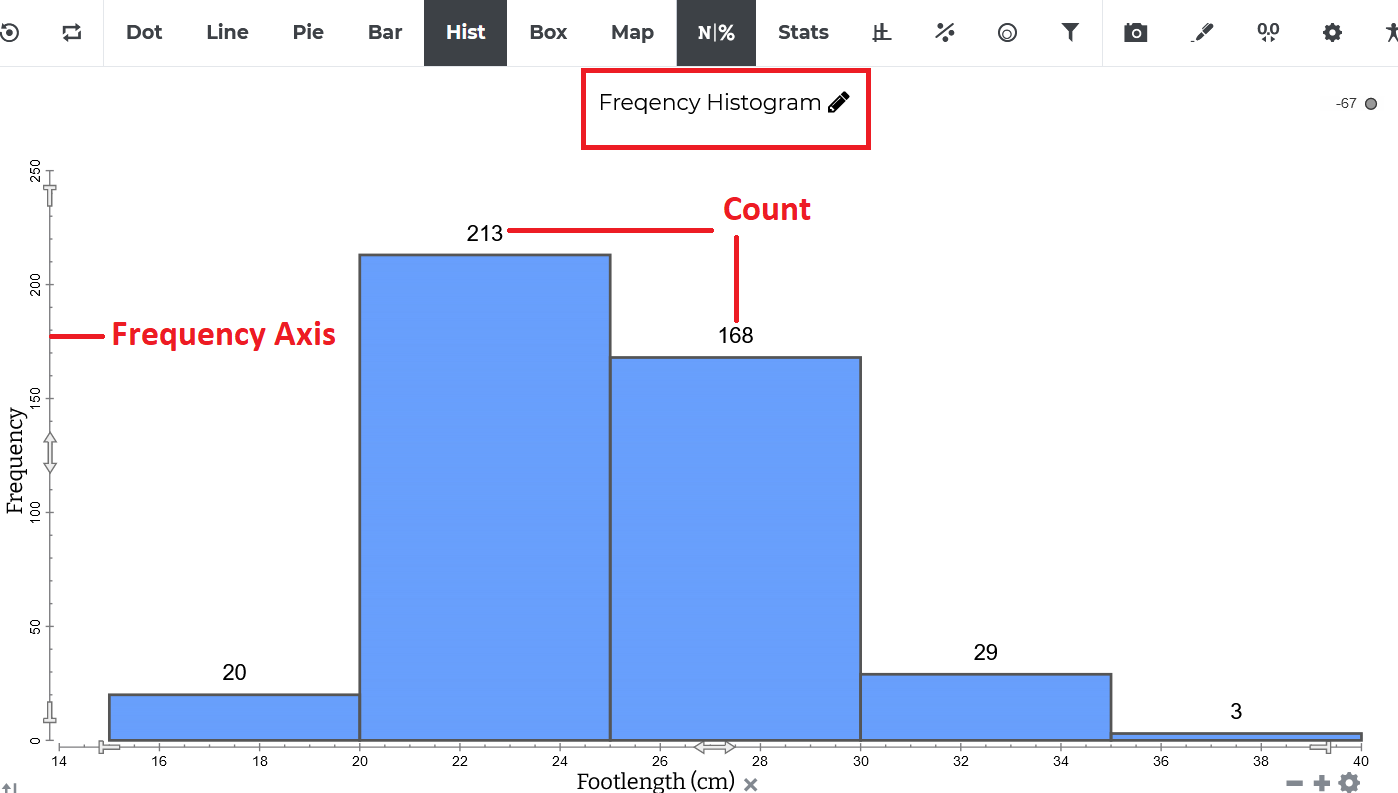
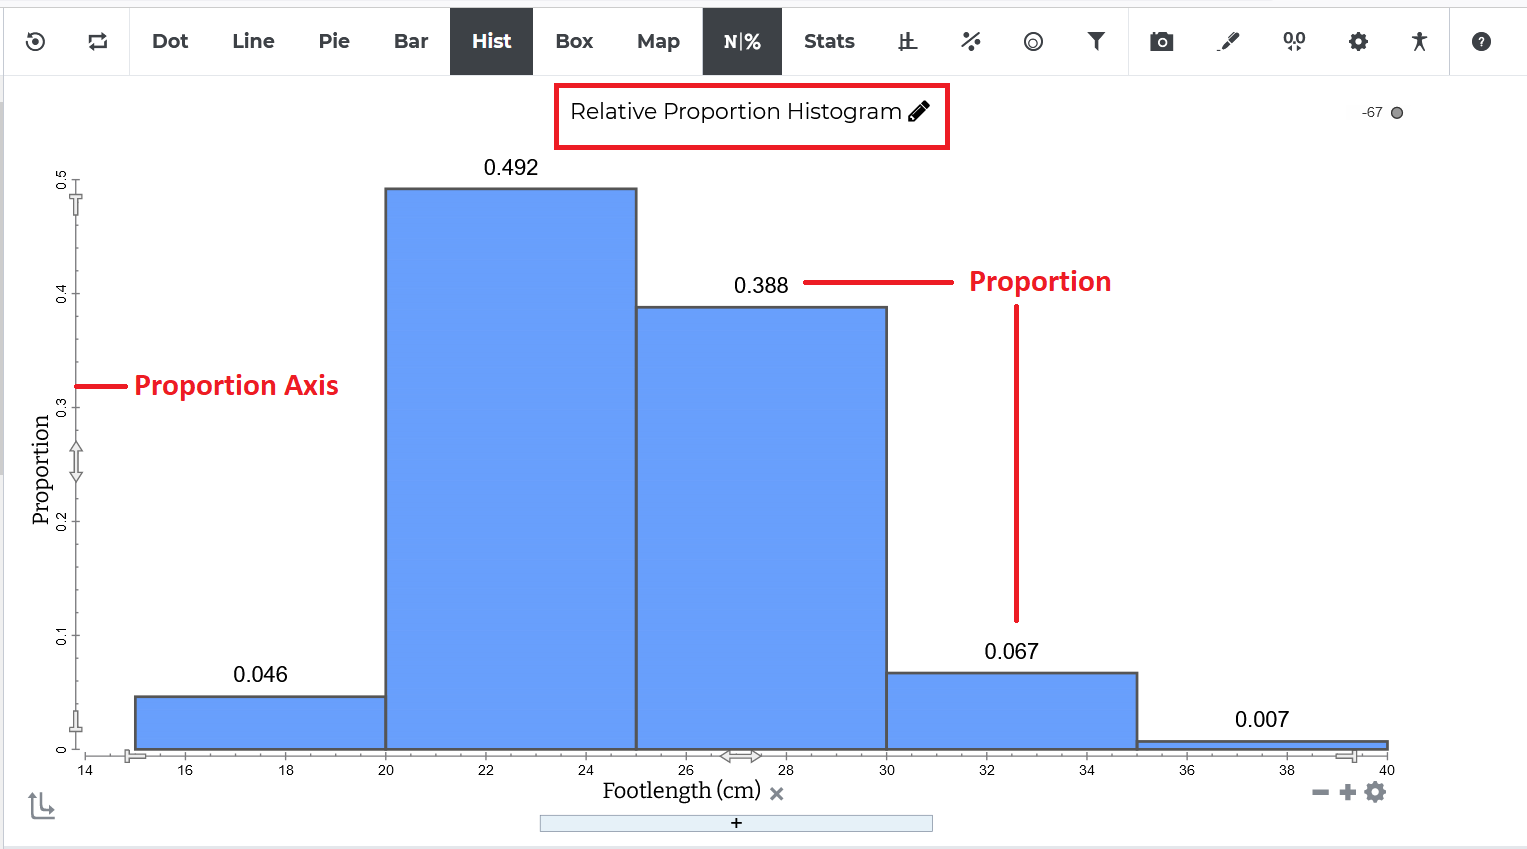
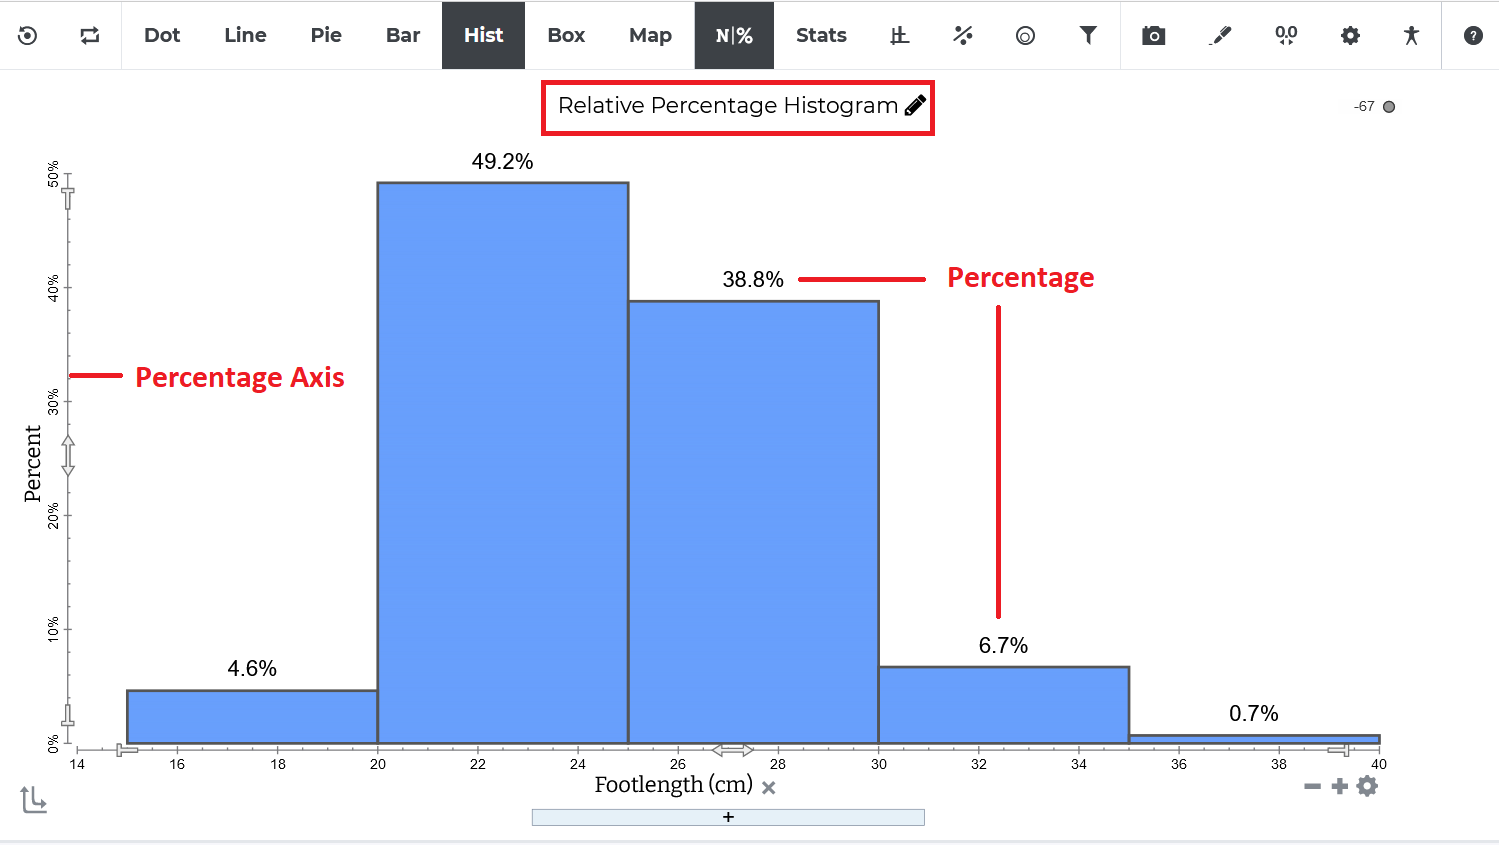
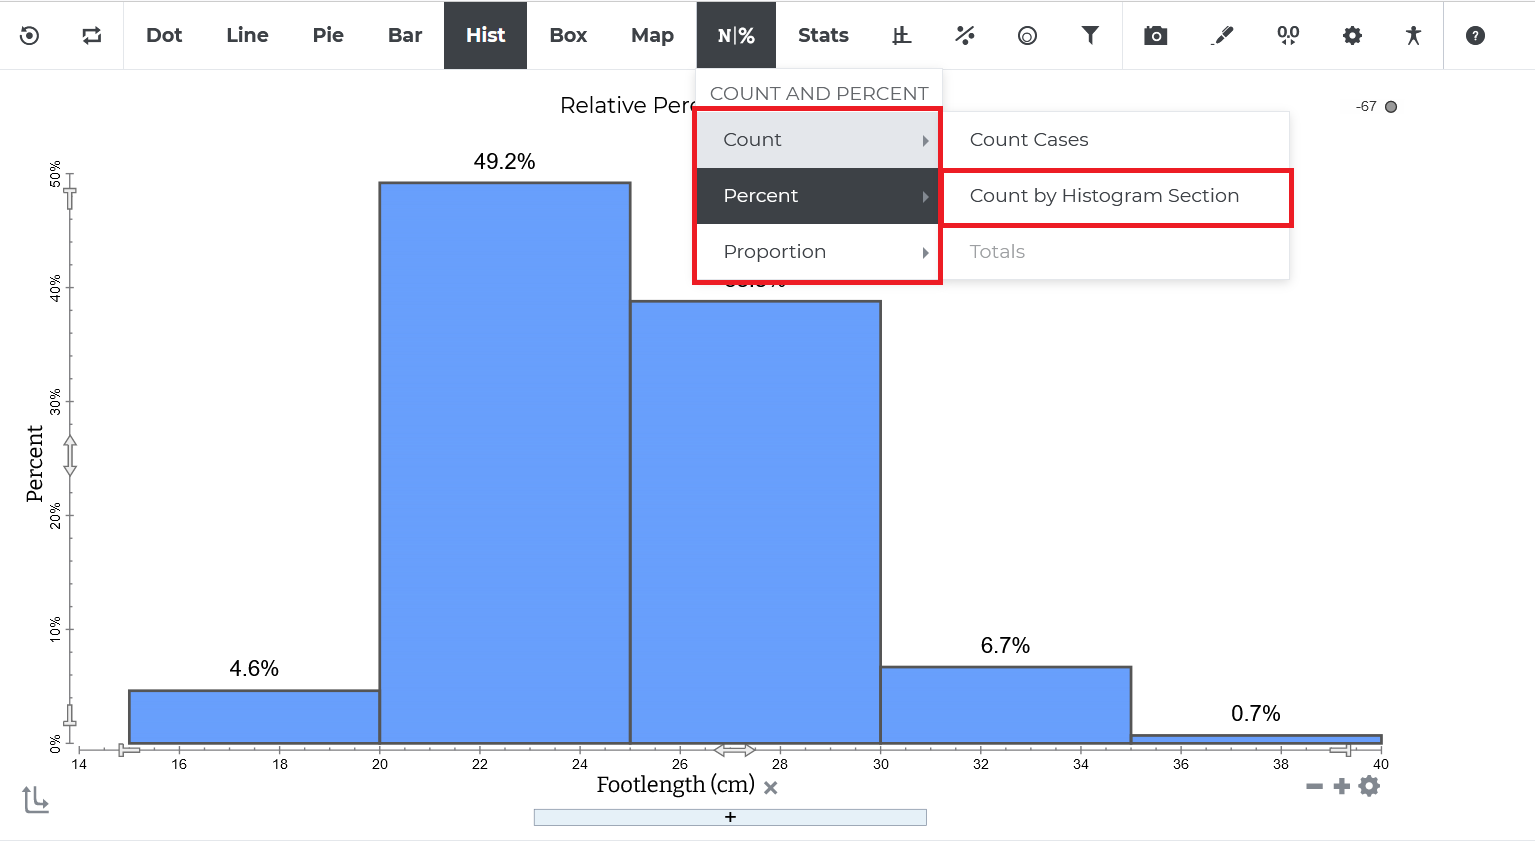
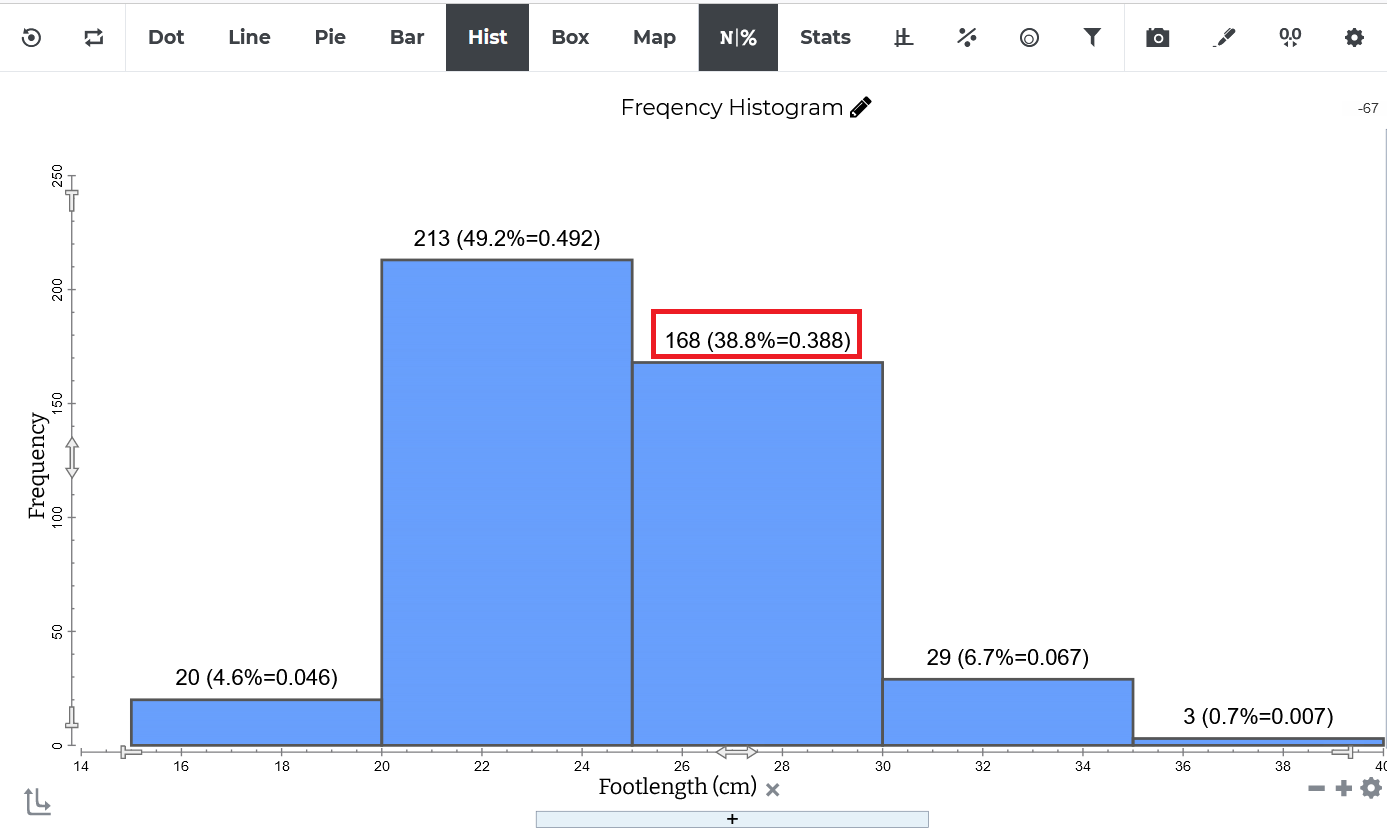
Enhancements to Bar Charts:
We have made the following changes to the existing Bar Charts to provide the user with greater flexibility:
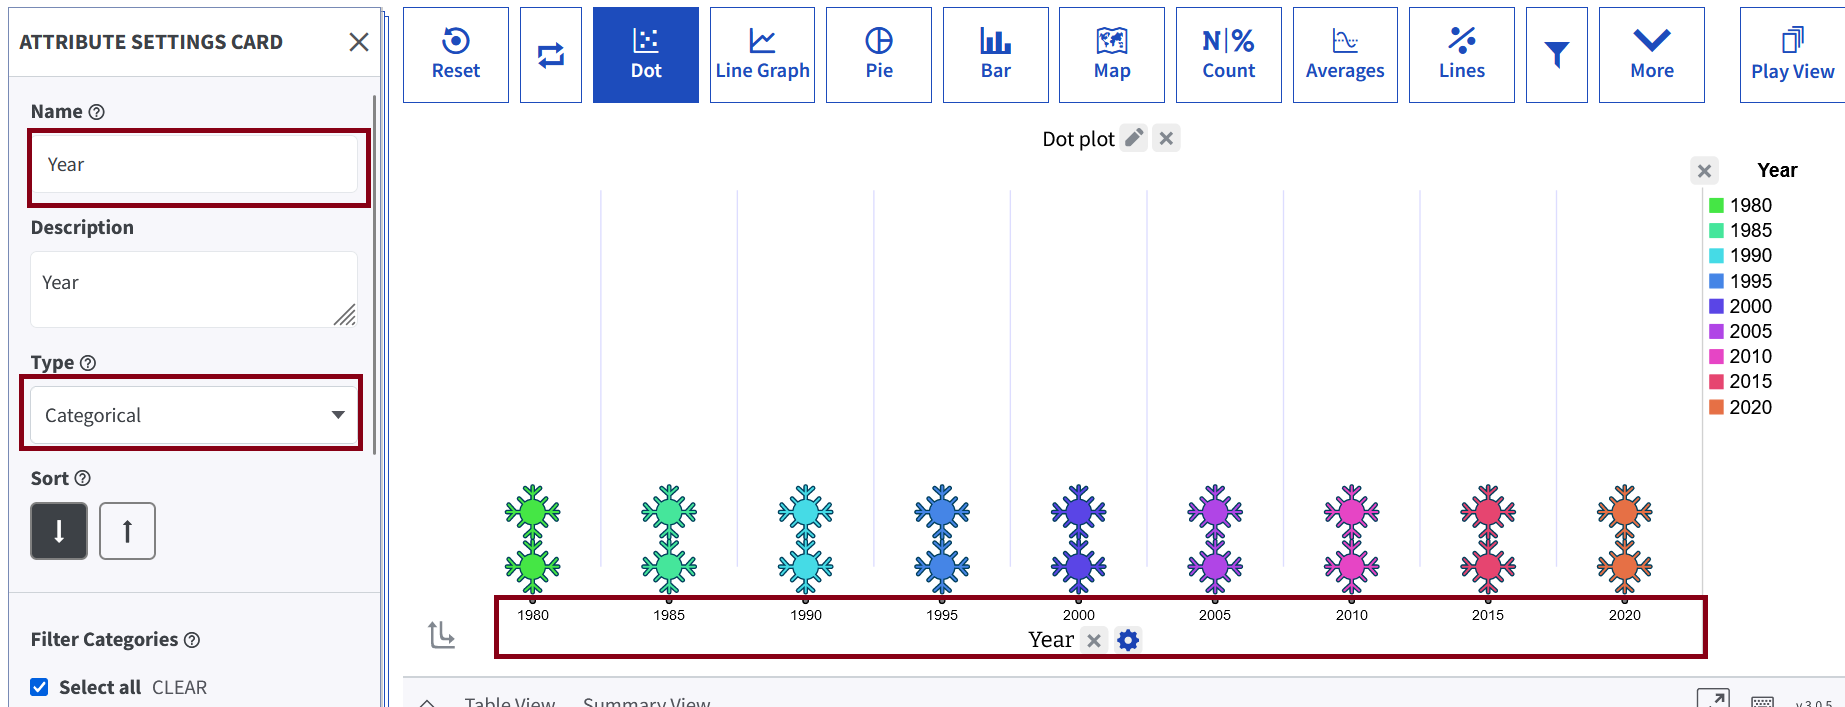
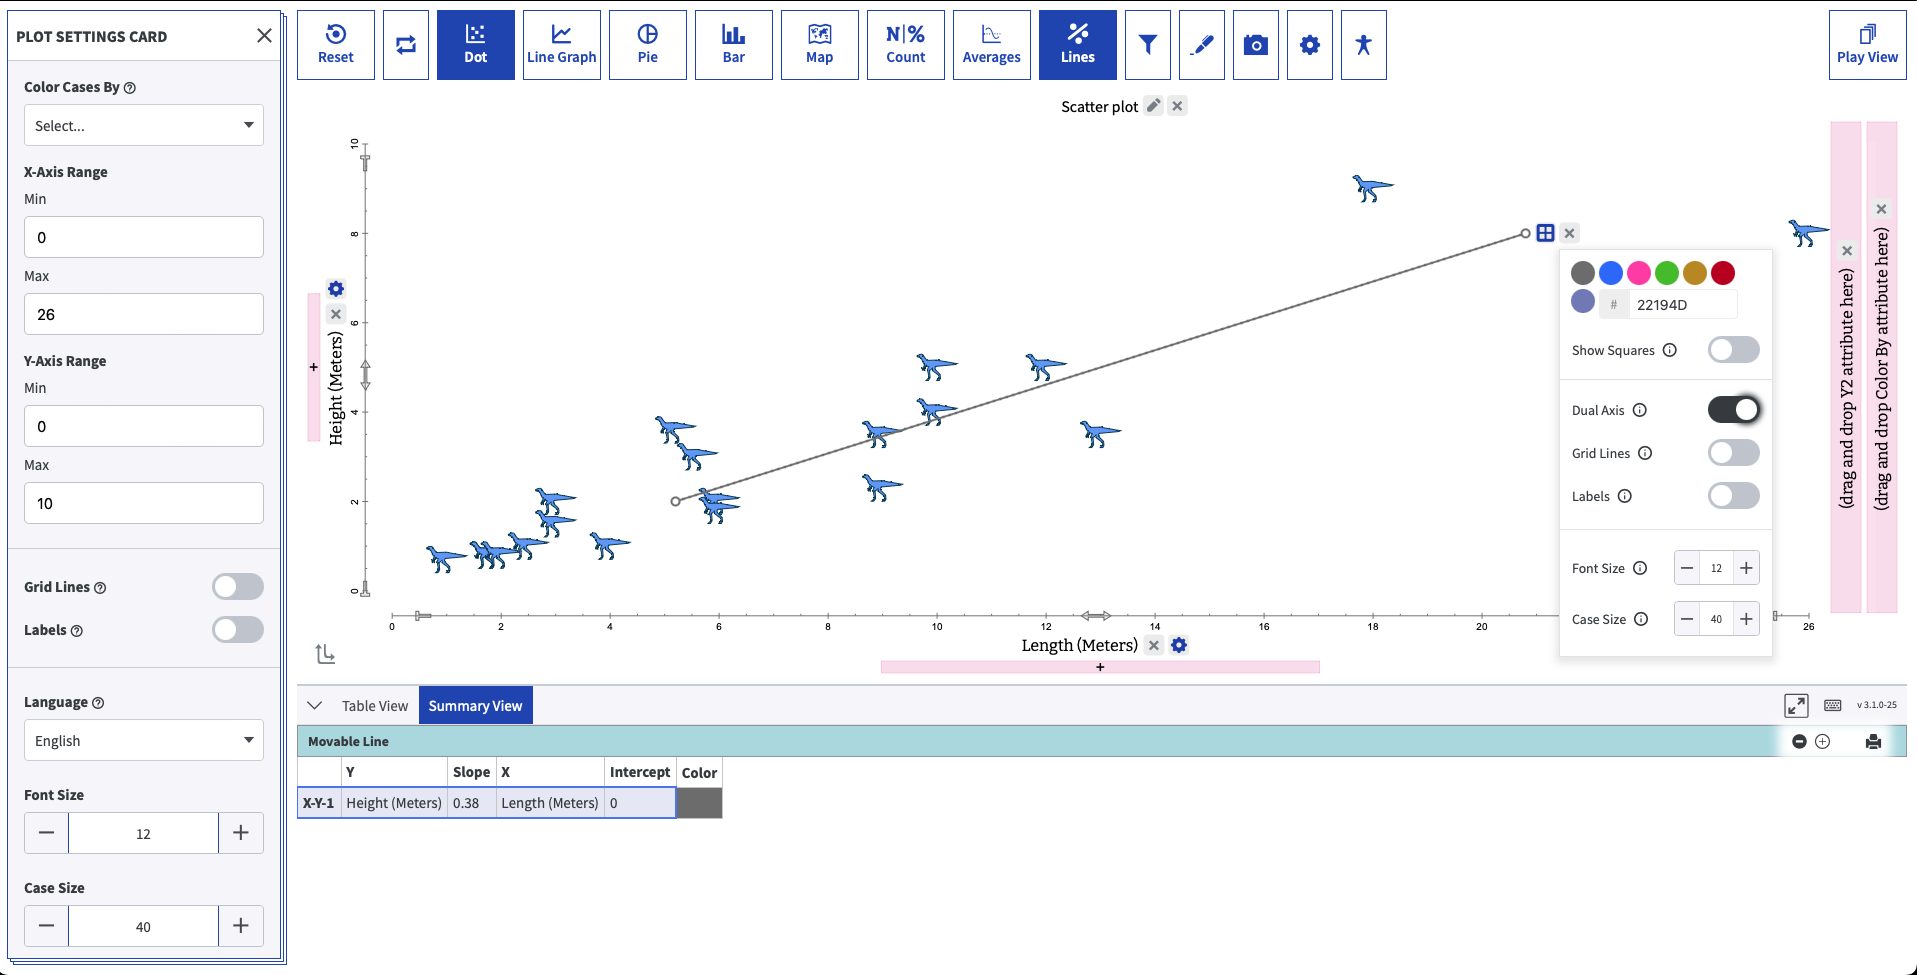
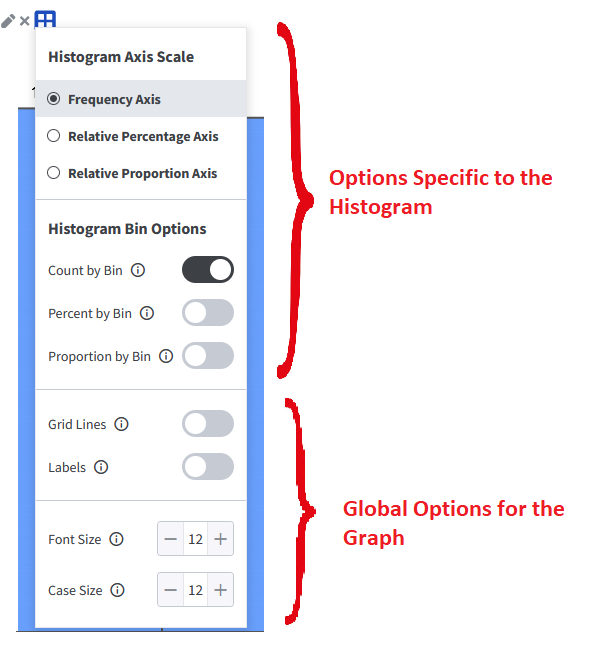
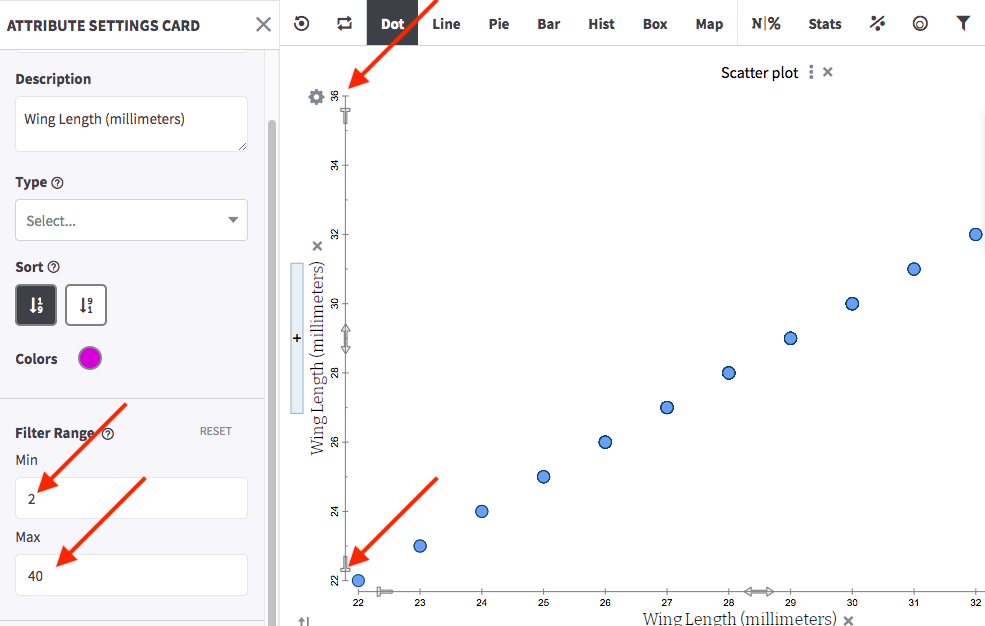
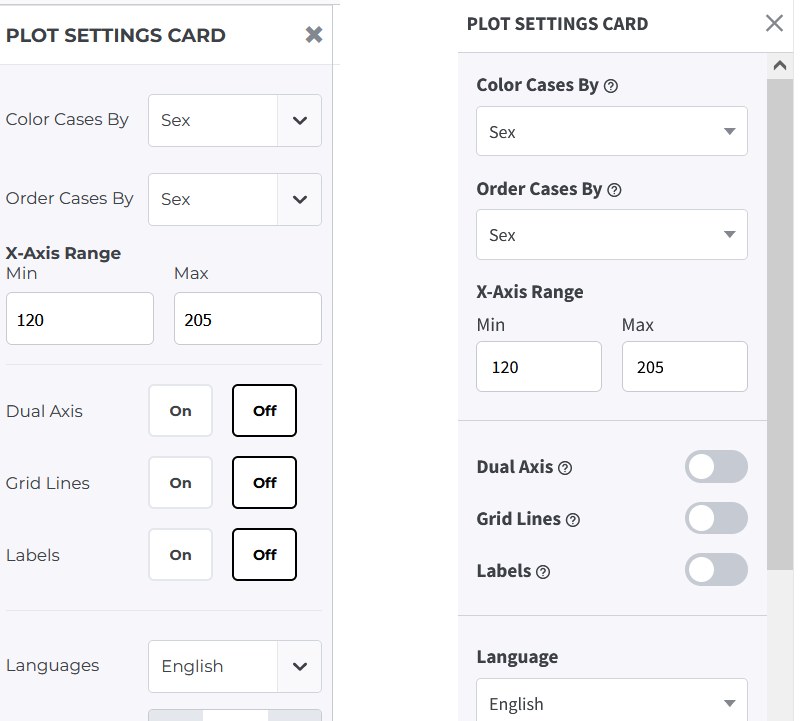
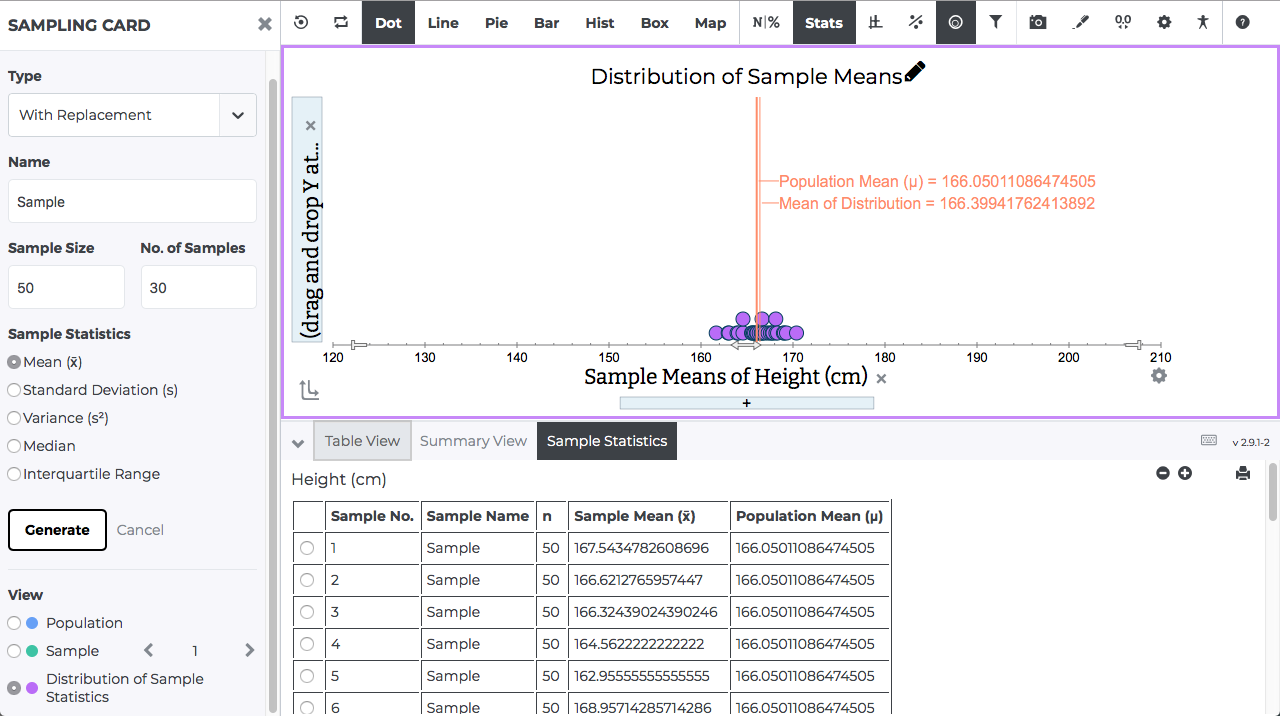
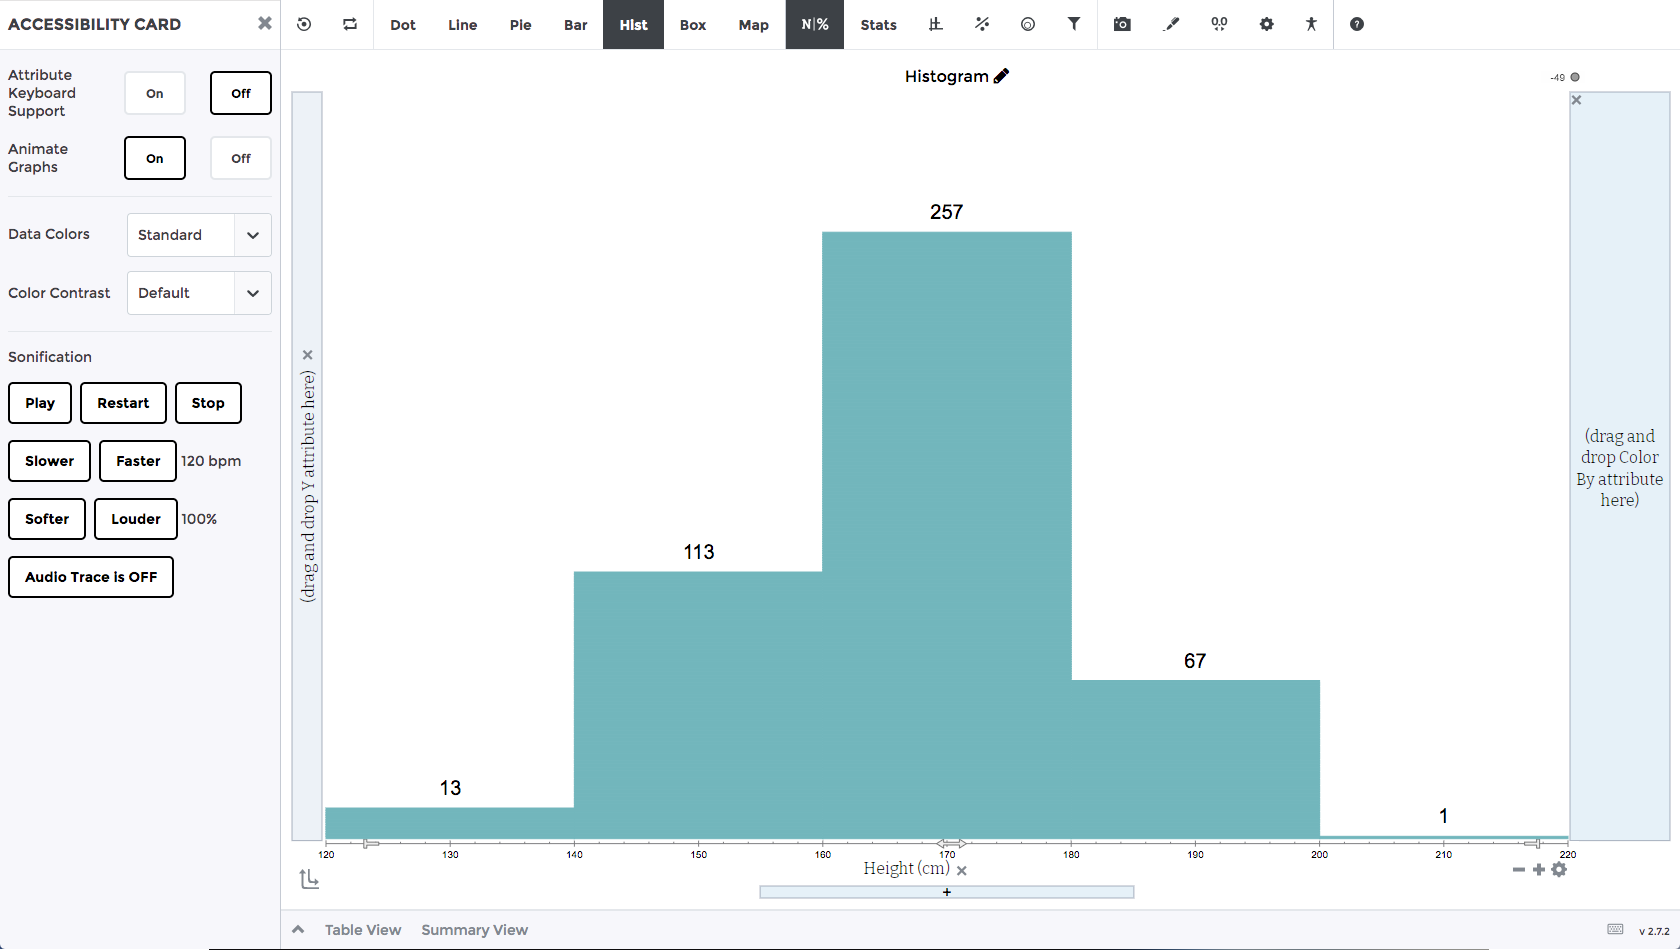
- Display the Plot Settings Card for the Frequency axis across all bar chart types, allowing users to set the axis range directly. In addition, introduce draggable handles, similar to those on the regular axes, so users can adjust the scale of the Frequency axis visually and interactively.
- Authors can now save and restore any custom axis range adjustments made to the Frequency axis.
-
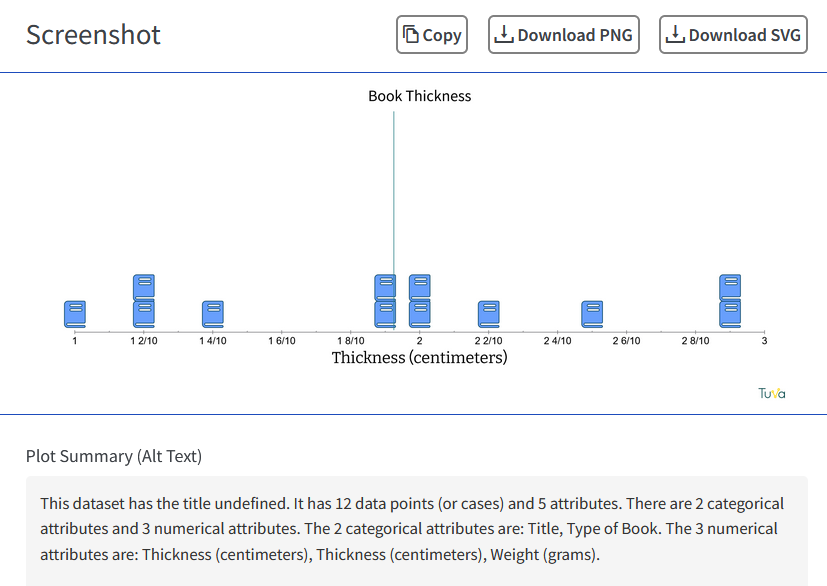
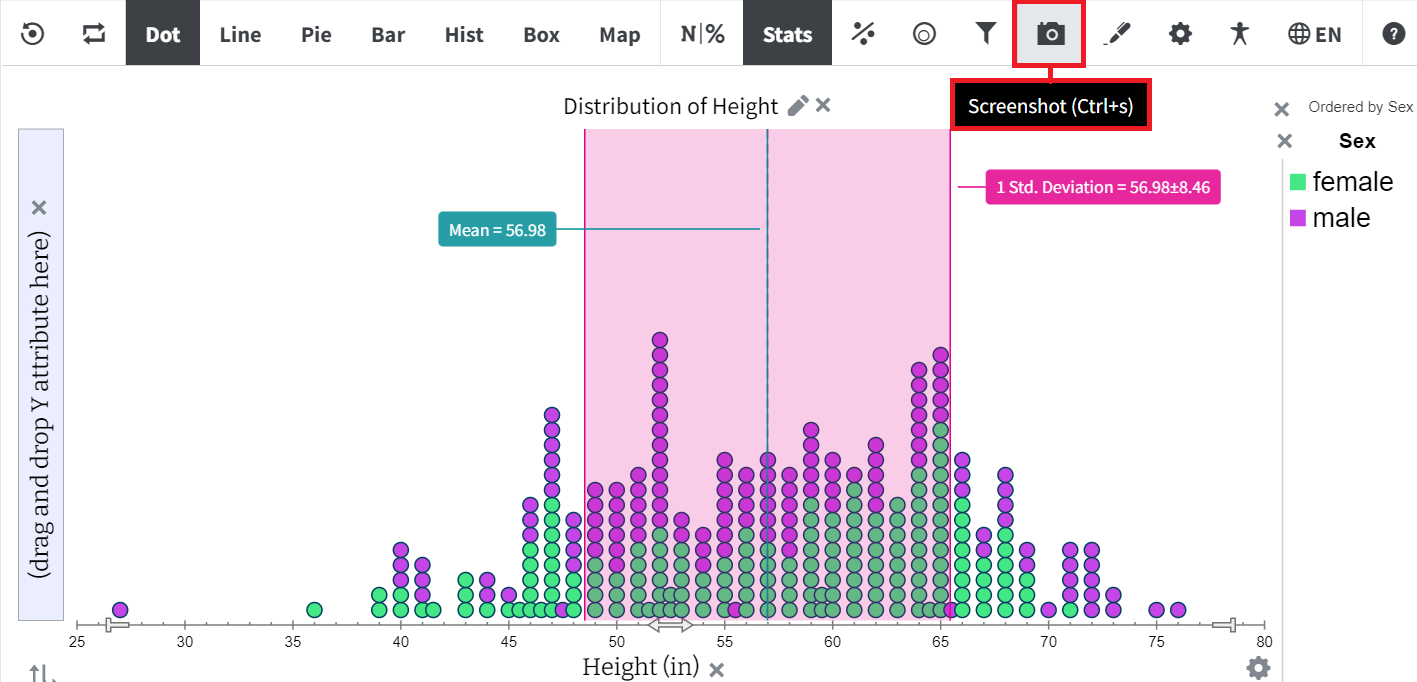
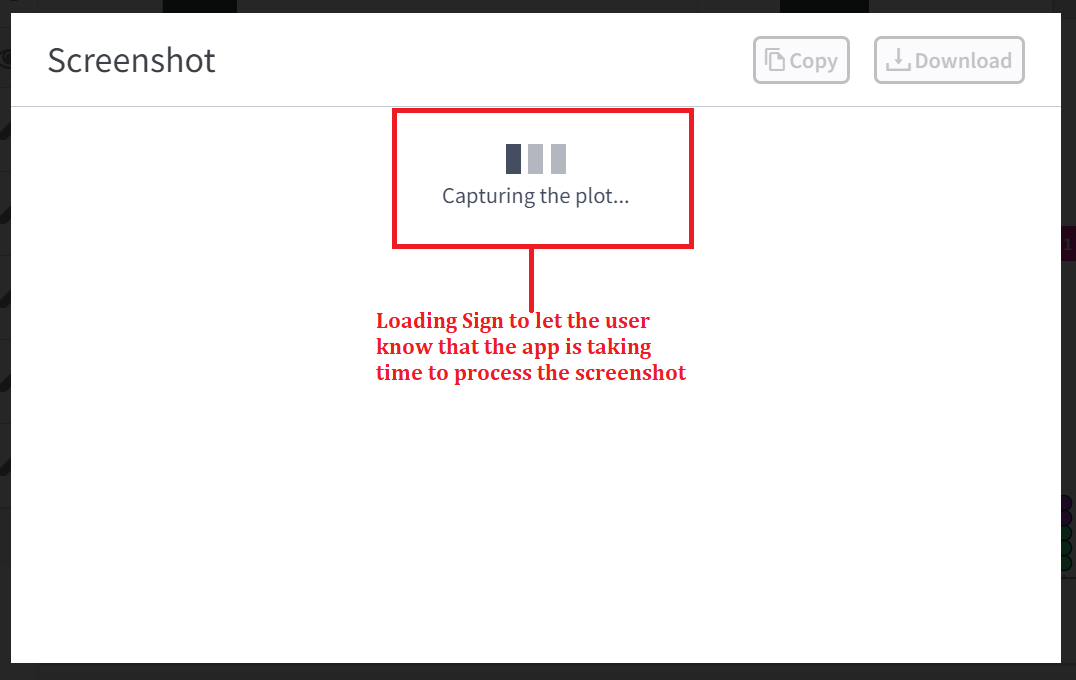
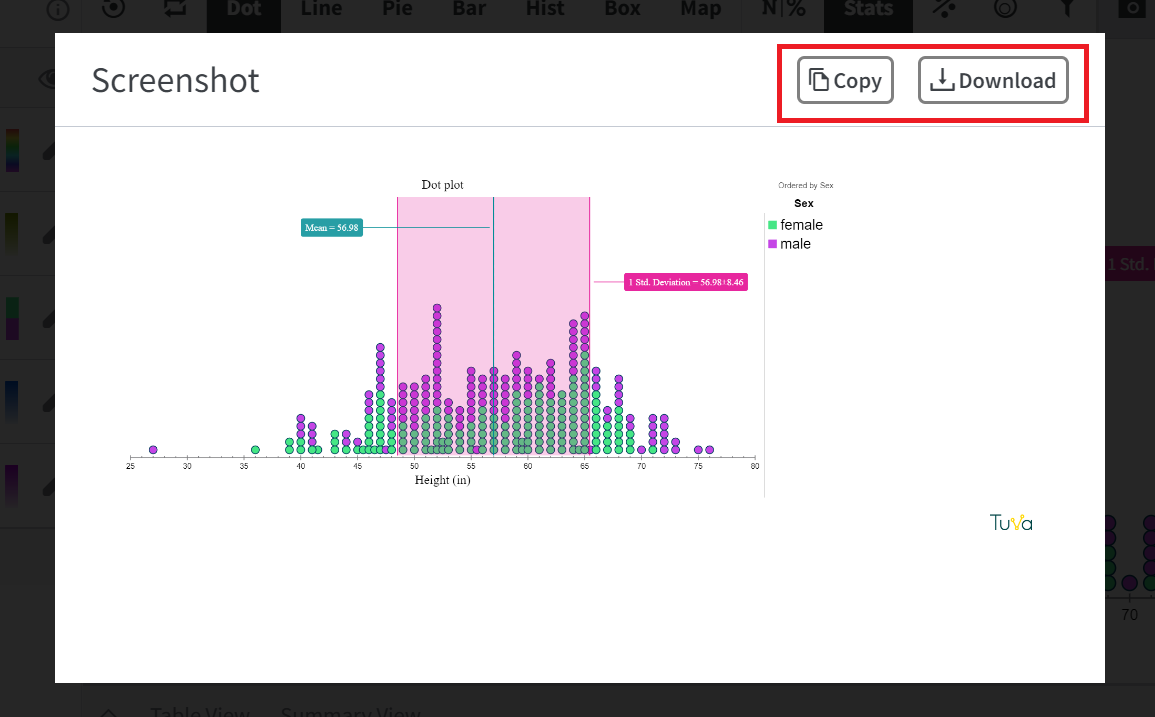
Enhancements to the Screenshot Pop-up:
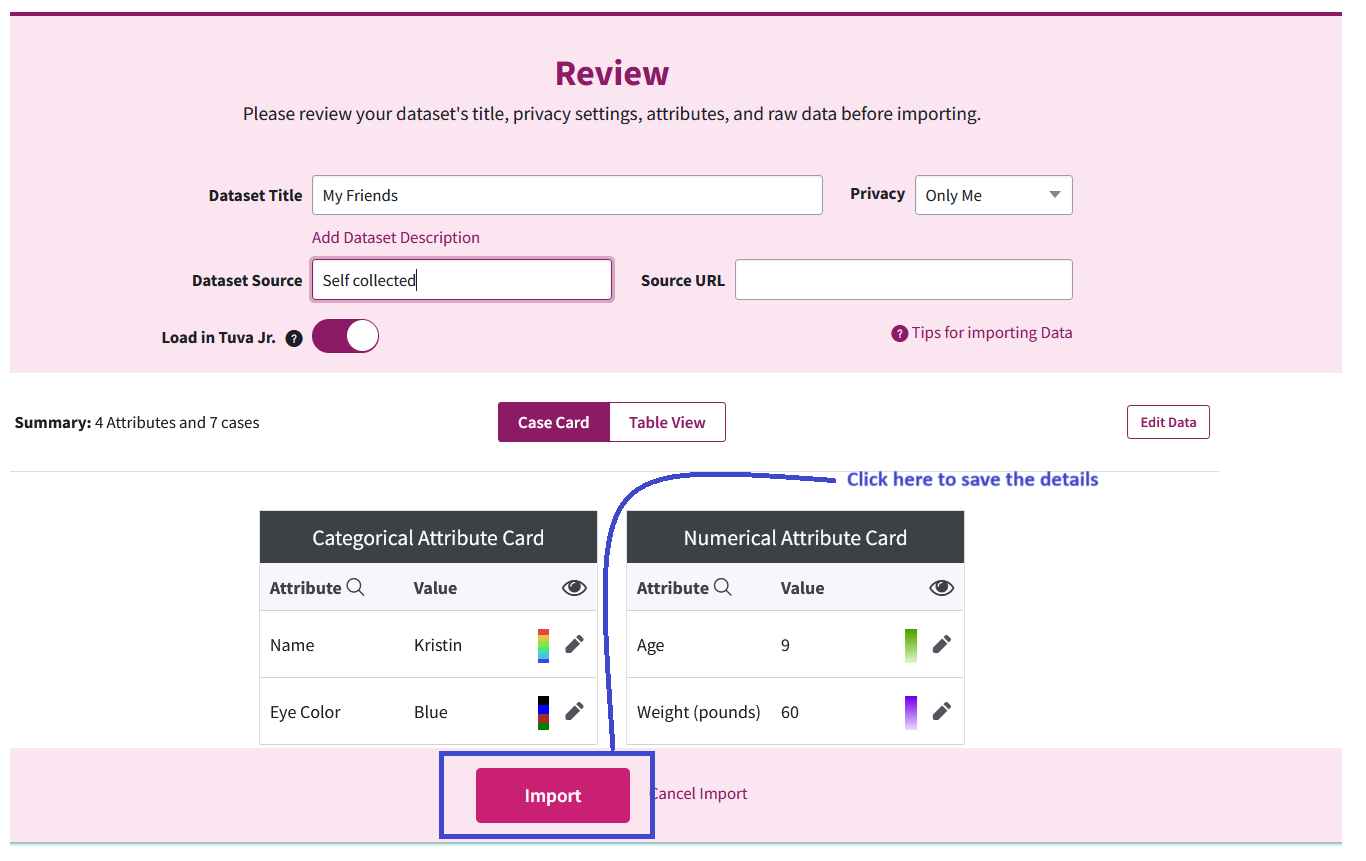
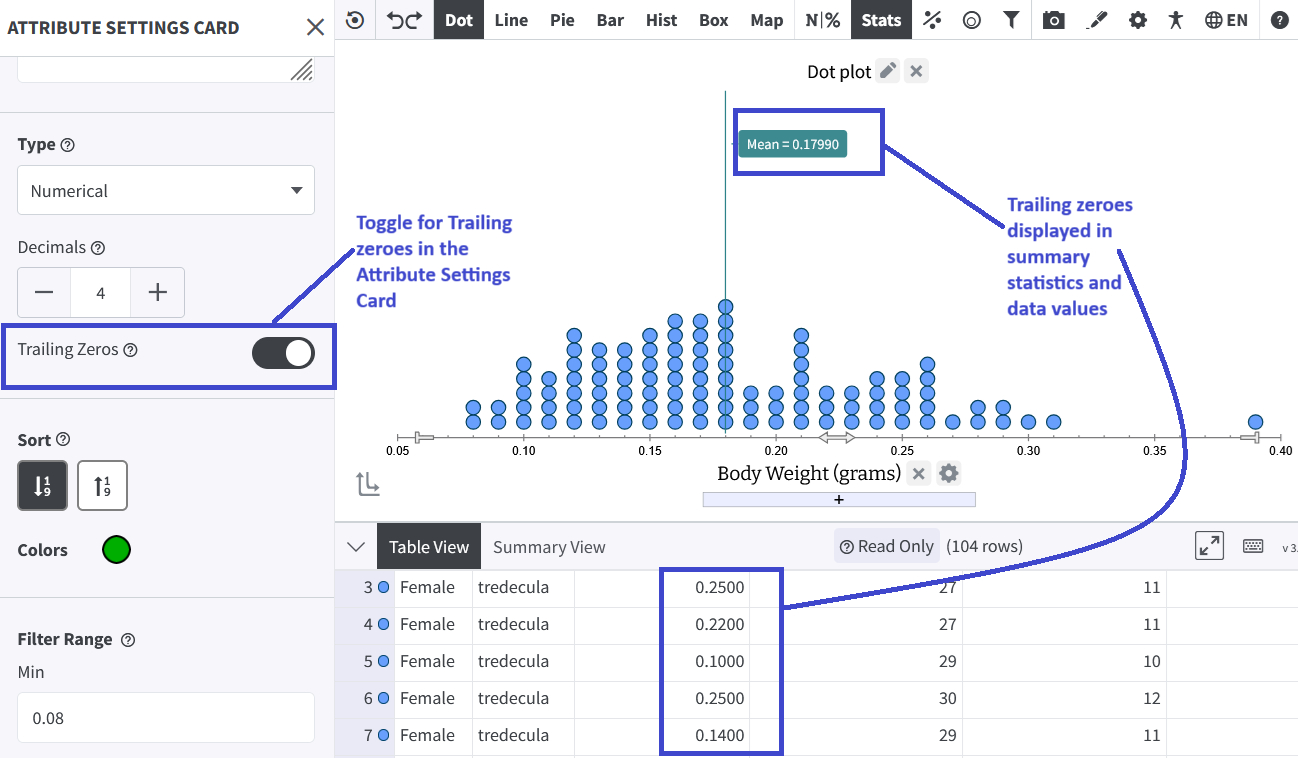
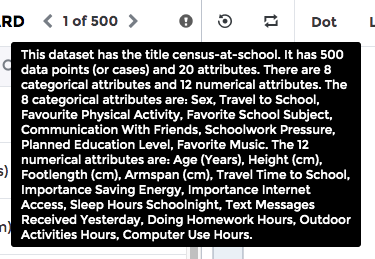
The plot summary label was renamed to Plot Summary (Alt Text) to clarify its role as an accessibility description. The dataset summary was added to the screenshot pop-up to give users quick context when capturing and sharing visuals.

-
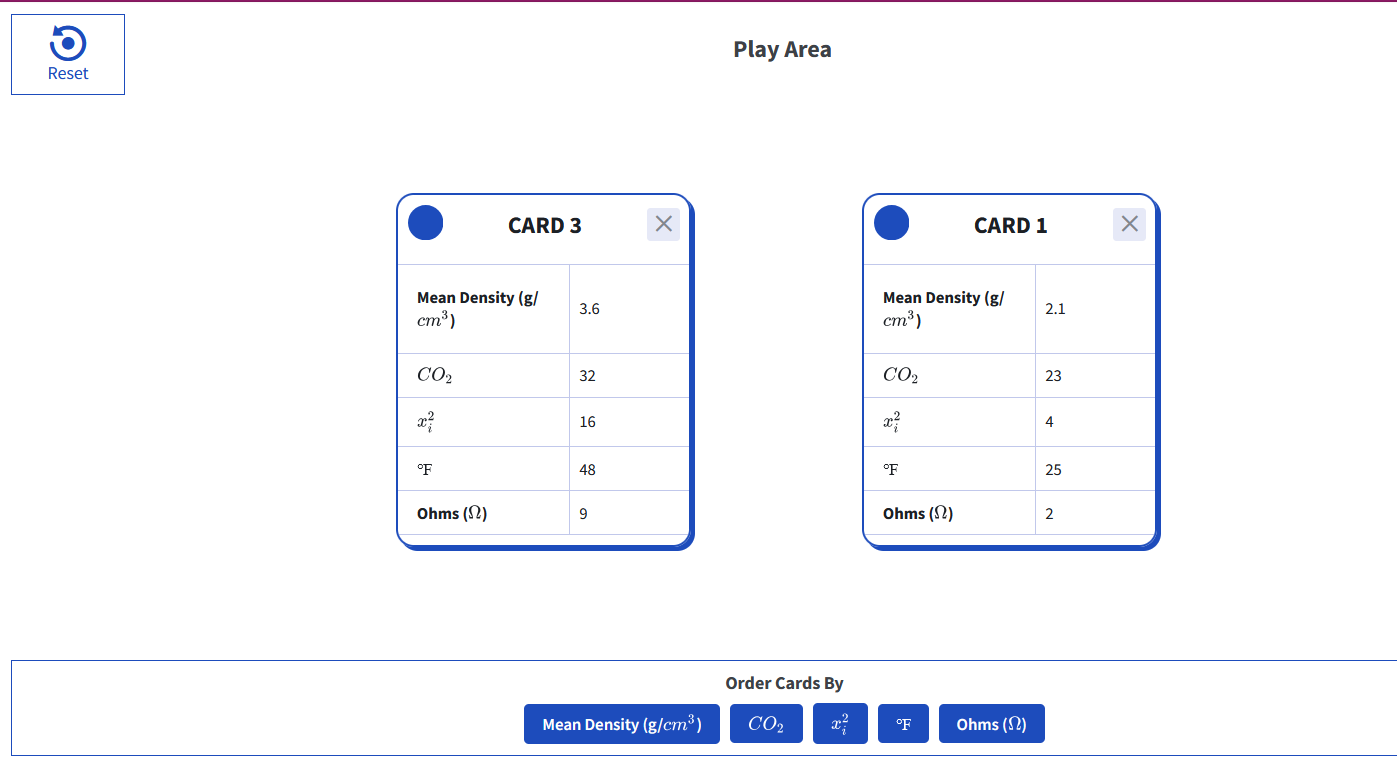
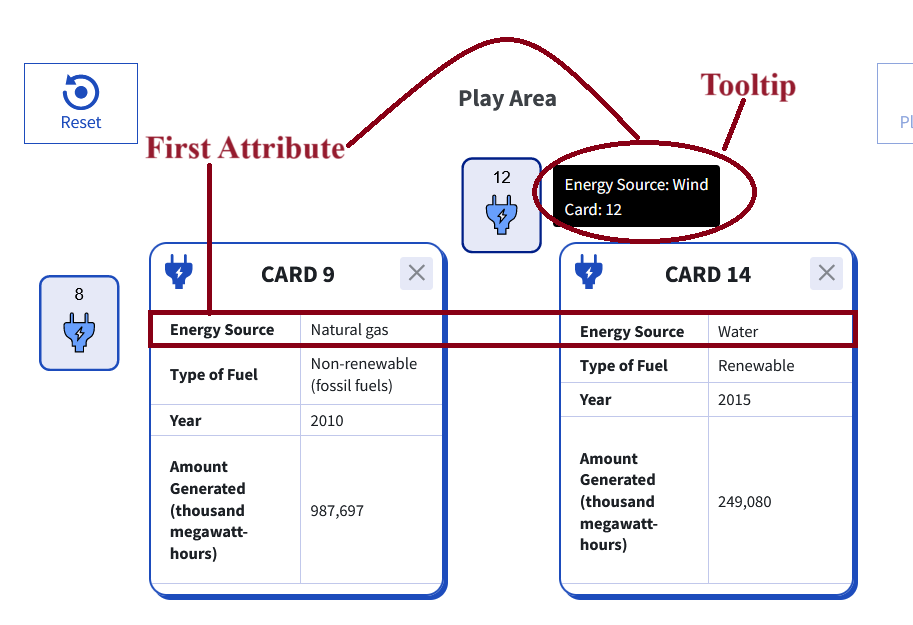
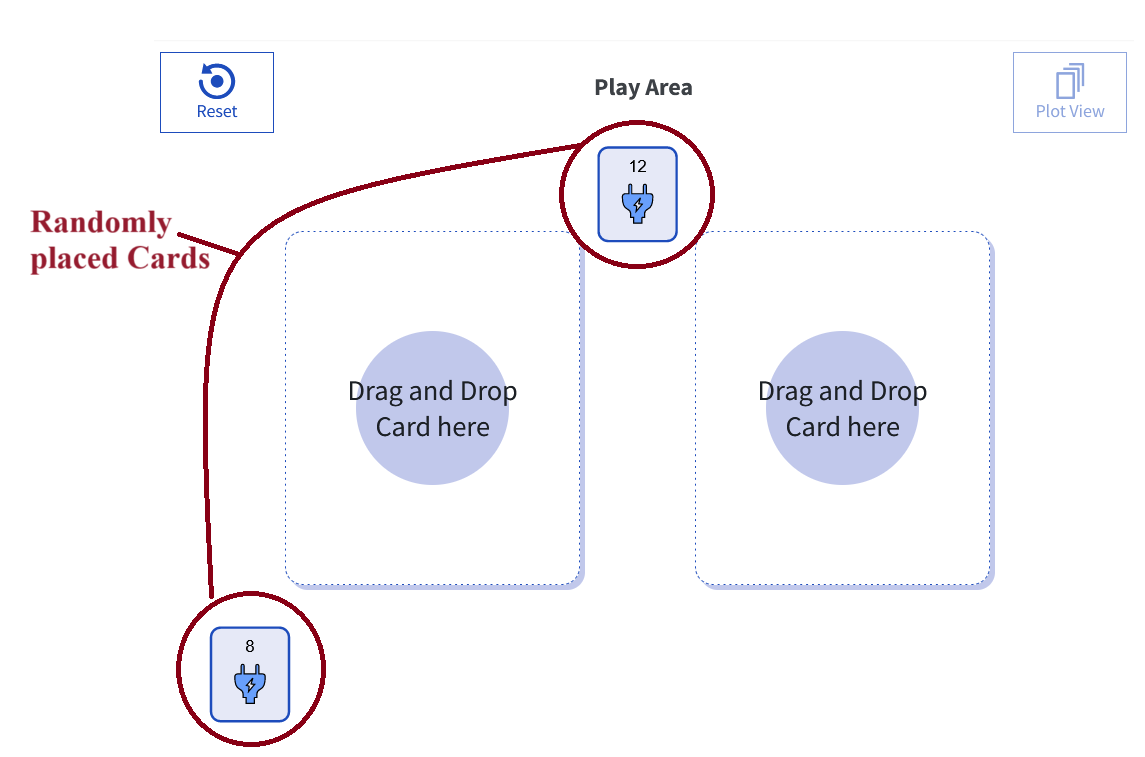
Addition of the Tuva Tools Tour:
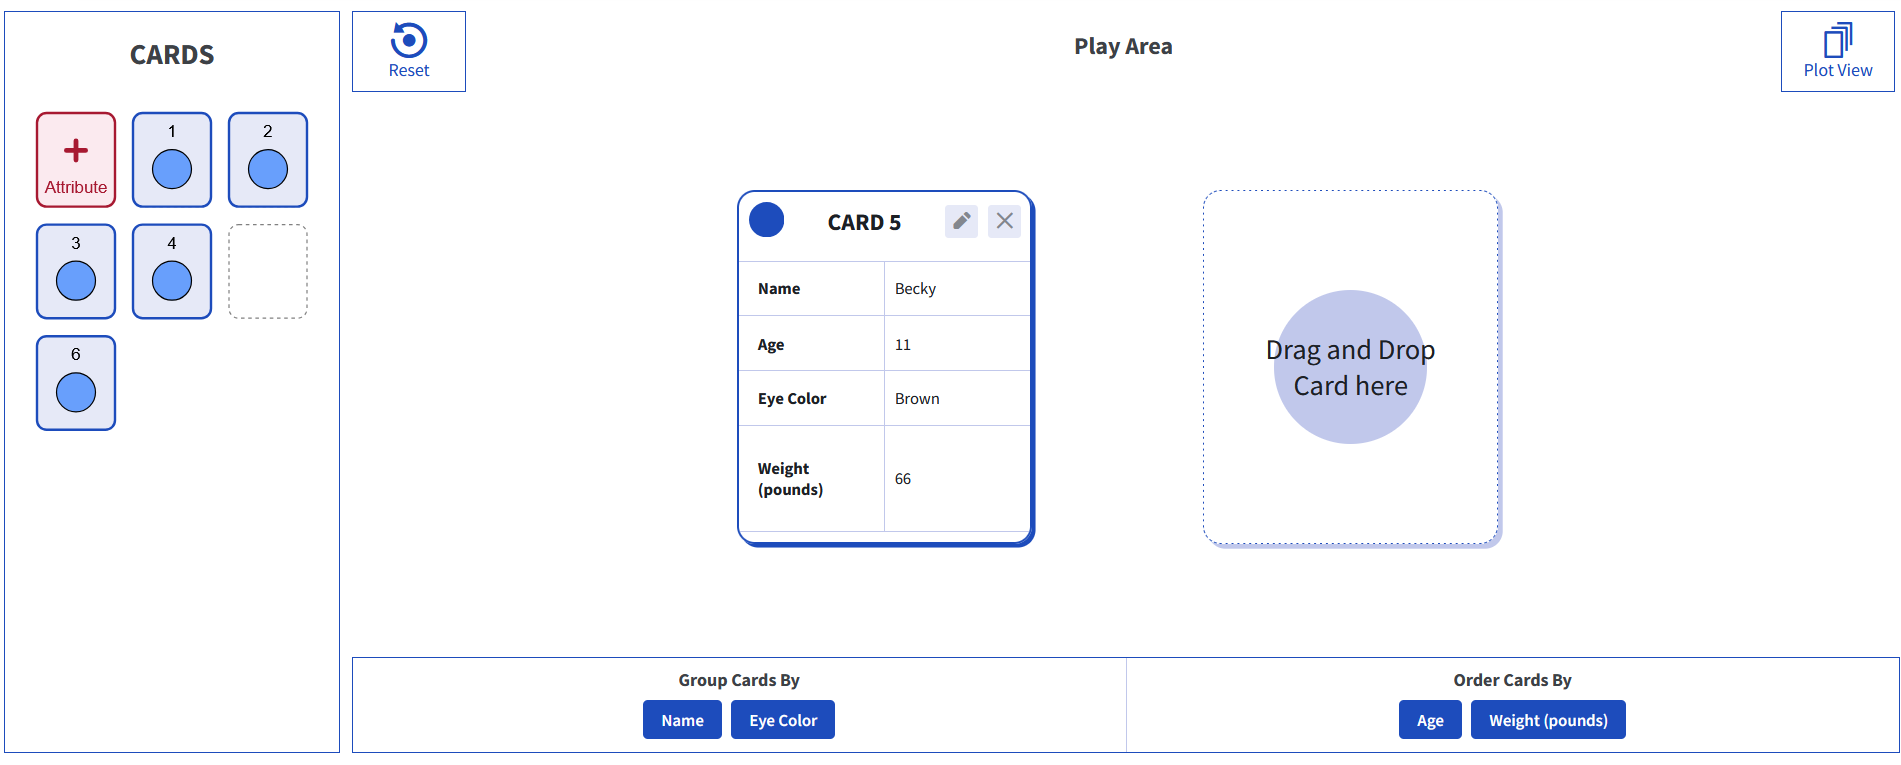
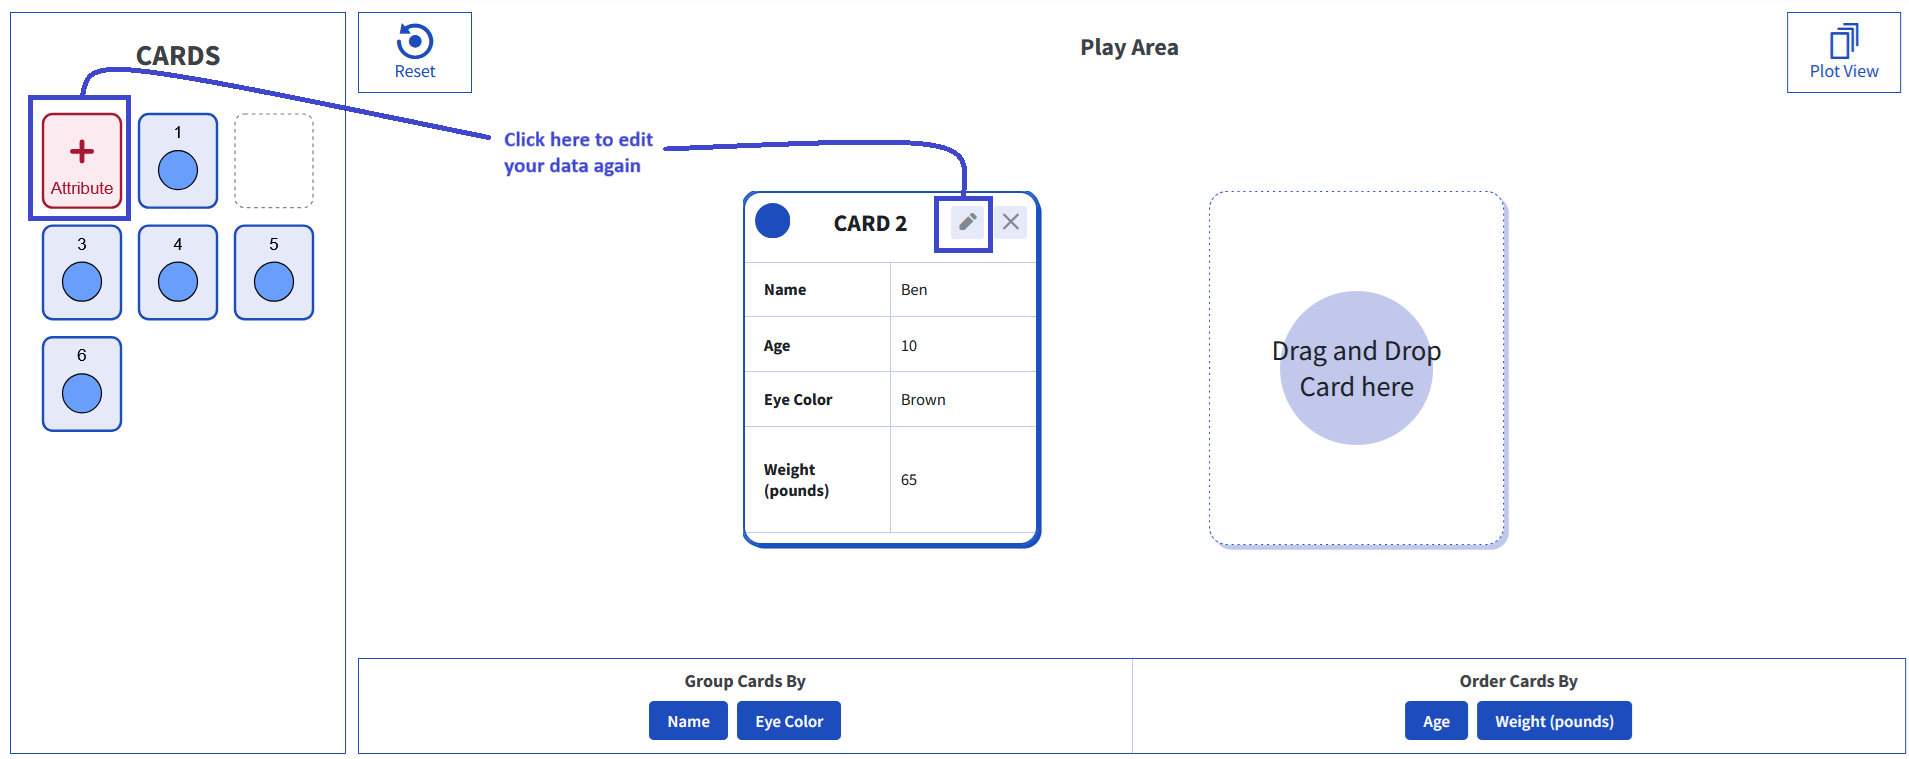
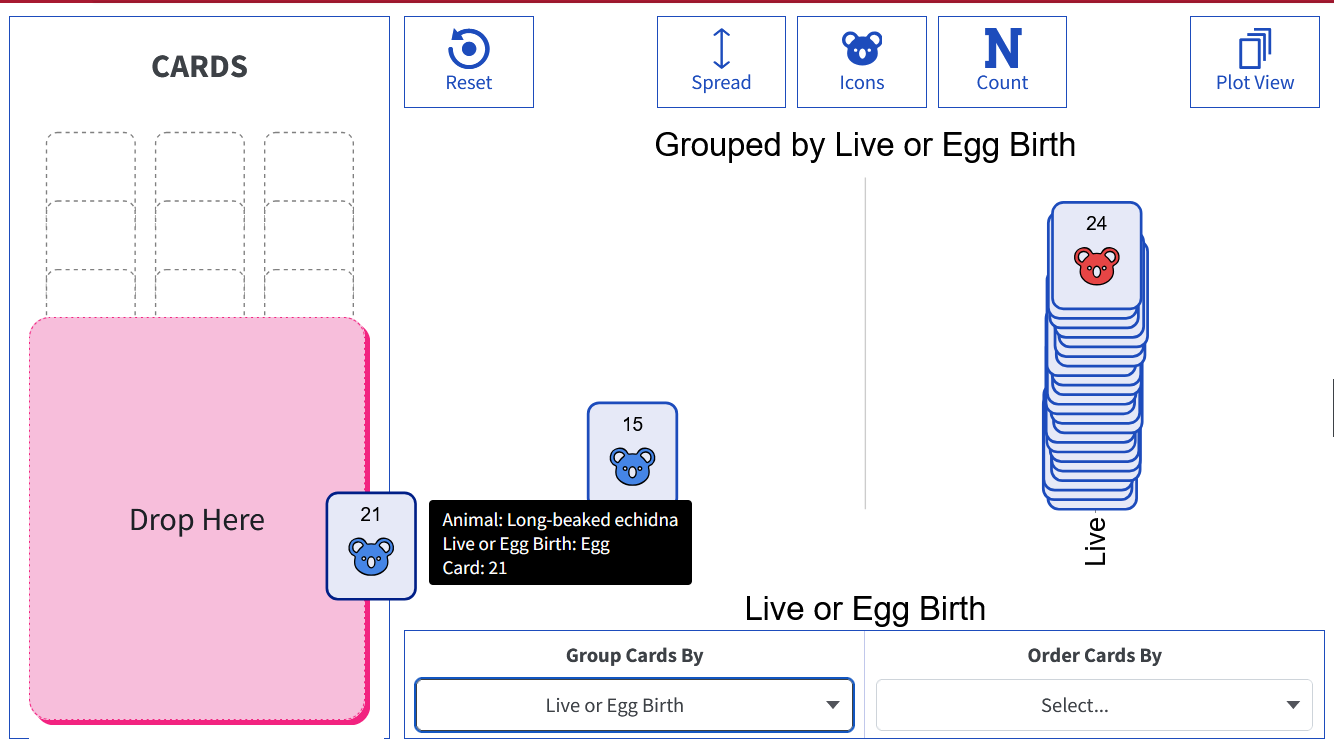
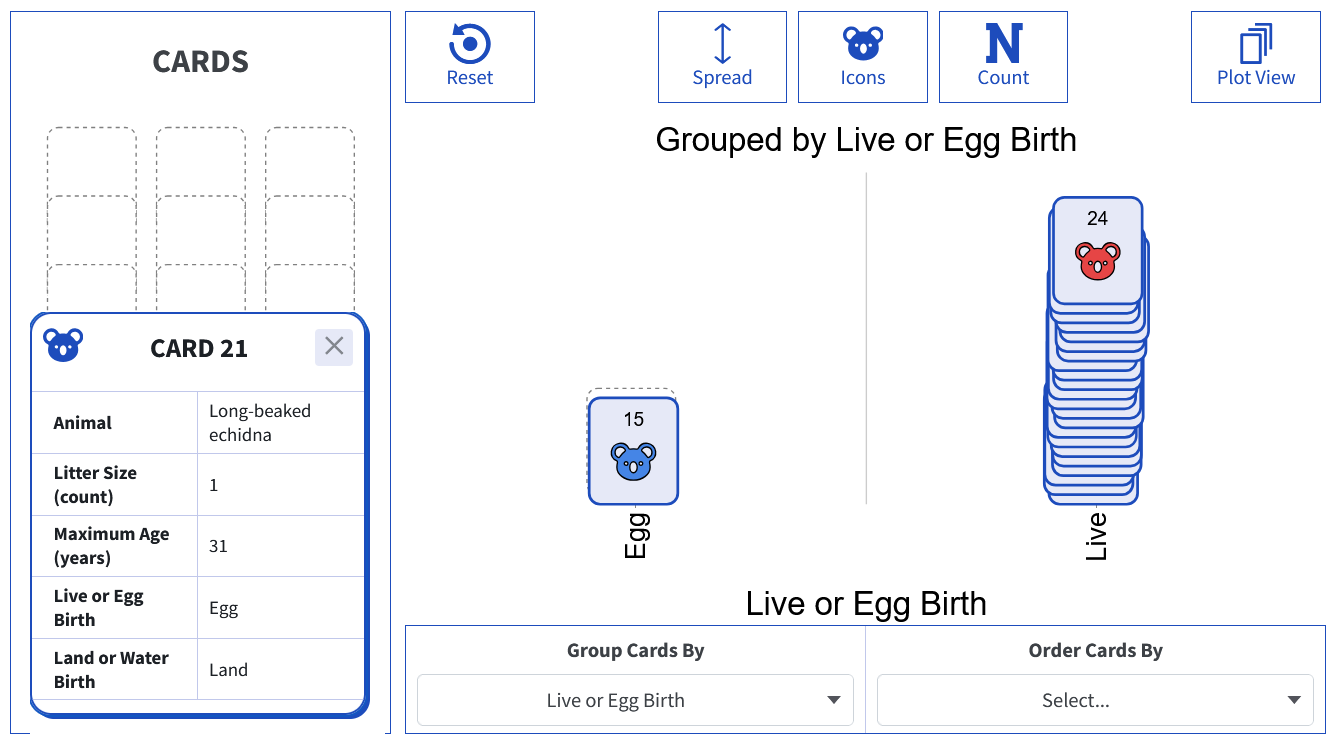
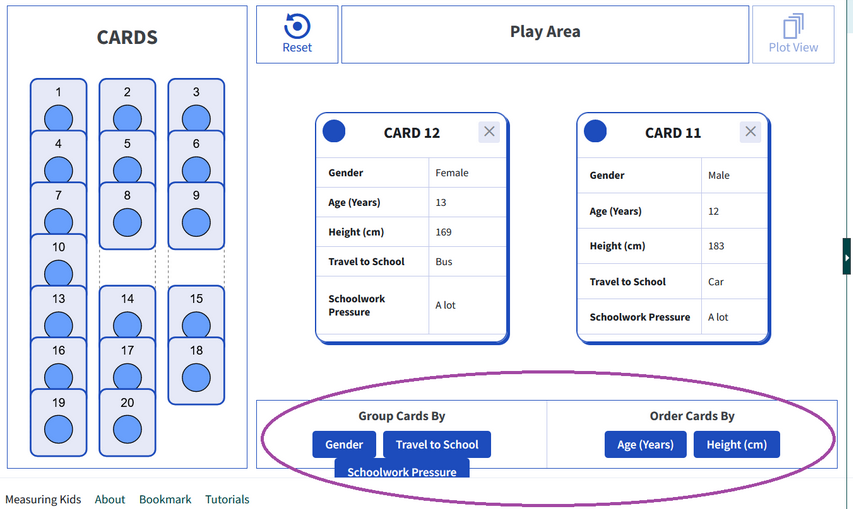
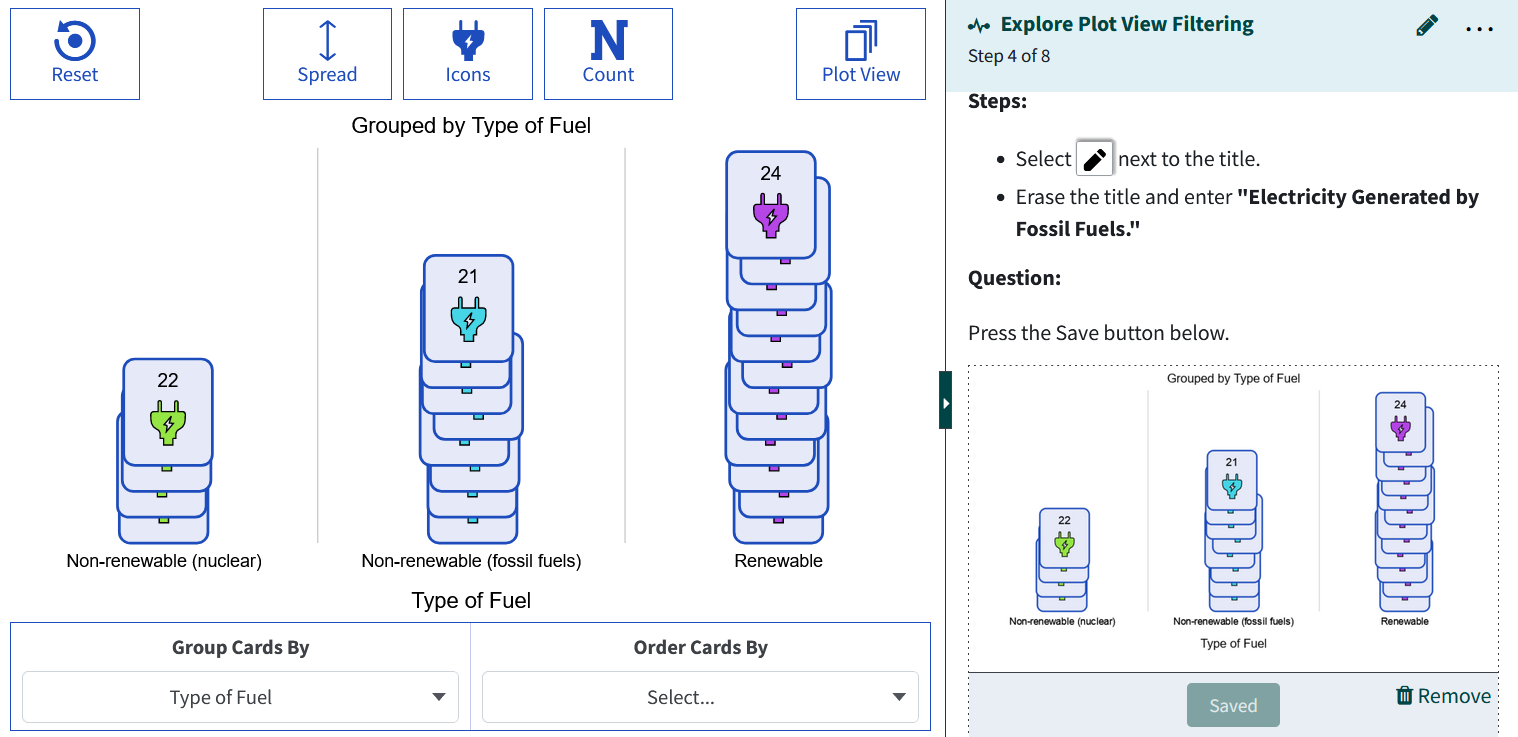
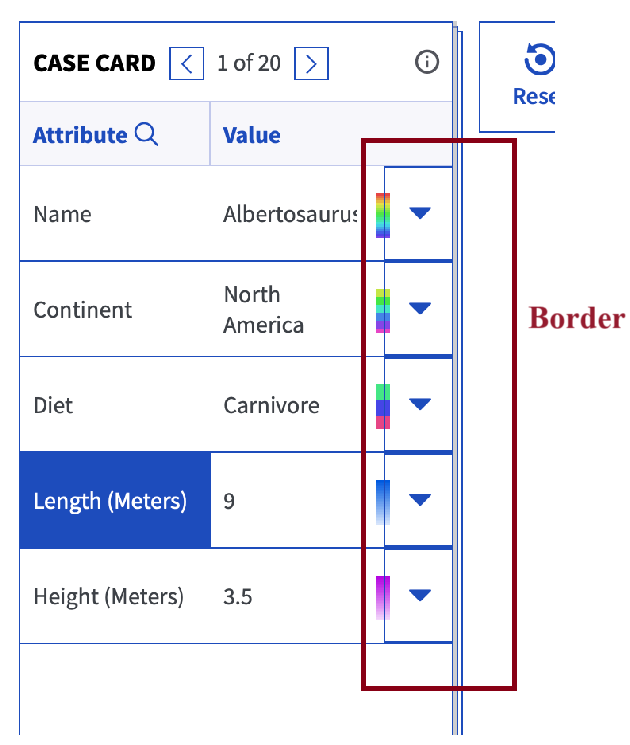
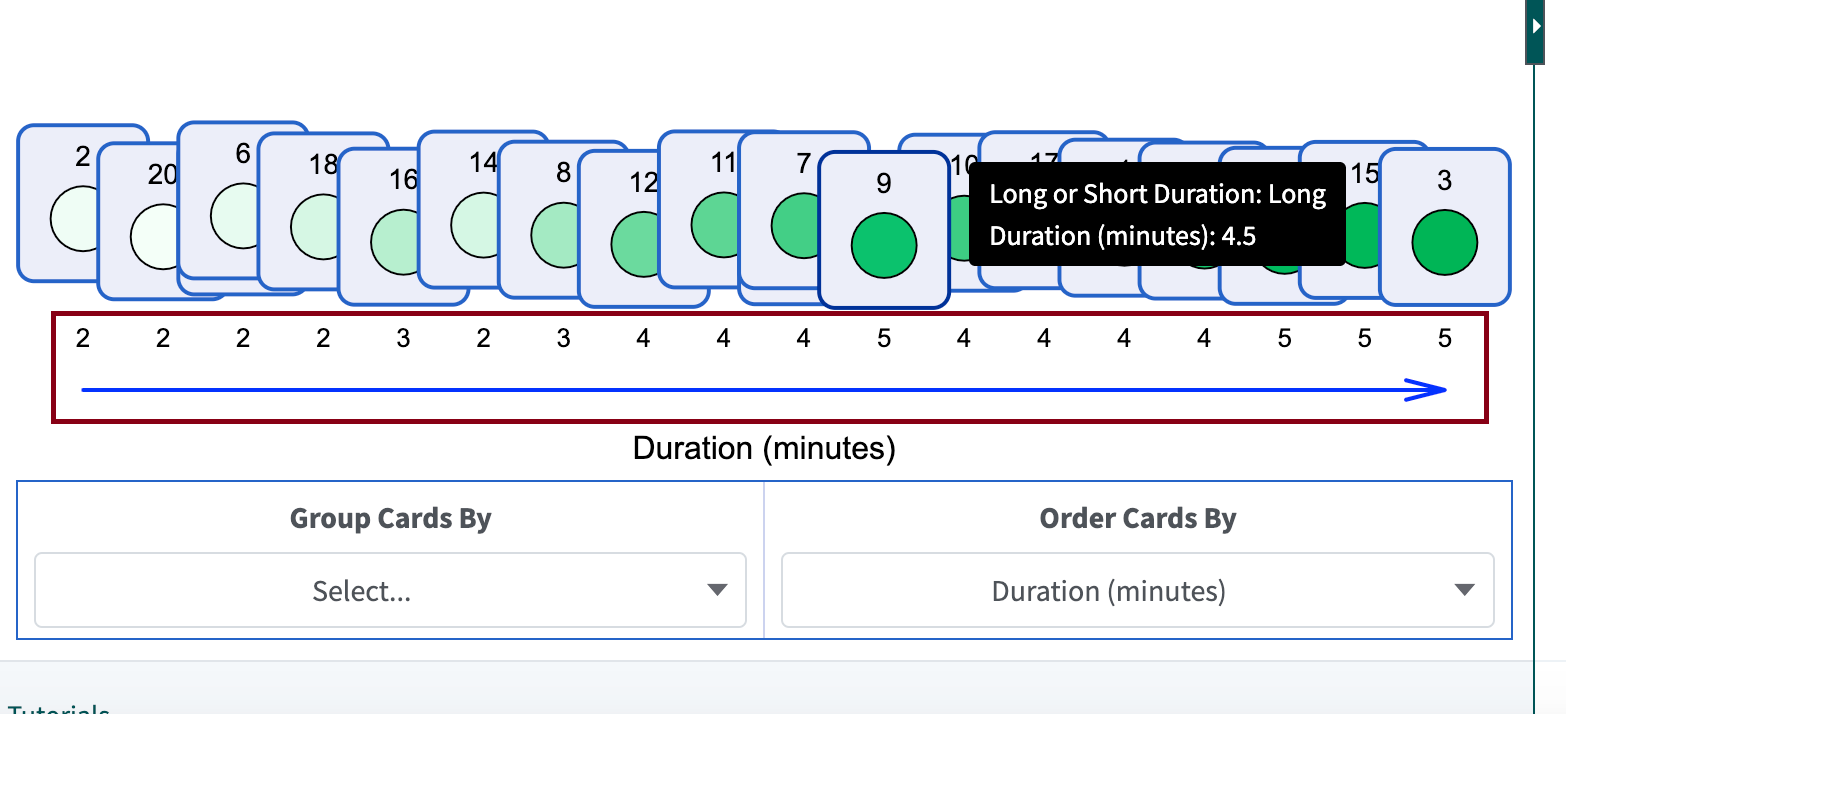
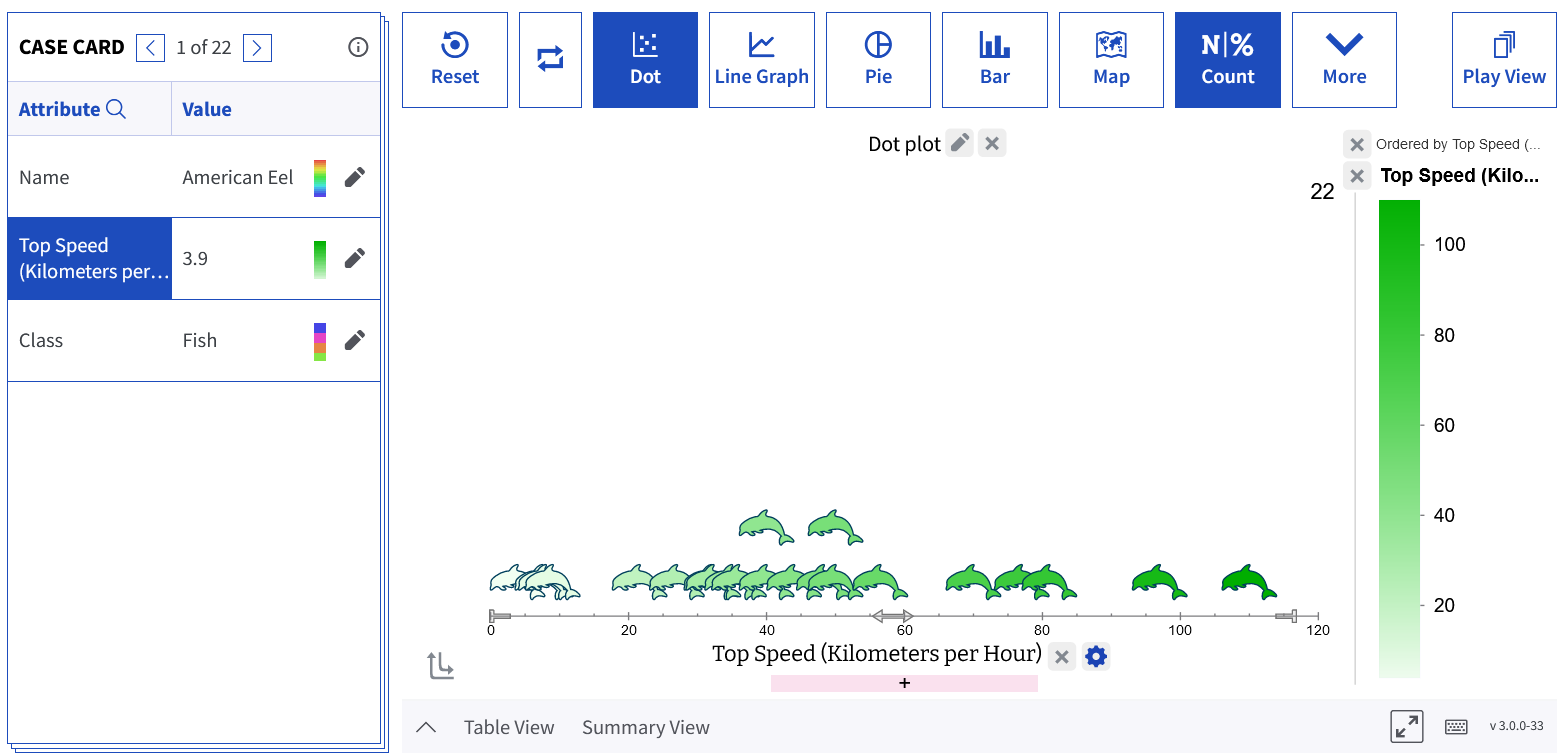
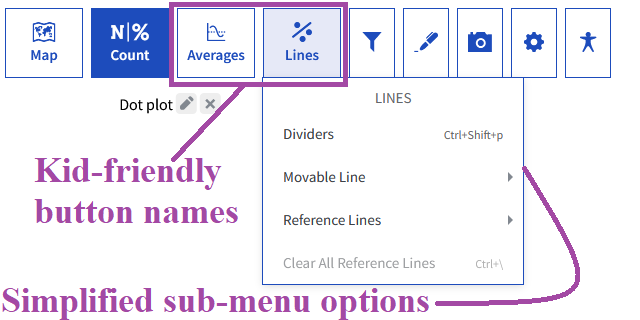
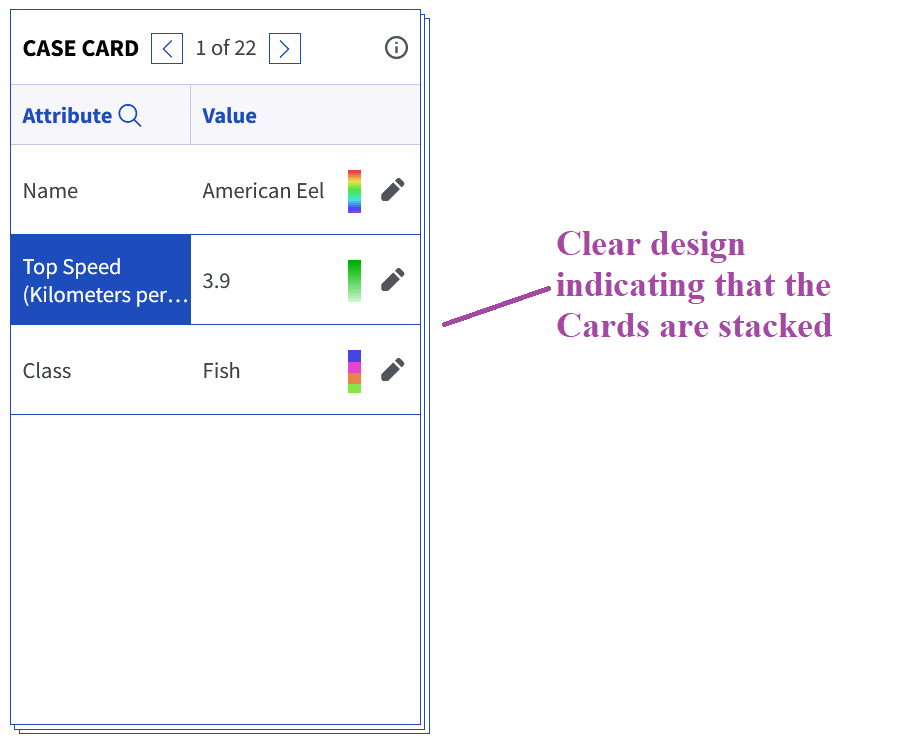
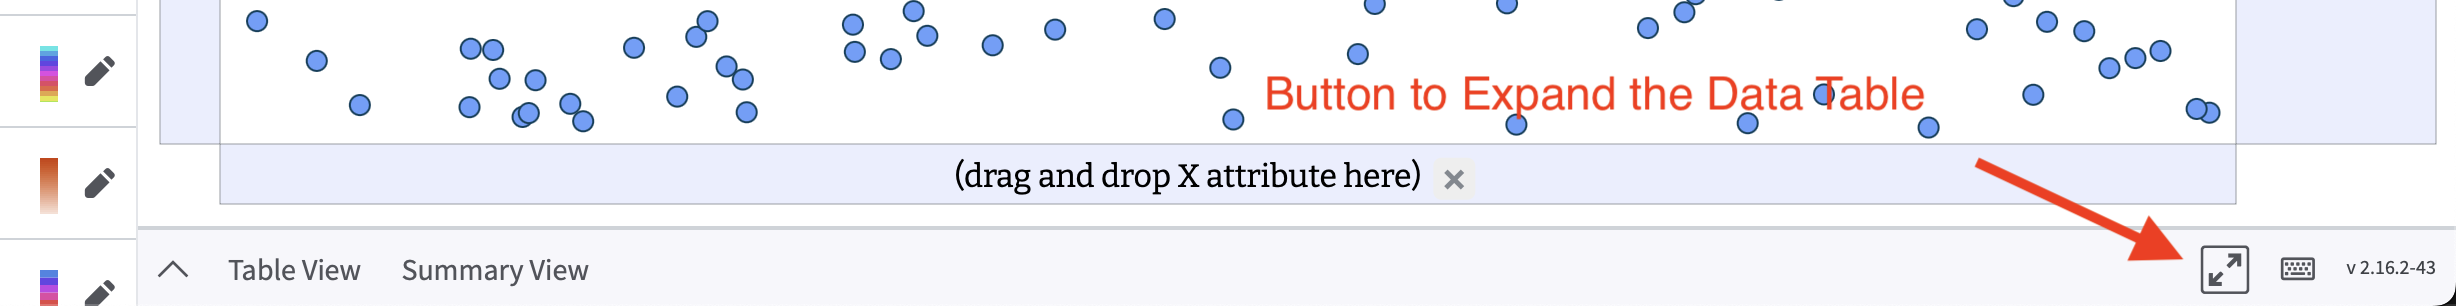
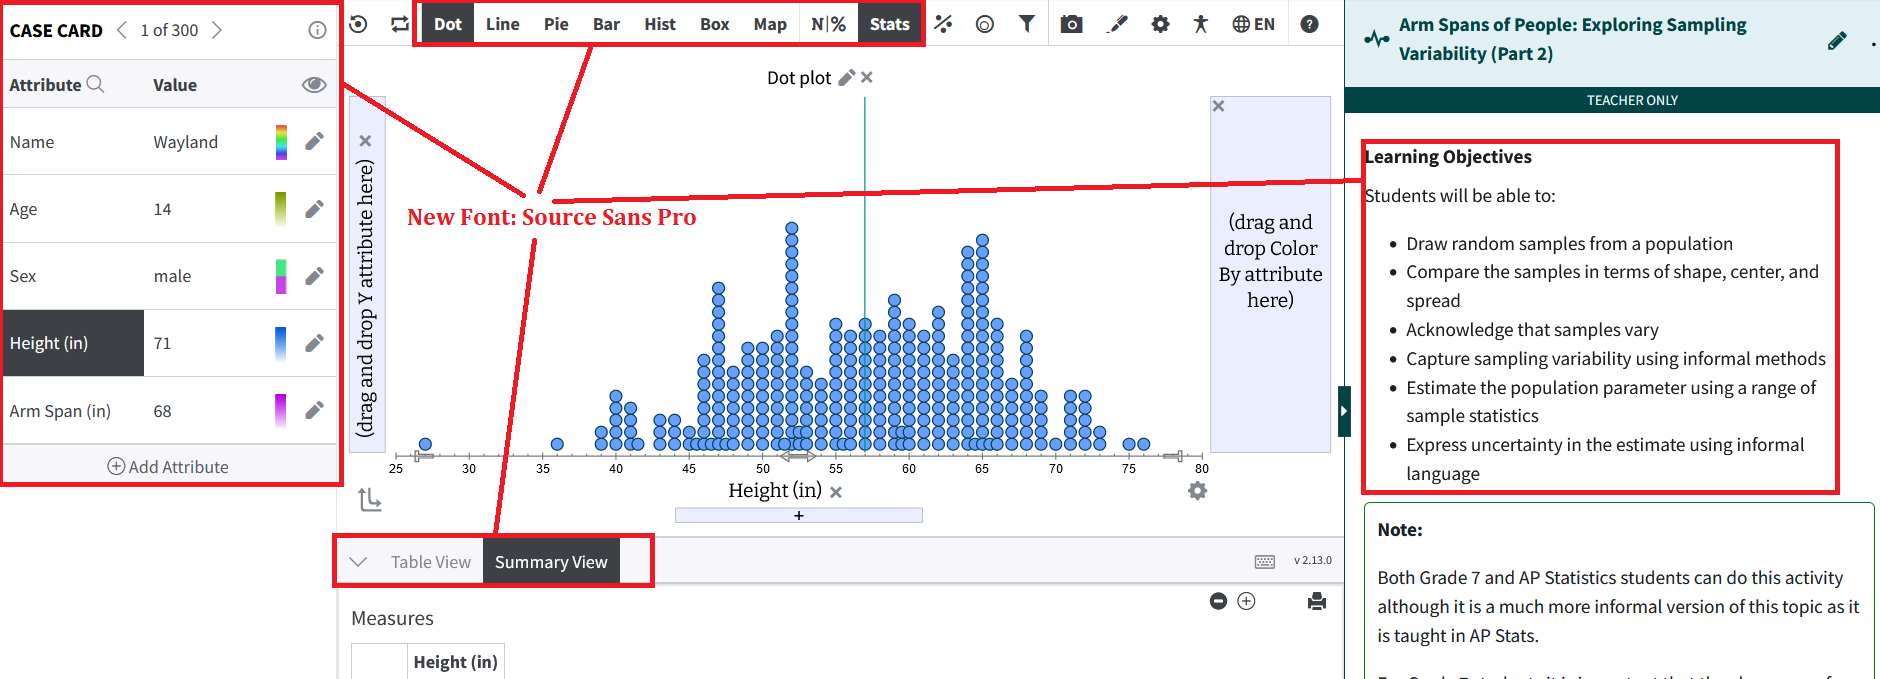
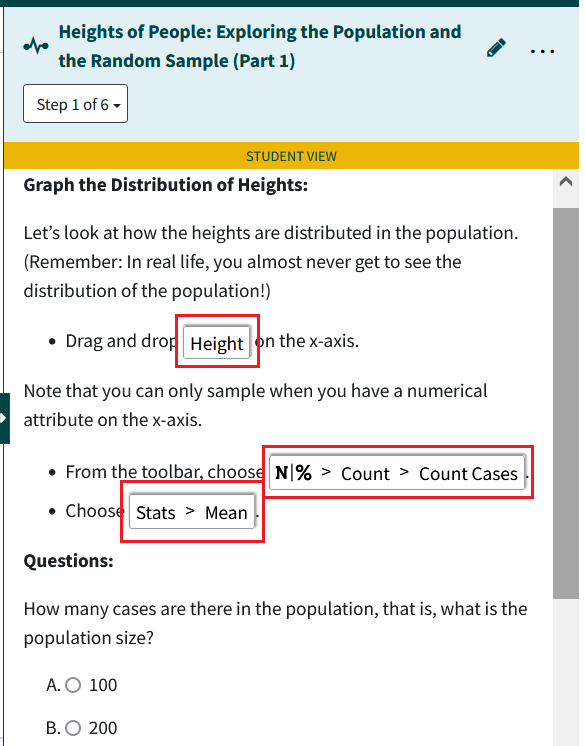
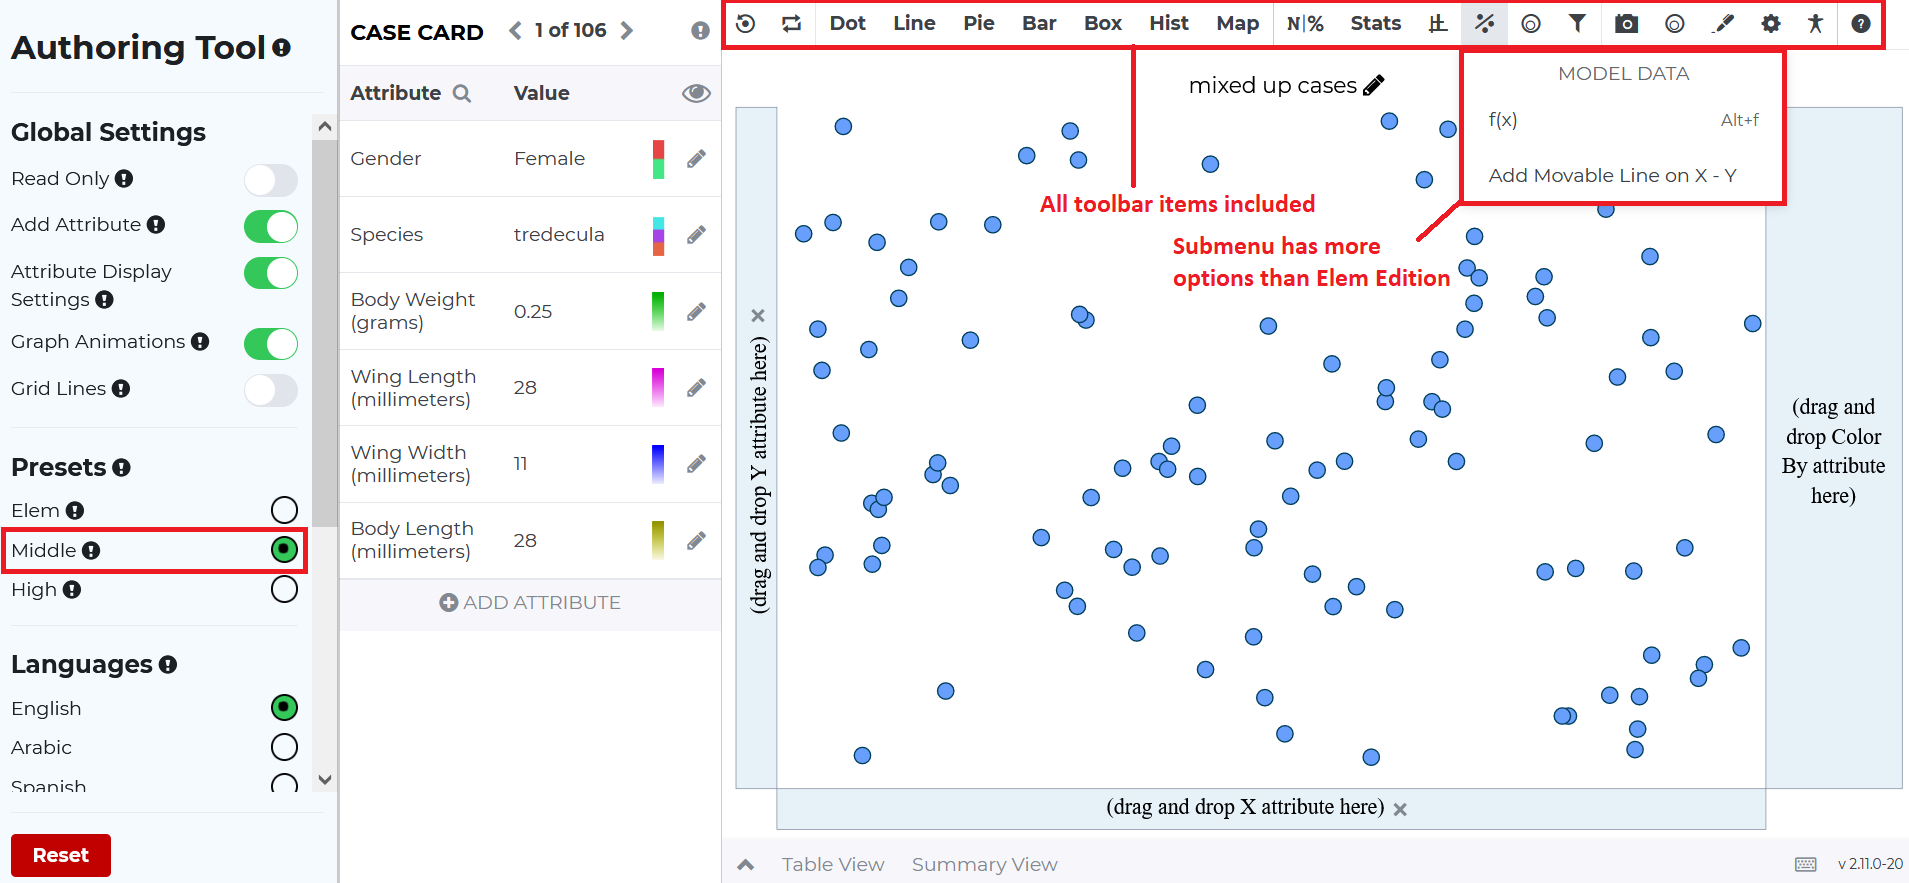
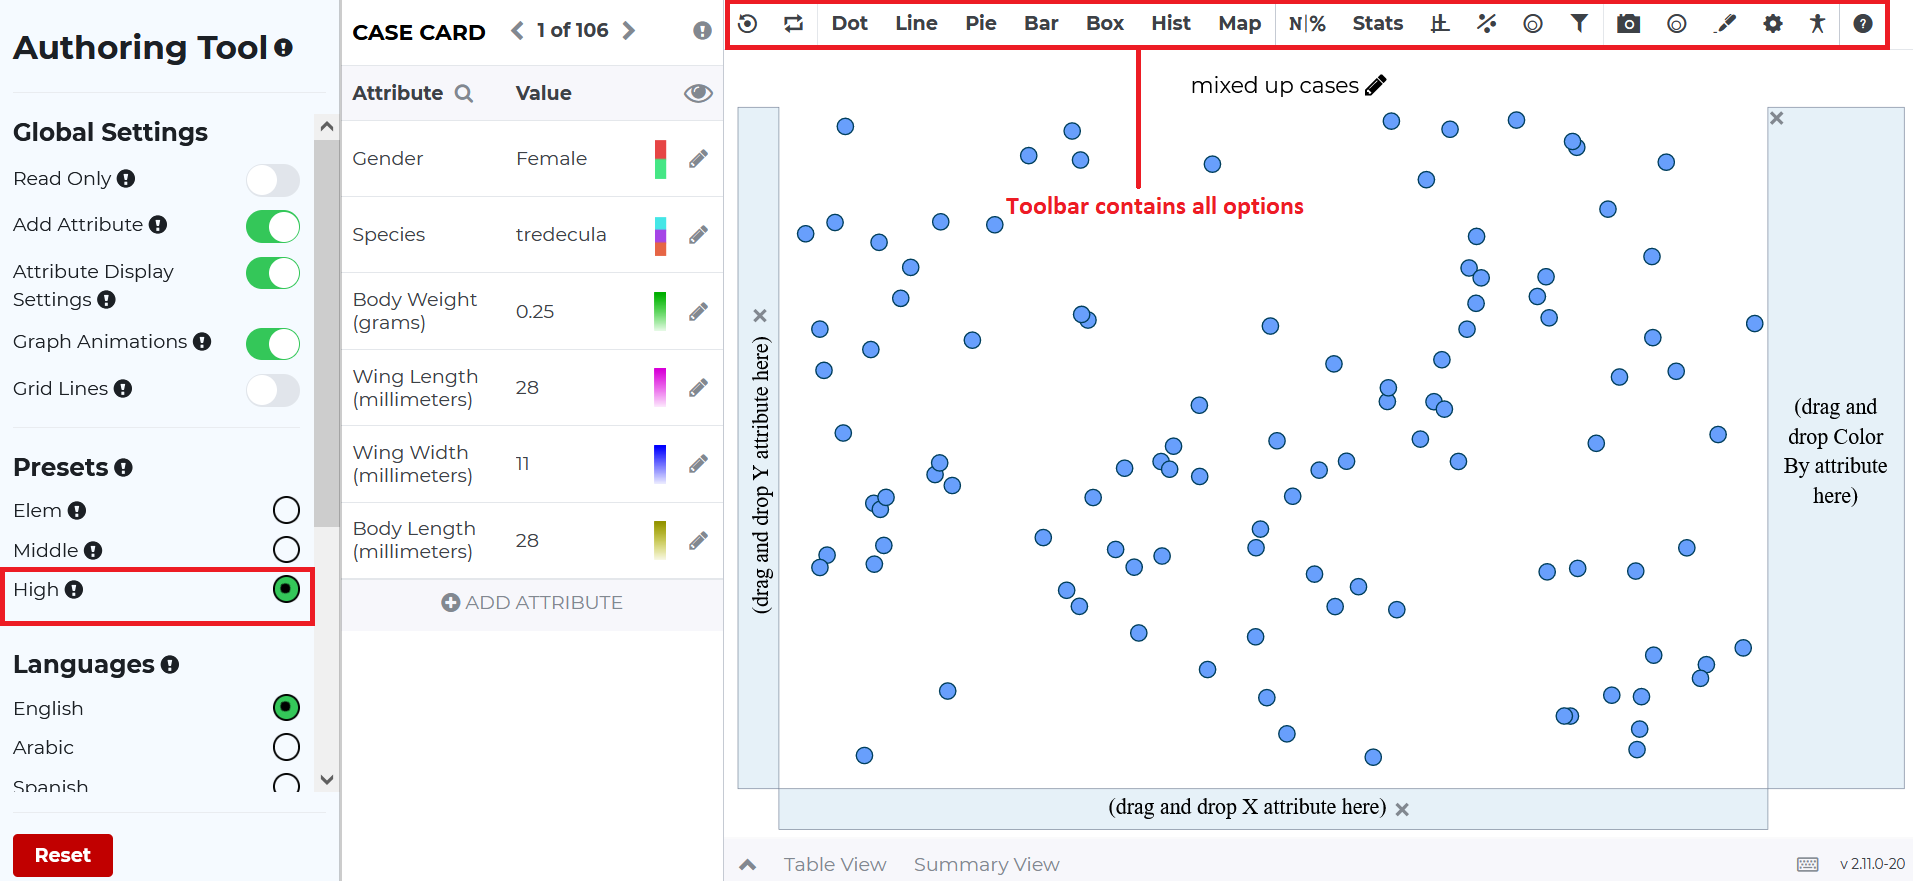
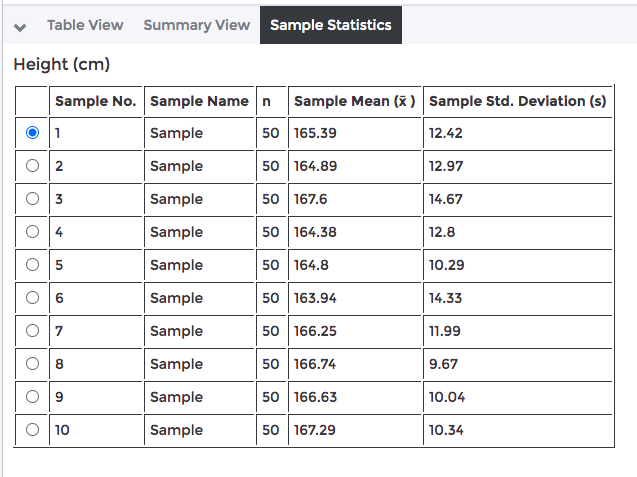
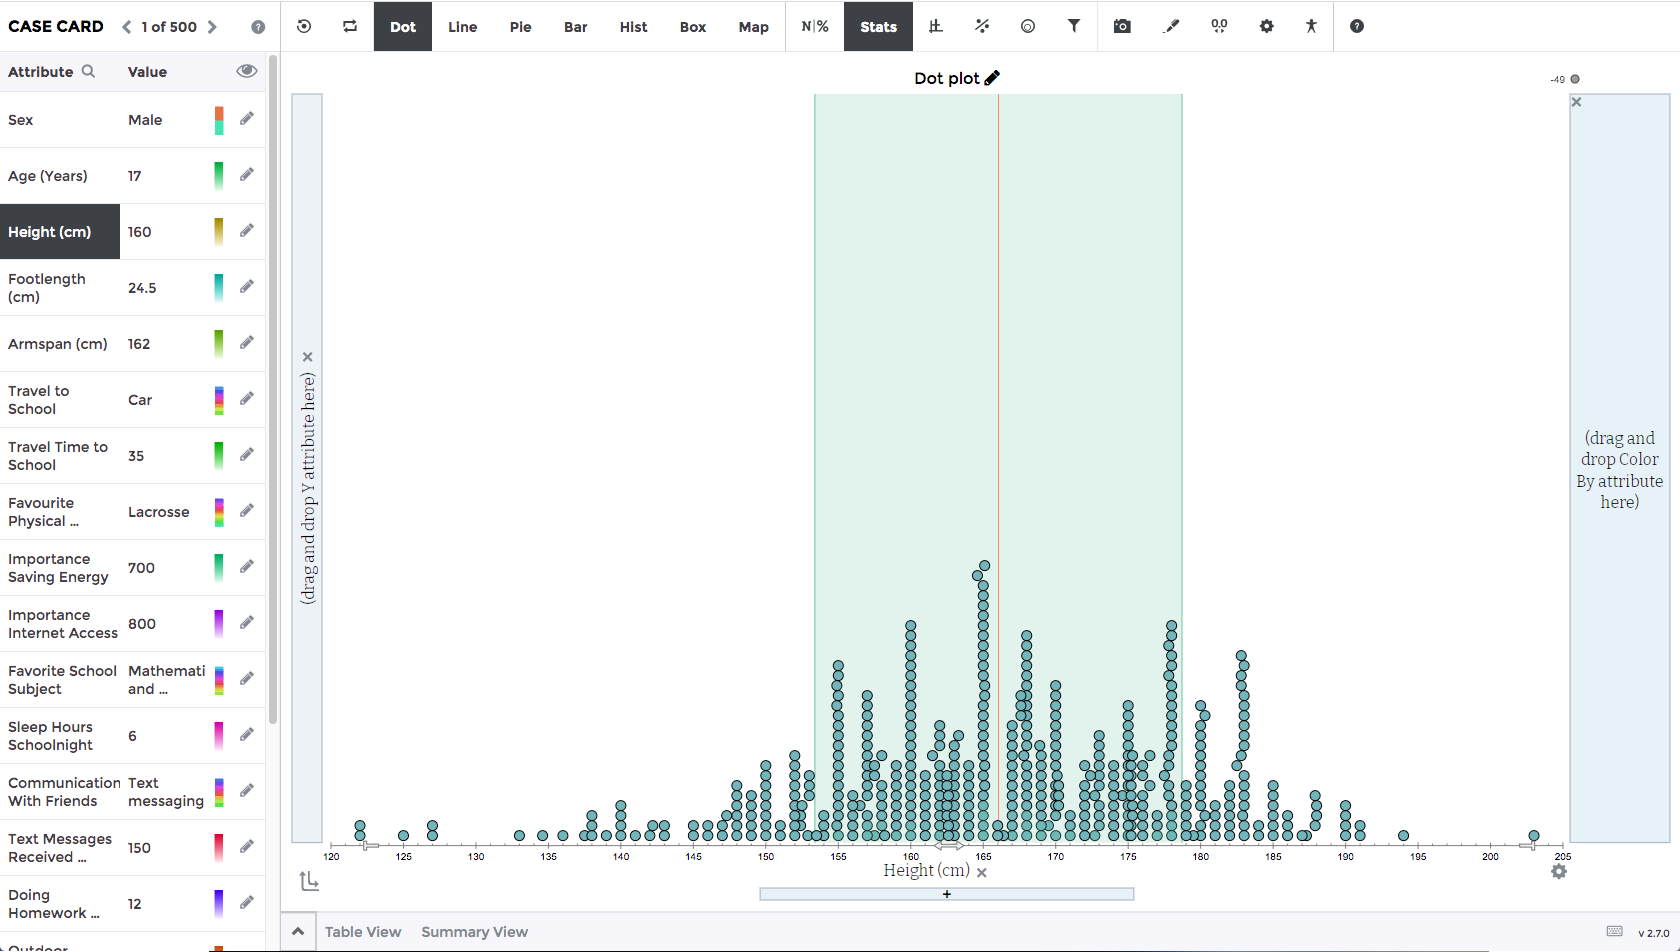
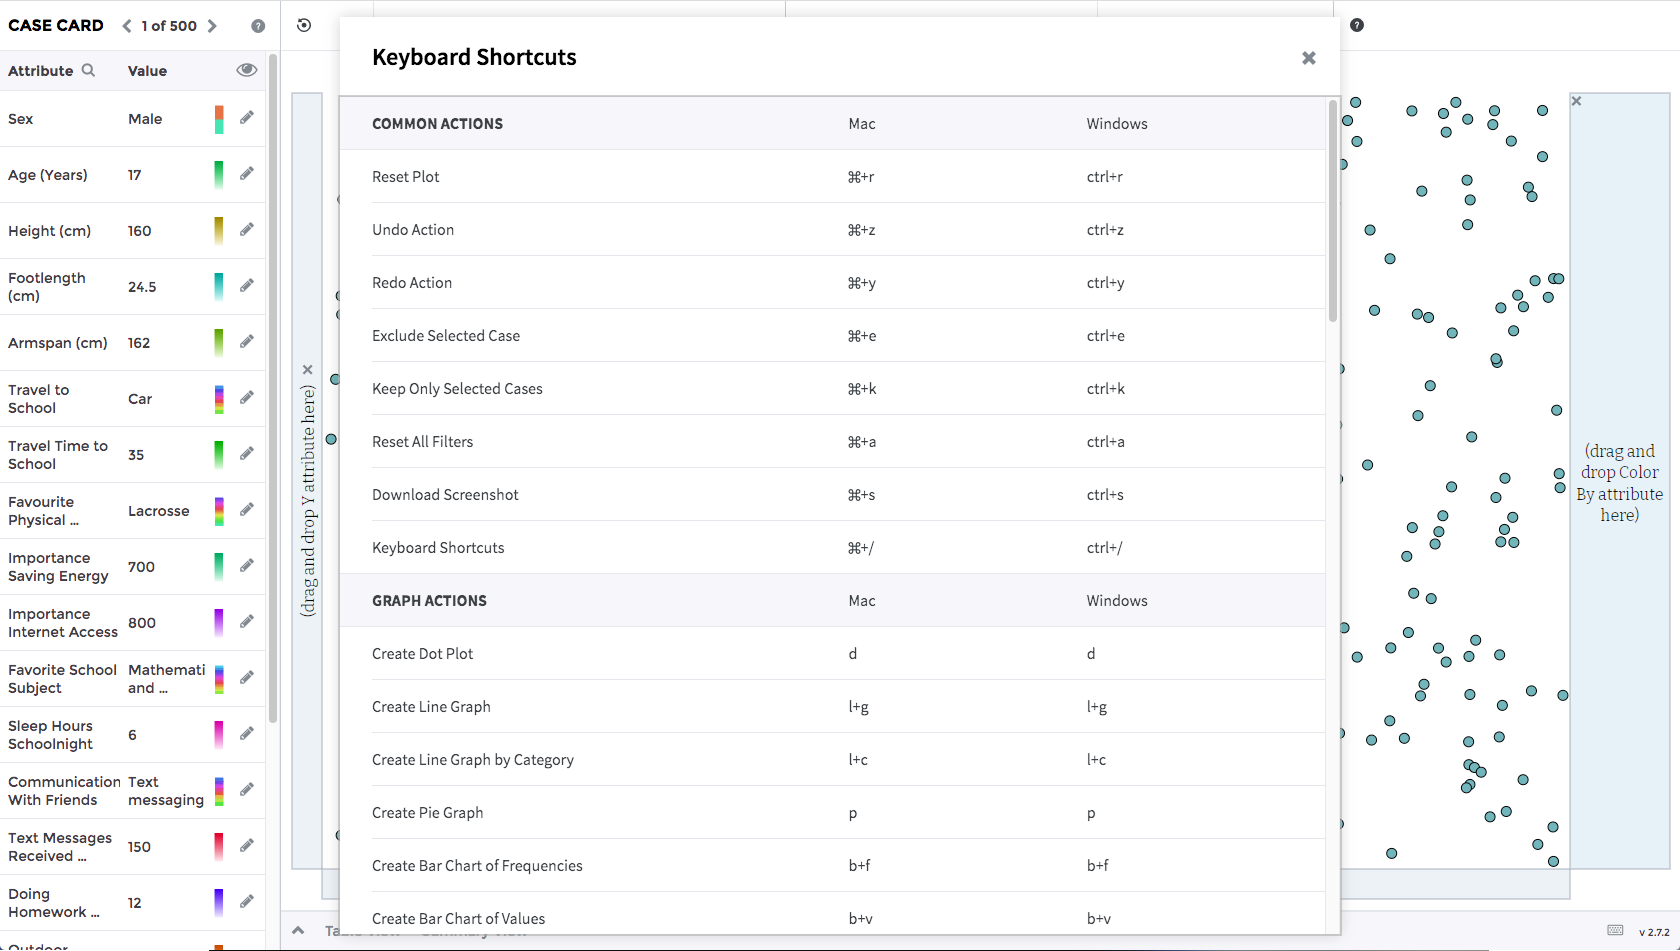
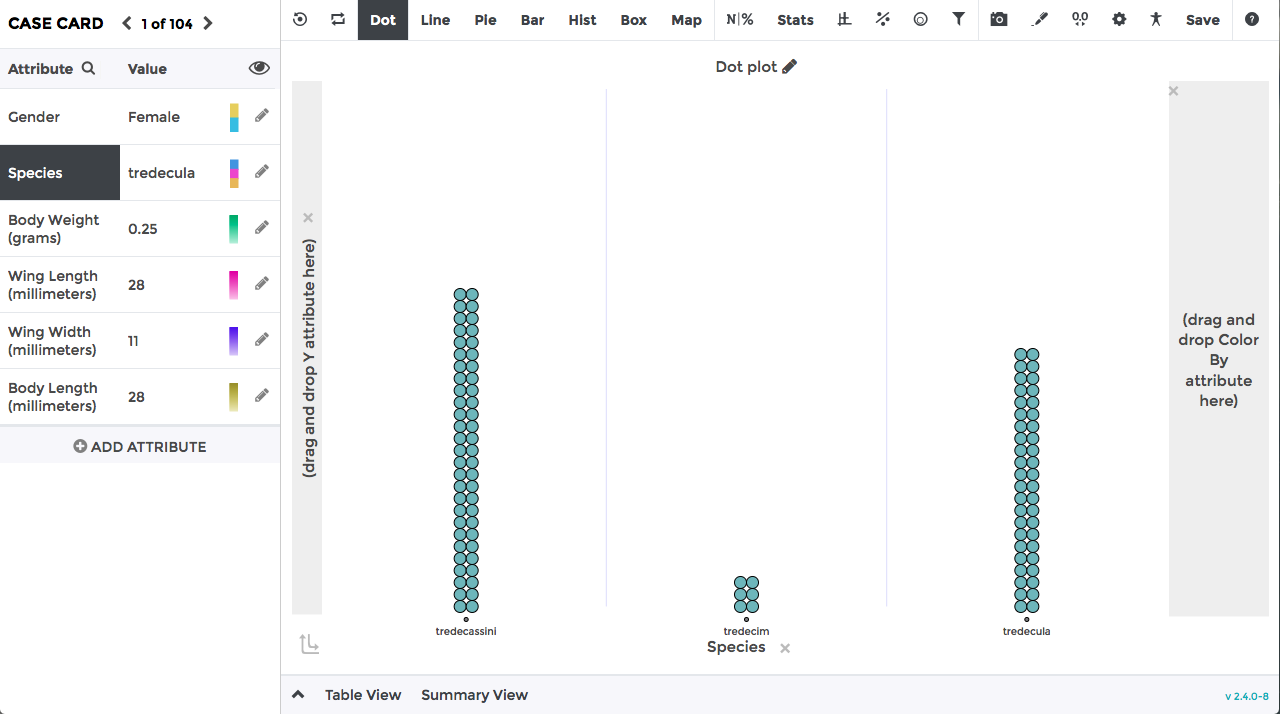
An author-facing toggle has been added to enable the tool tour for both Tuva Jr. and the regular Tuva tools. The tour guides users through the key components of the environment, including the case card, the toolbar, the plotting area, and the table and summary view.

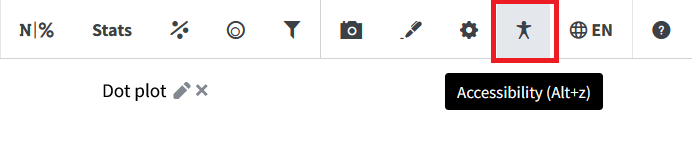
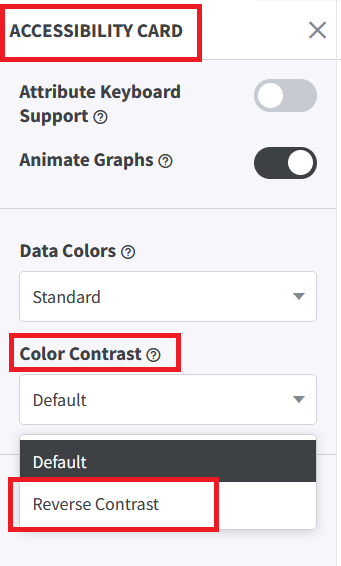
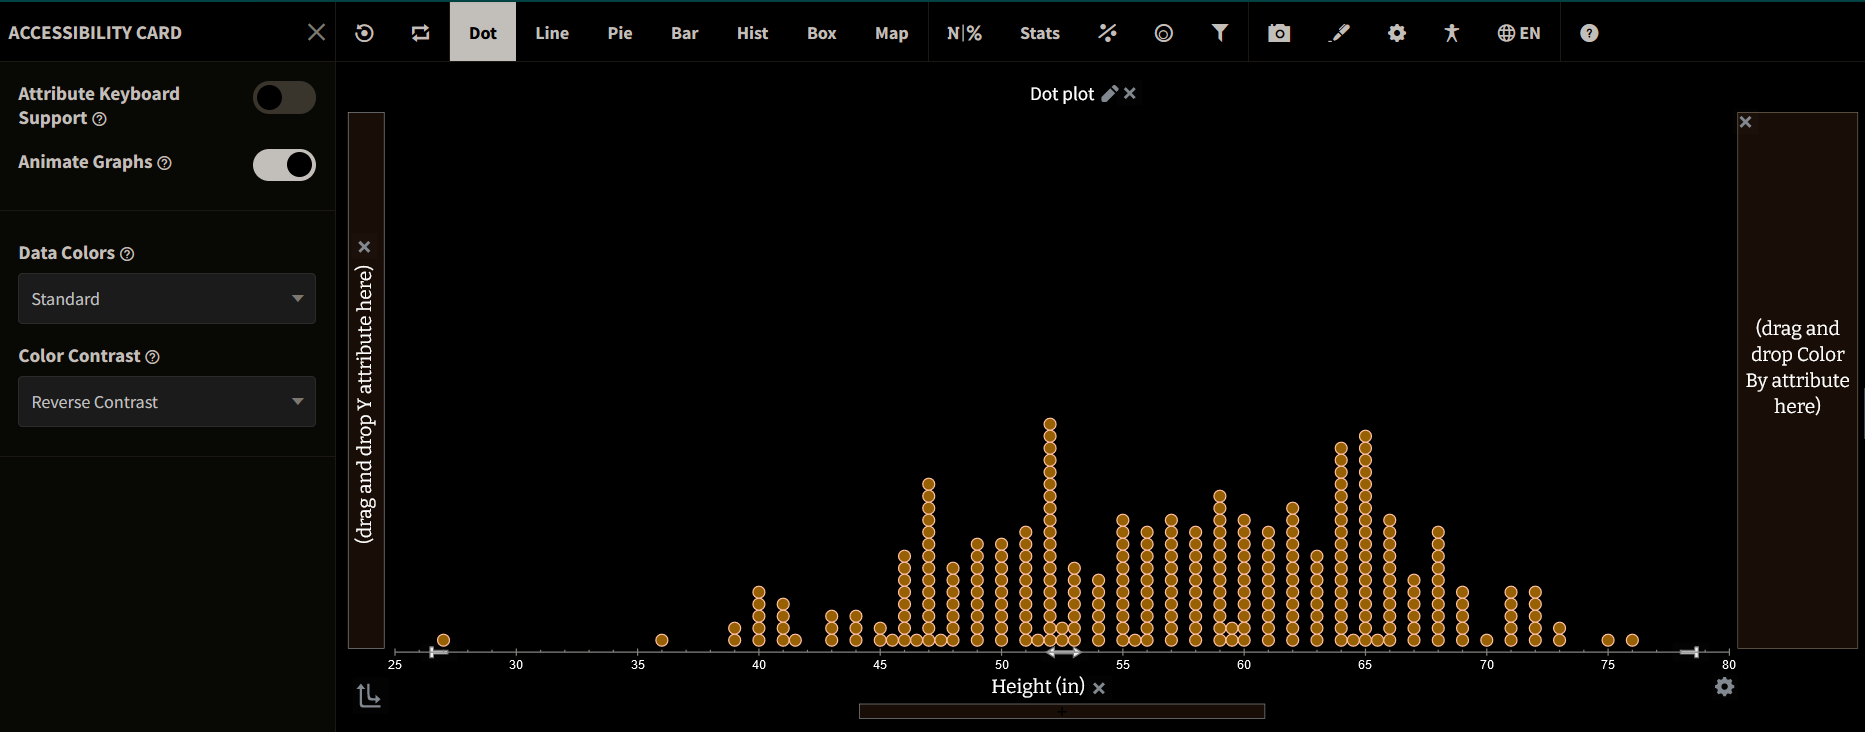
Accessibility:
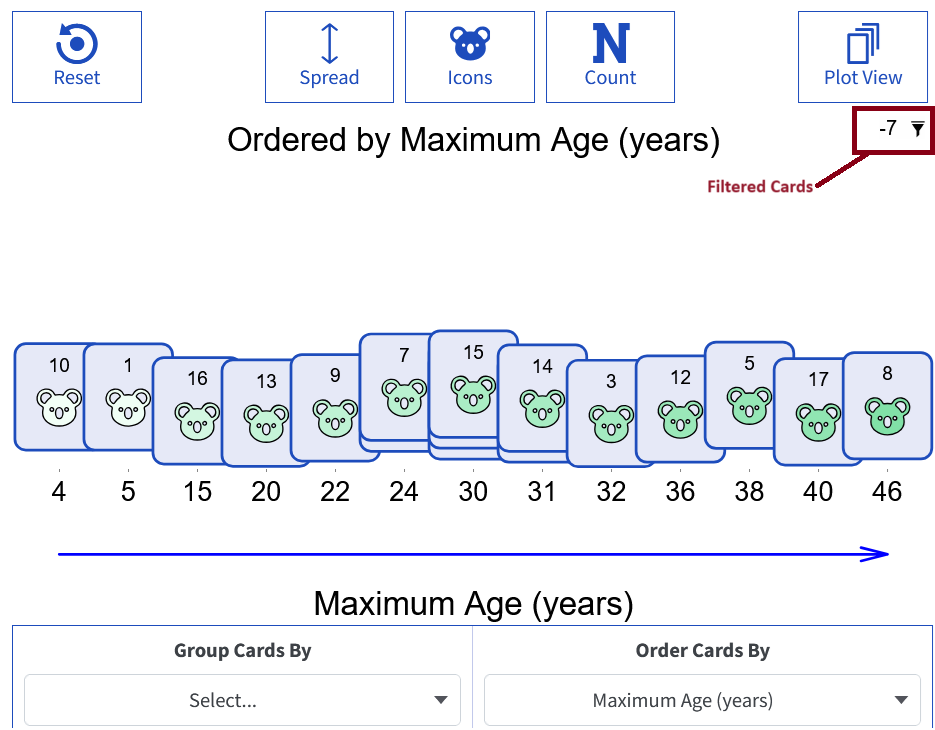
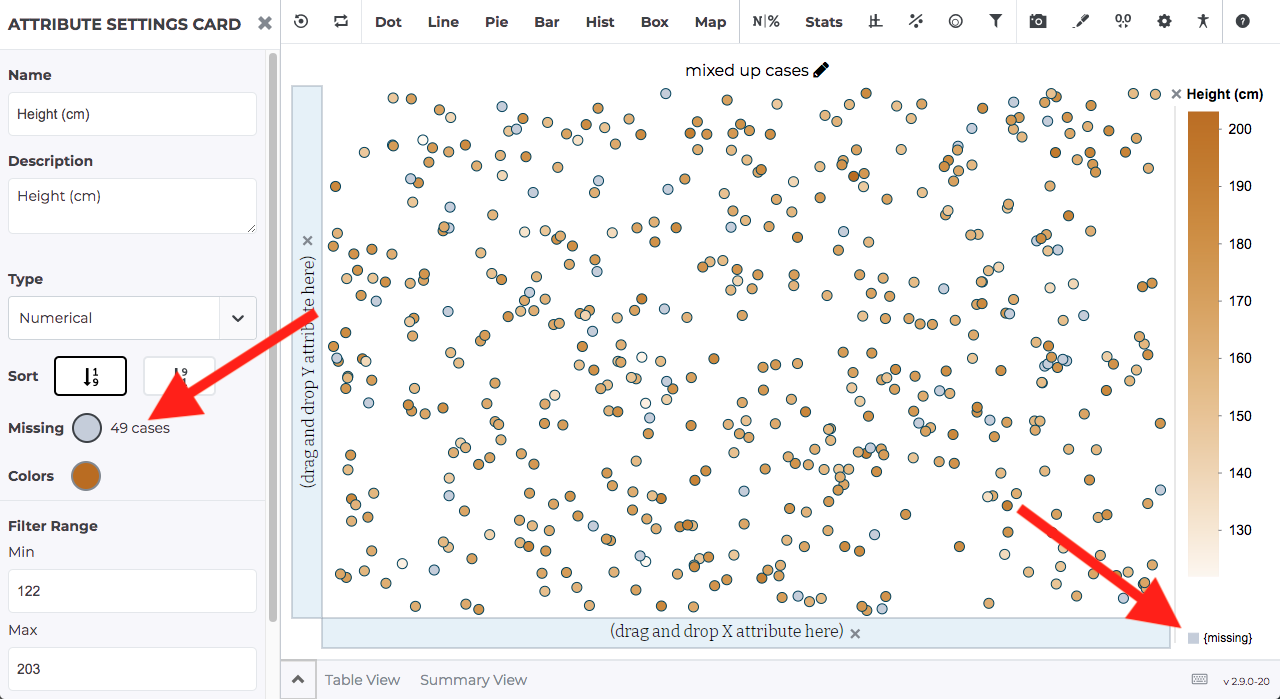
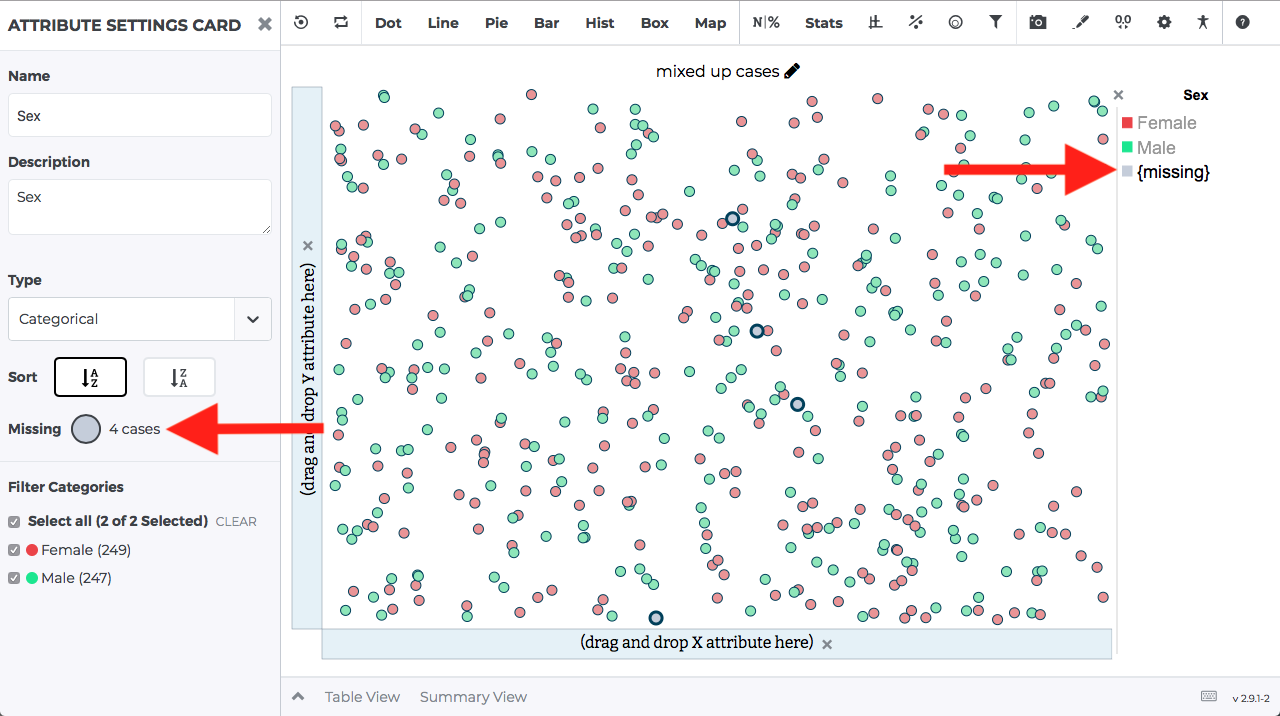
- Improved Missing-Cases Accessibility: Tabbing through the numerical and categorical case cards now allows interaction with the missing-cases color, and screen readers correctly announce the missing-cases information.
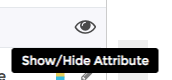
- Accessible More Options Menu: The More Options dropdown menu now includes both a visible label and an aria-label.
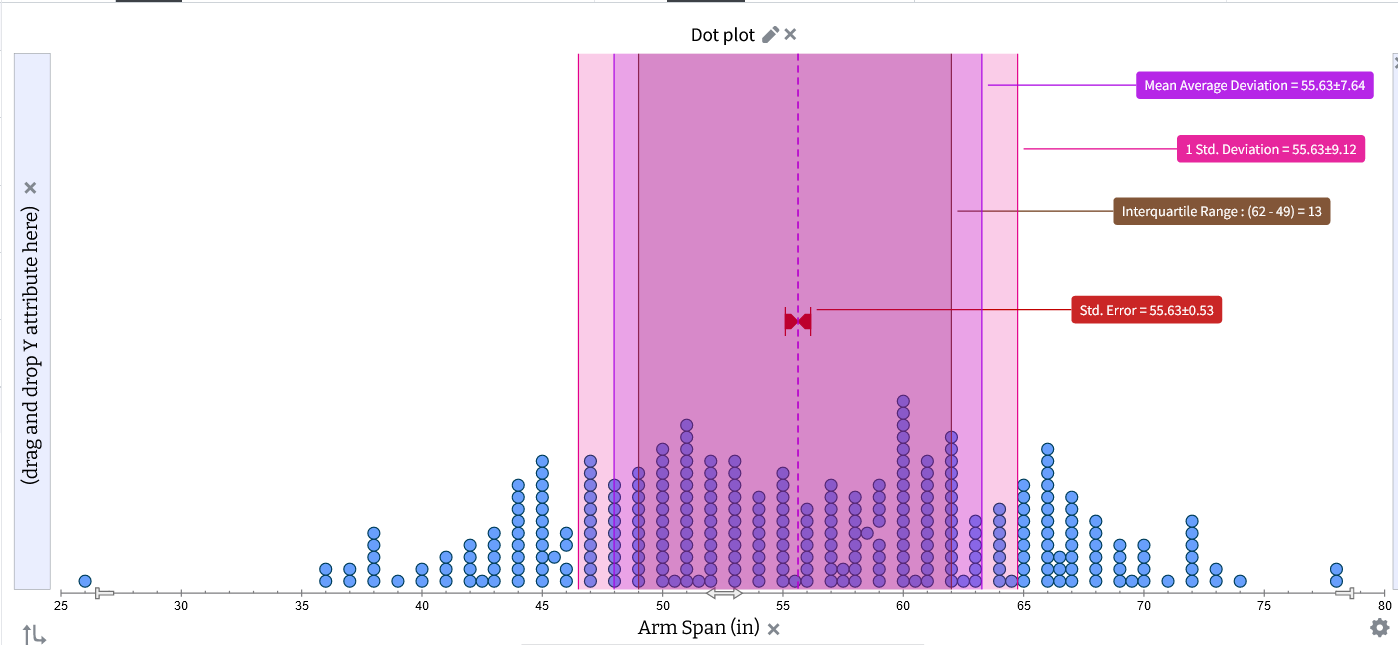
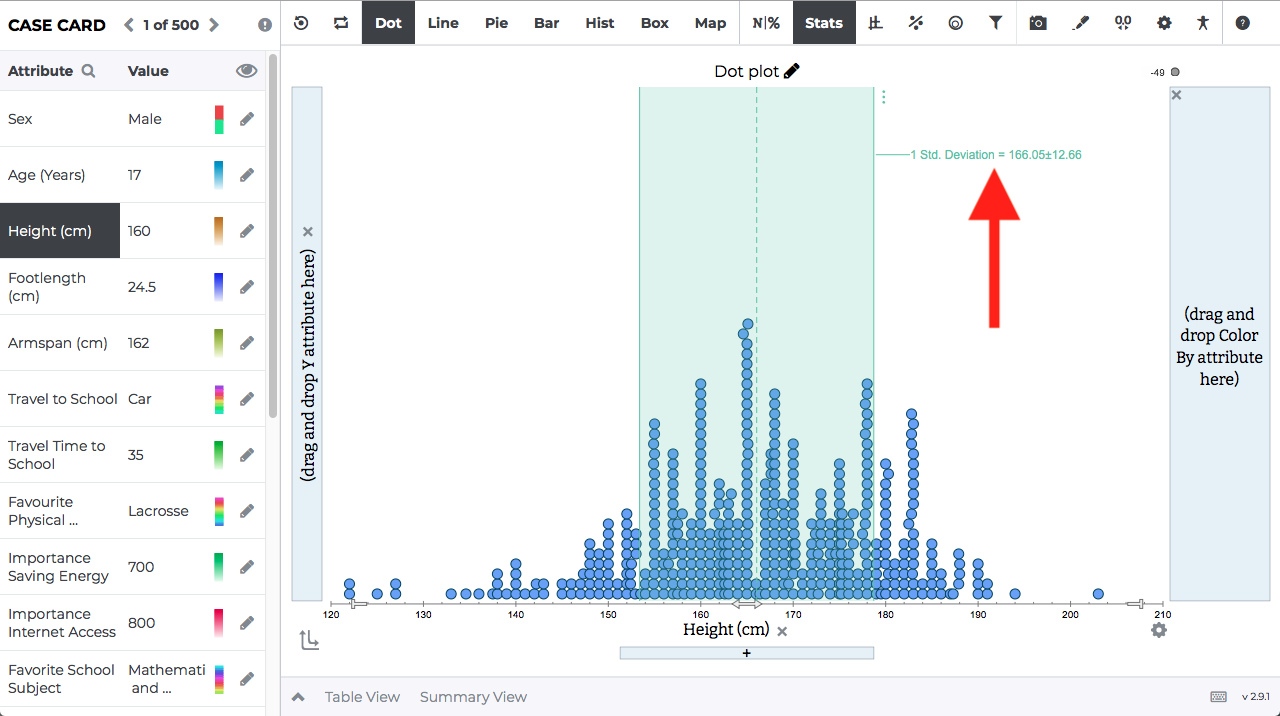
- Focusable Statistical Labels: Stat labels for Movable Line, Mean/Std Error, Model Functions, and Least Squares Regression Lines are now fully focusable and keyboard-navigable.
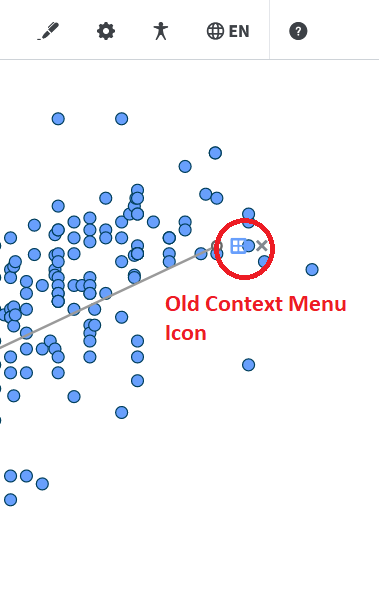
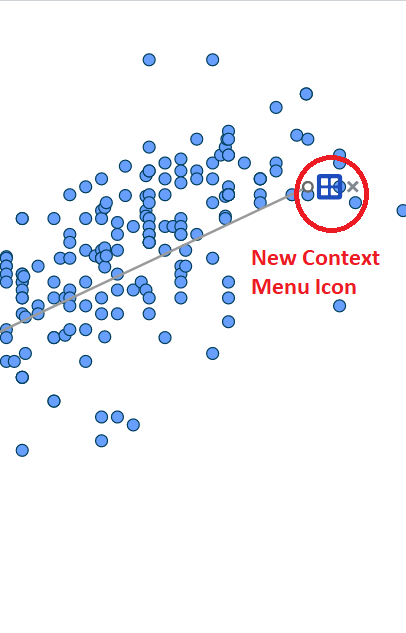
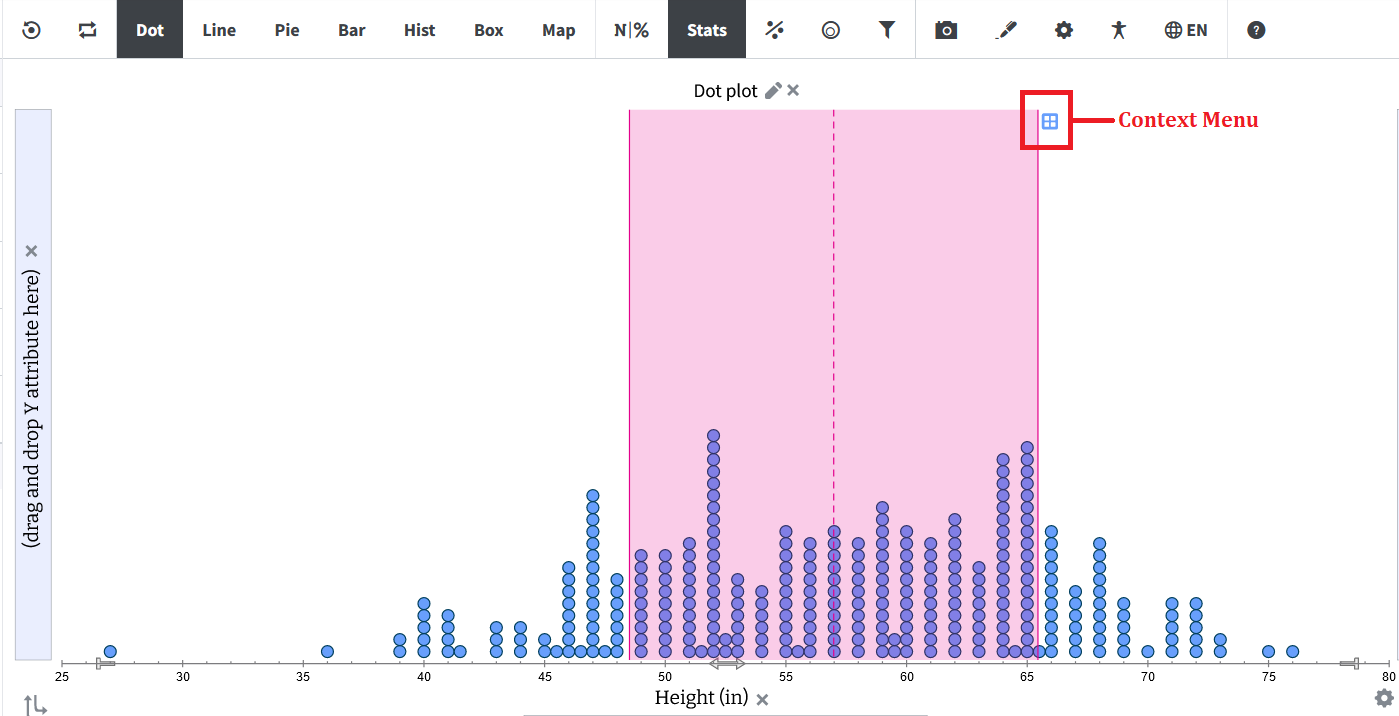
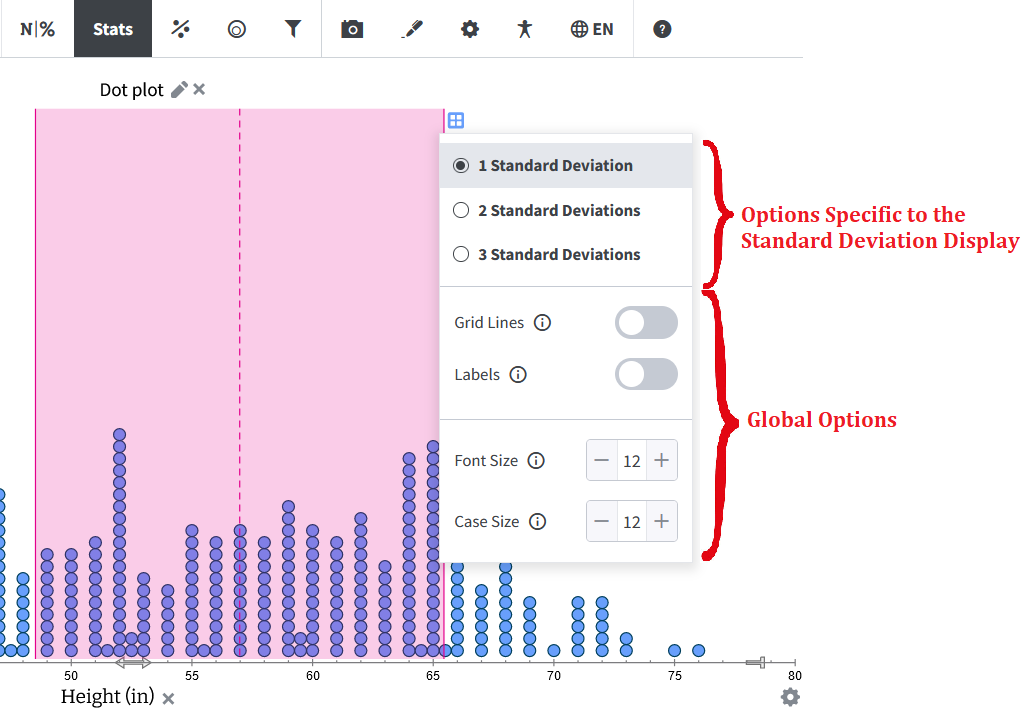
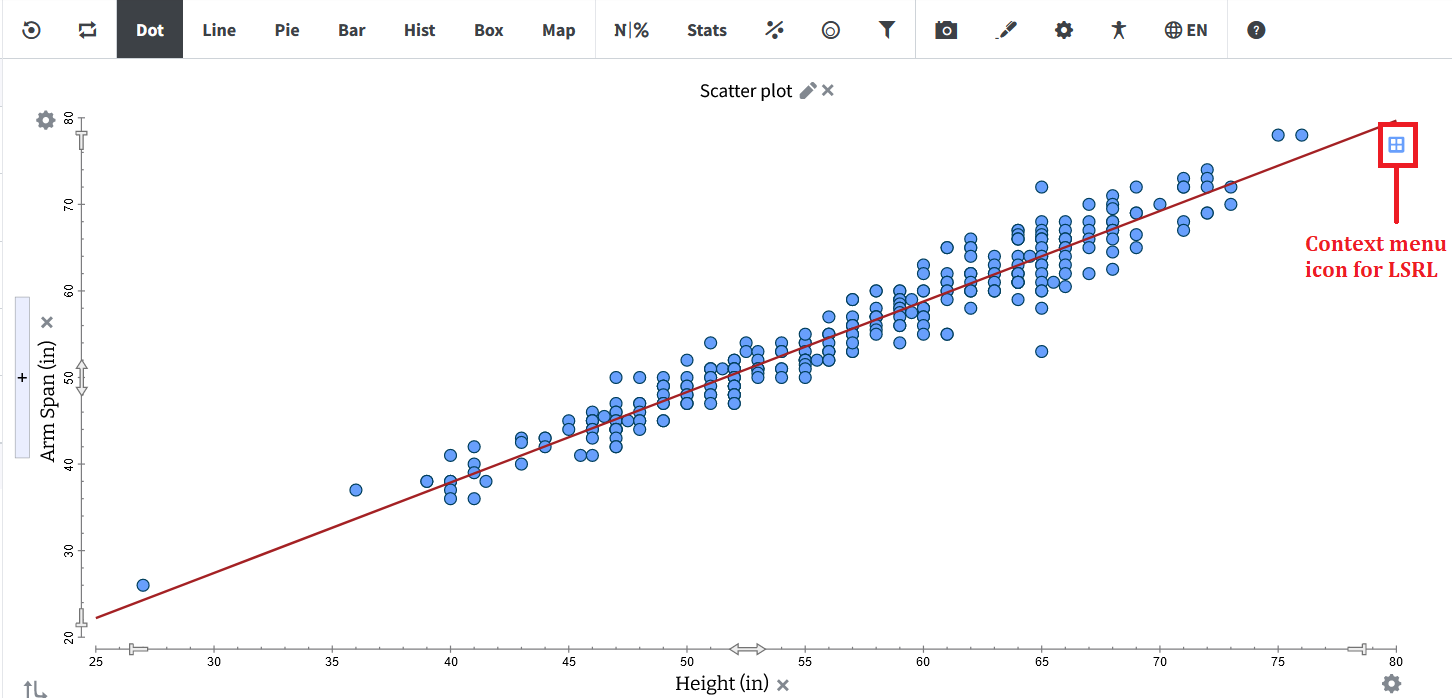
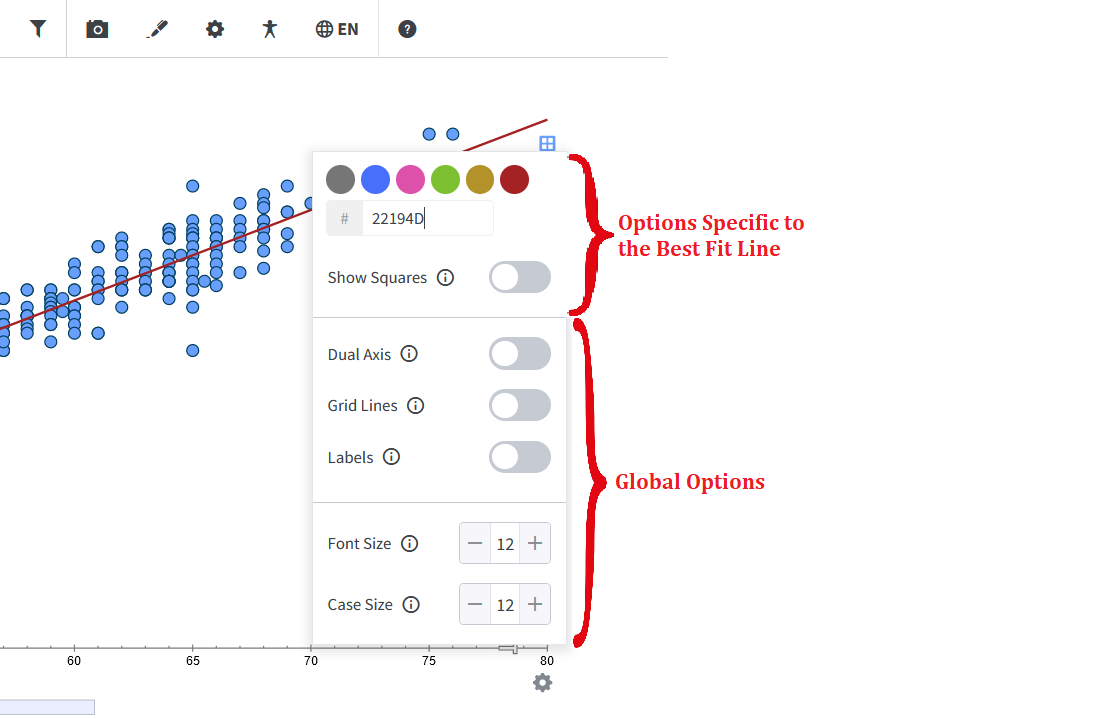
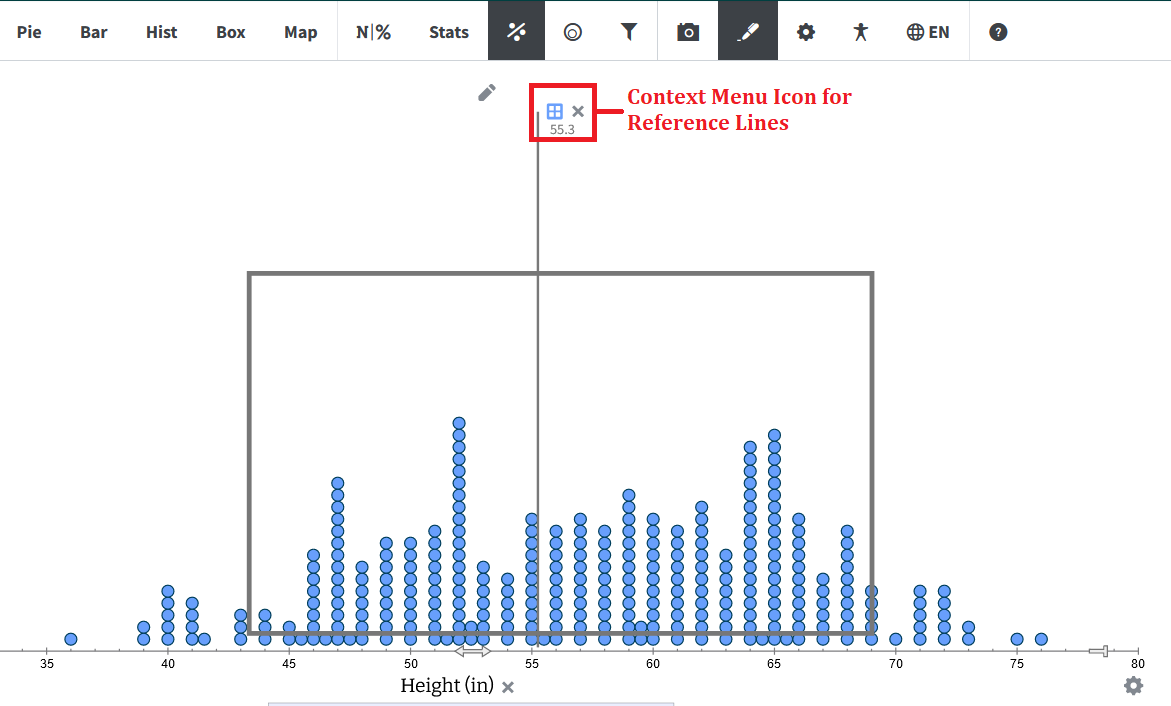
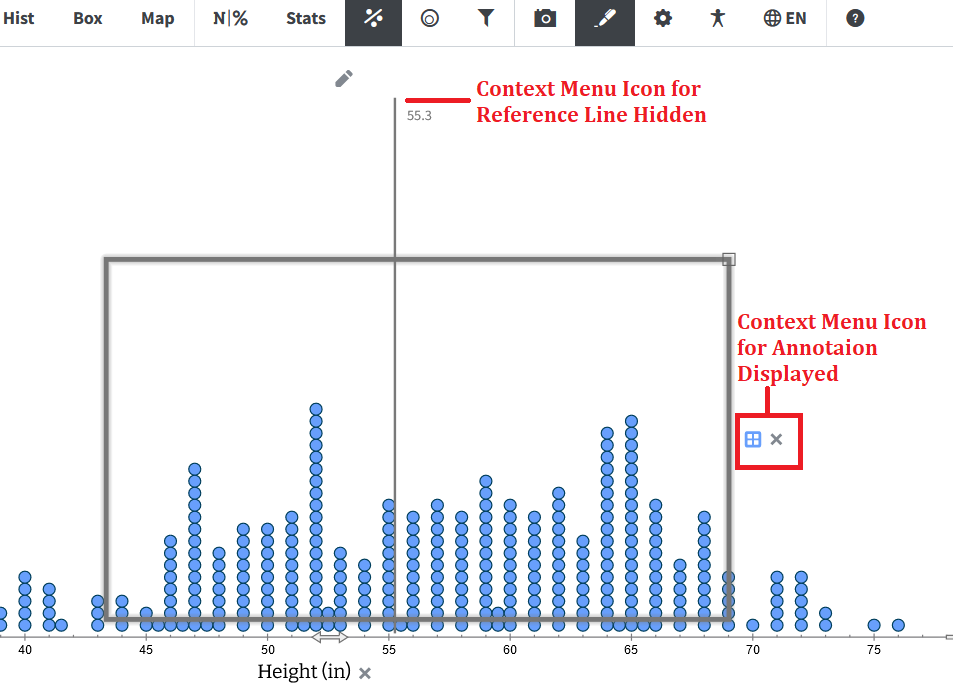
- Keyboard-Friendly Context Menu: Users can now open the context menu with the keyboard (pressing Enter on the context-menu icon), and focus correctly moves to the menu, ensuring full accessibility.
Bug Fixes
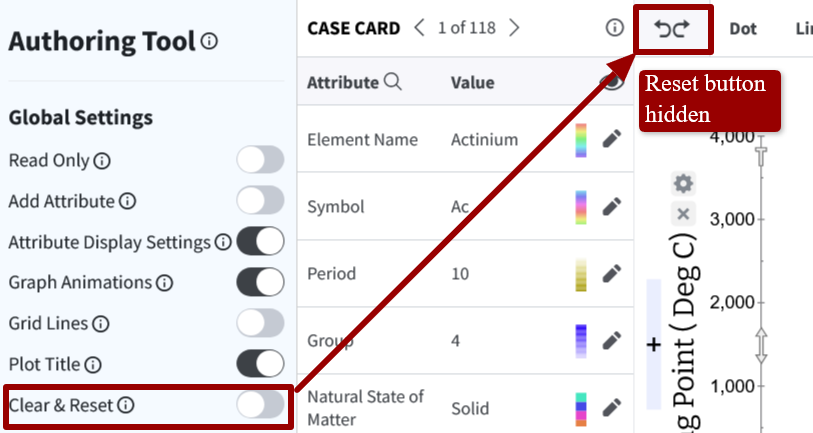
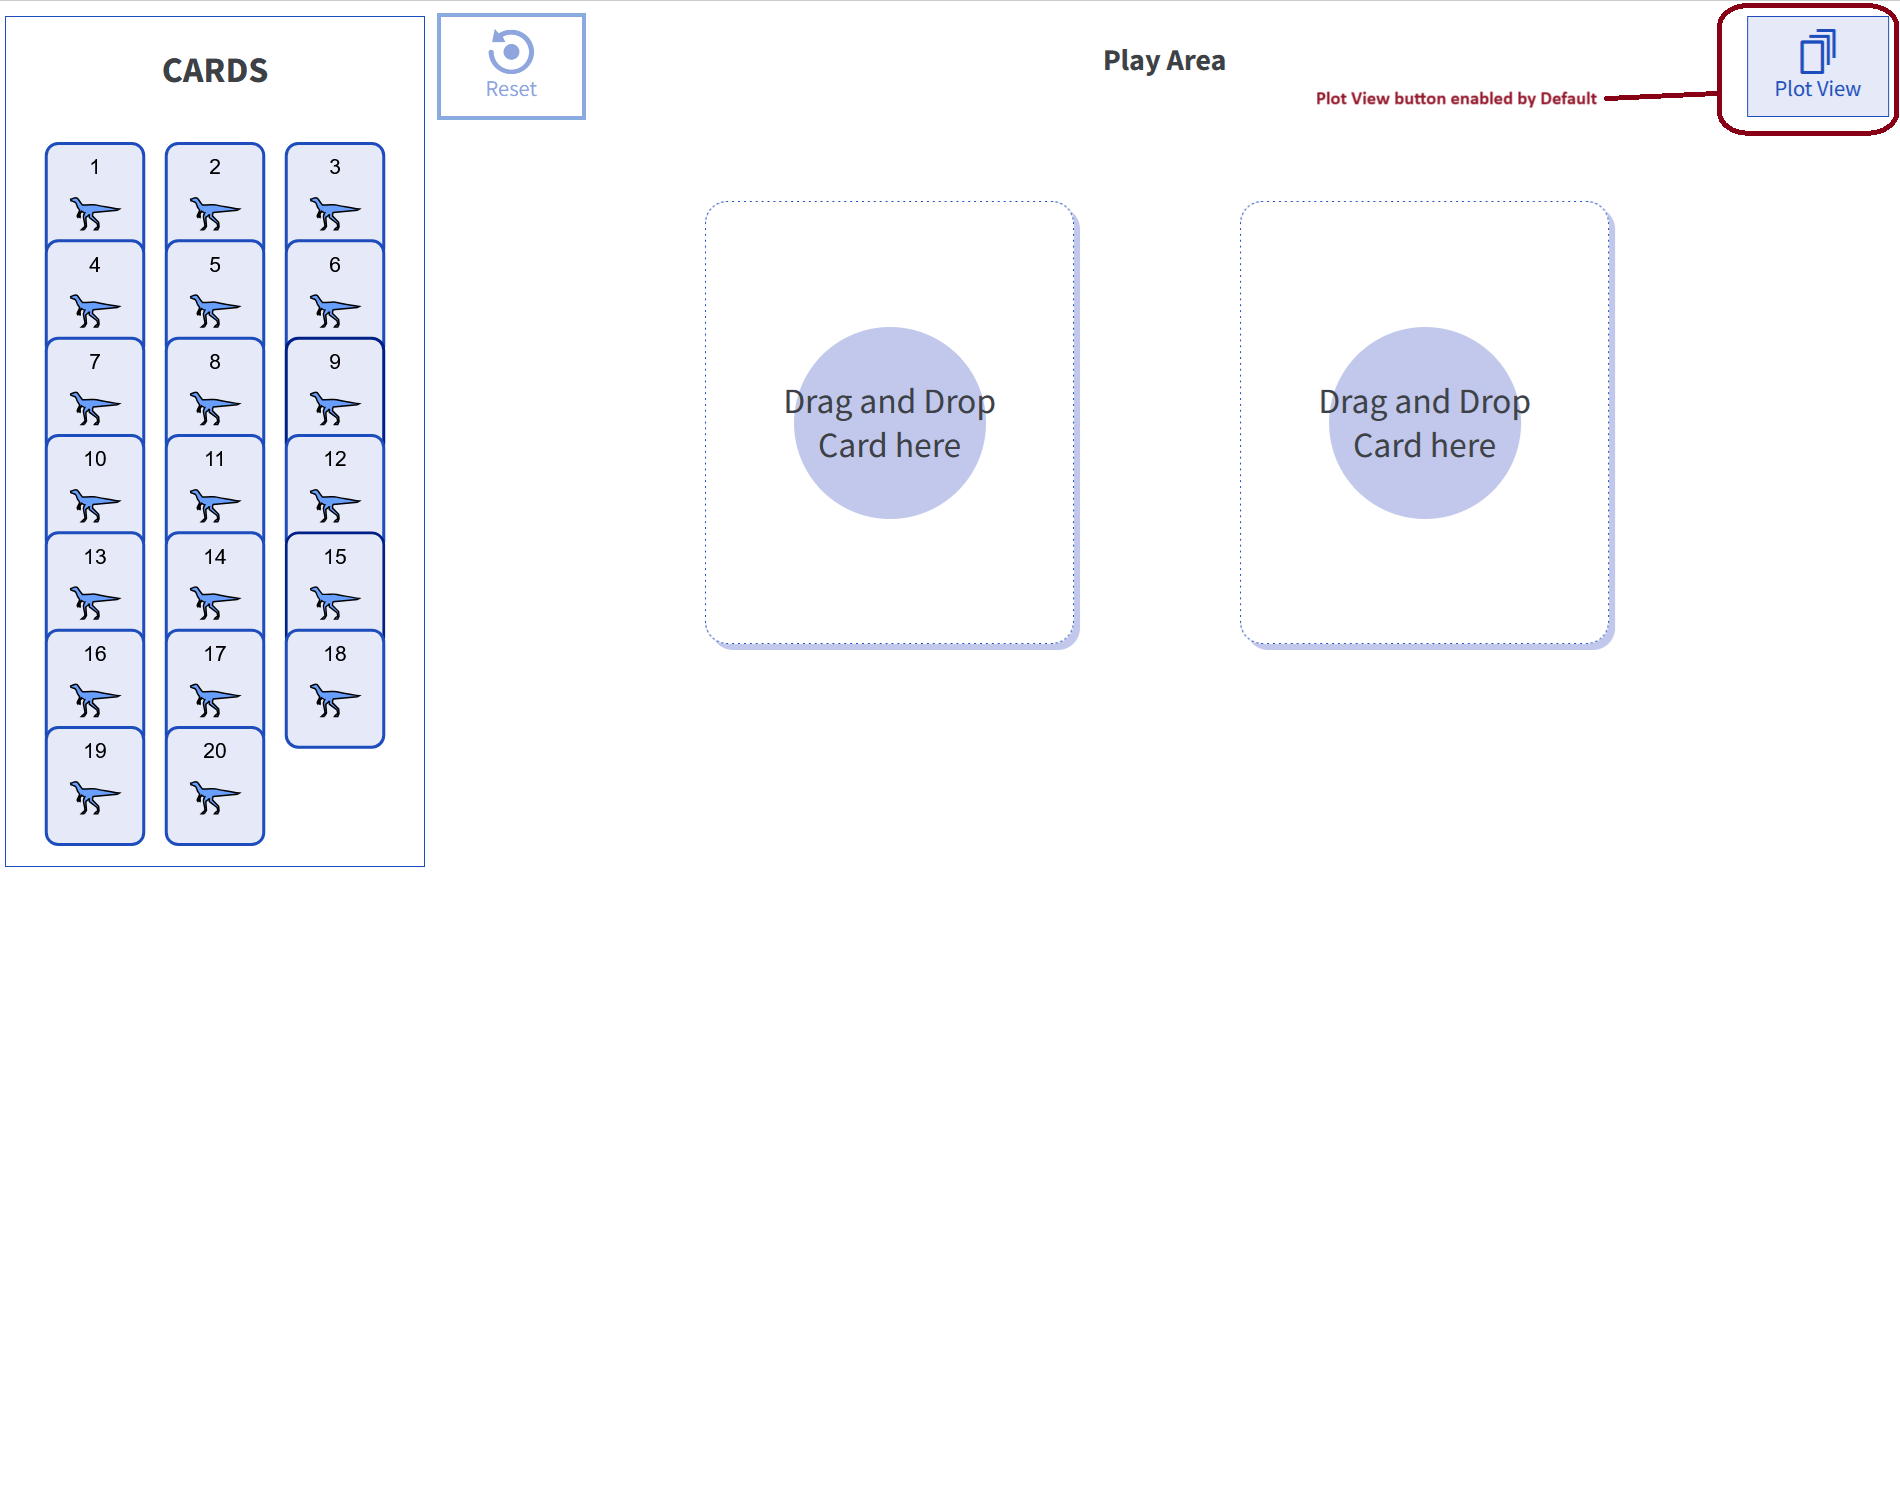
- Fixed Reload Plot Button Disappearing in Tuva Jr.:
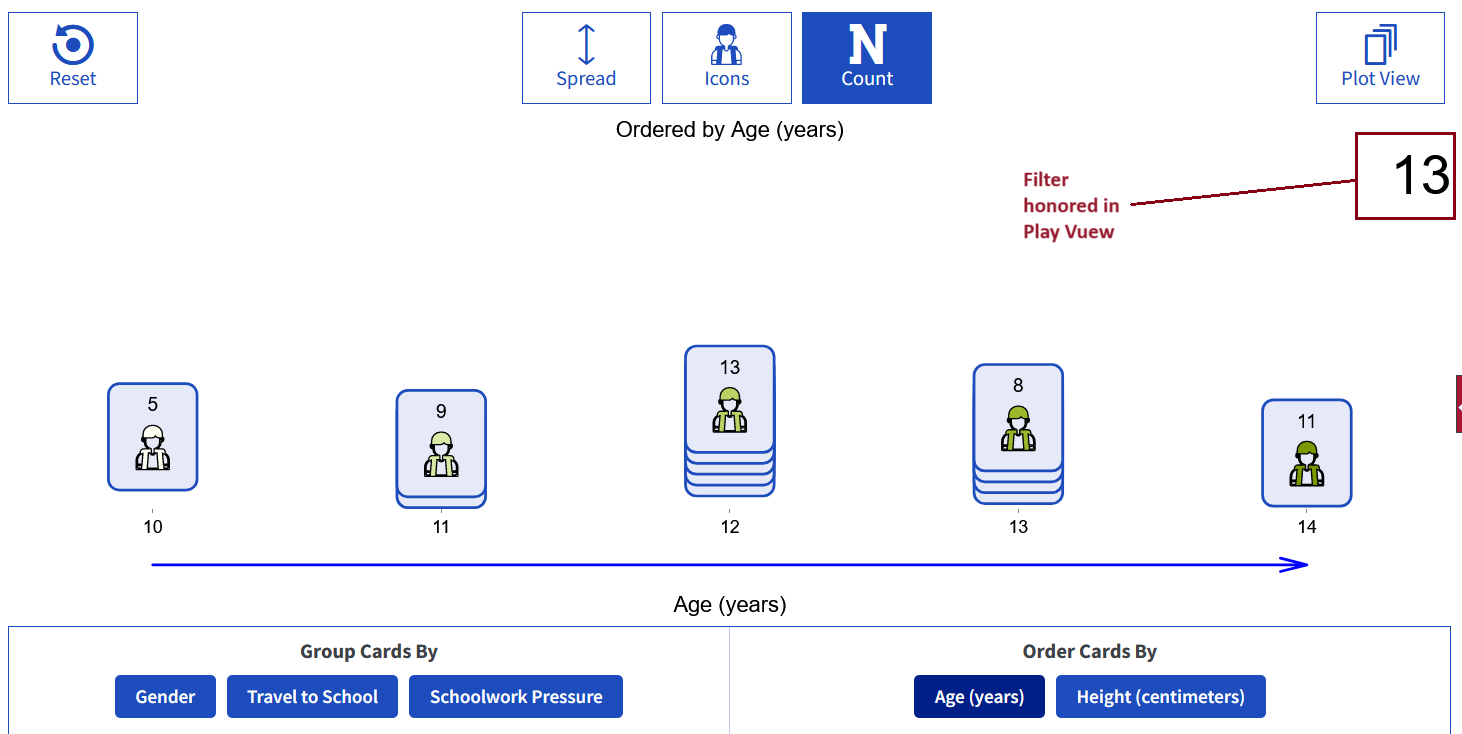
Resolved an issue where the Reload Plot button disappeared after switching from Plot View to Play View and back when working with saved plot states. The button now remains visible, and users no longer need to perform a hard refresh to restore the original plot state.
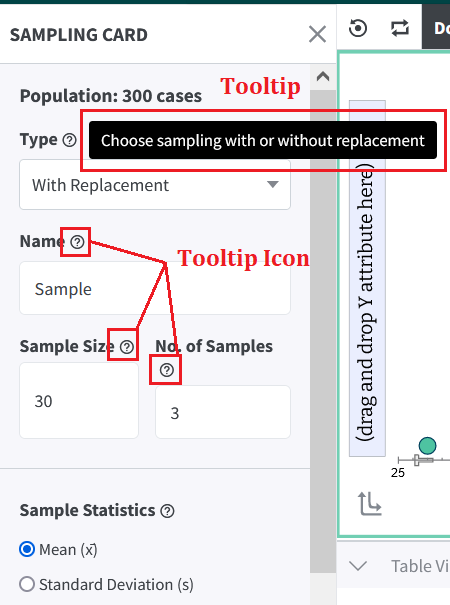
- Fixed MathJax Italicization in Tooltips:
Resolved an issue where text inside tooltips became italicized when attribute names contained single dollar signs. MathJax now correctly handles dollar symbols in attribute labels, and tooltip text no longer renders unintended italics.
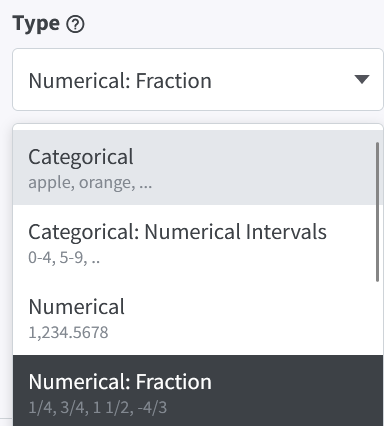
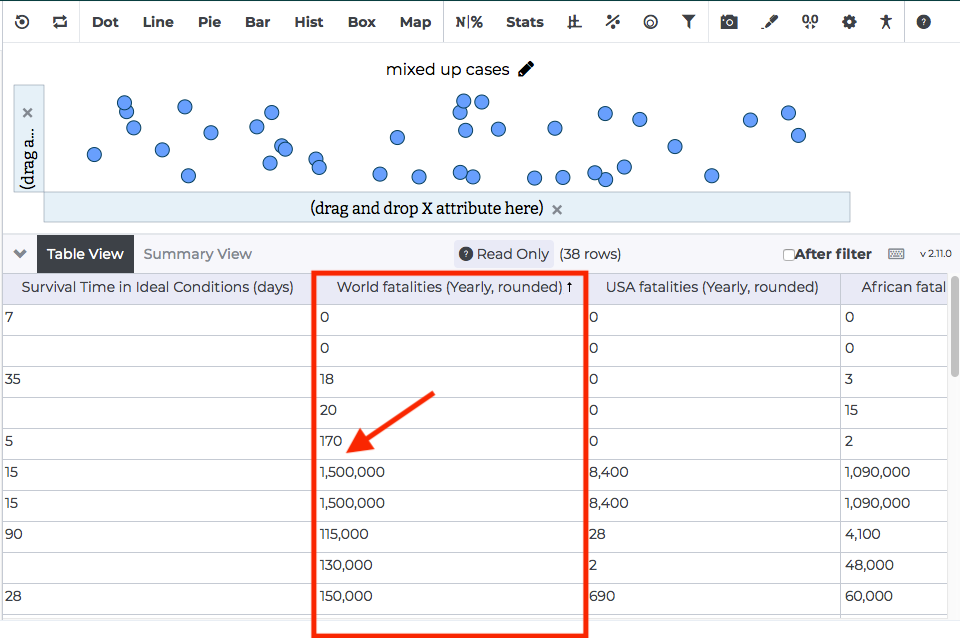
- Fixed Excess Trailing Zeros in Numeric Intervals: Resolved an issue where converting numerical data to categorical intervals generated labels with unnecessary trailing zeros in charts. Interval labels now display consistent and appropriate precision without extra zeros.
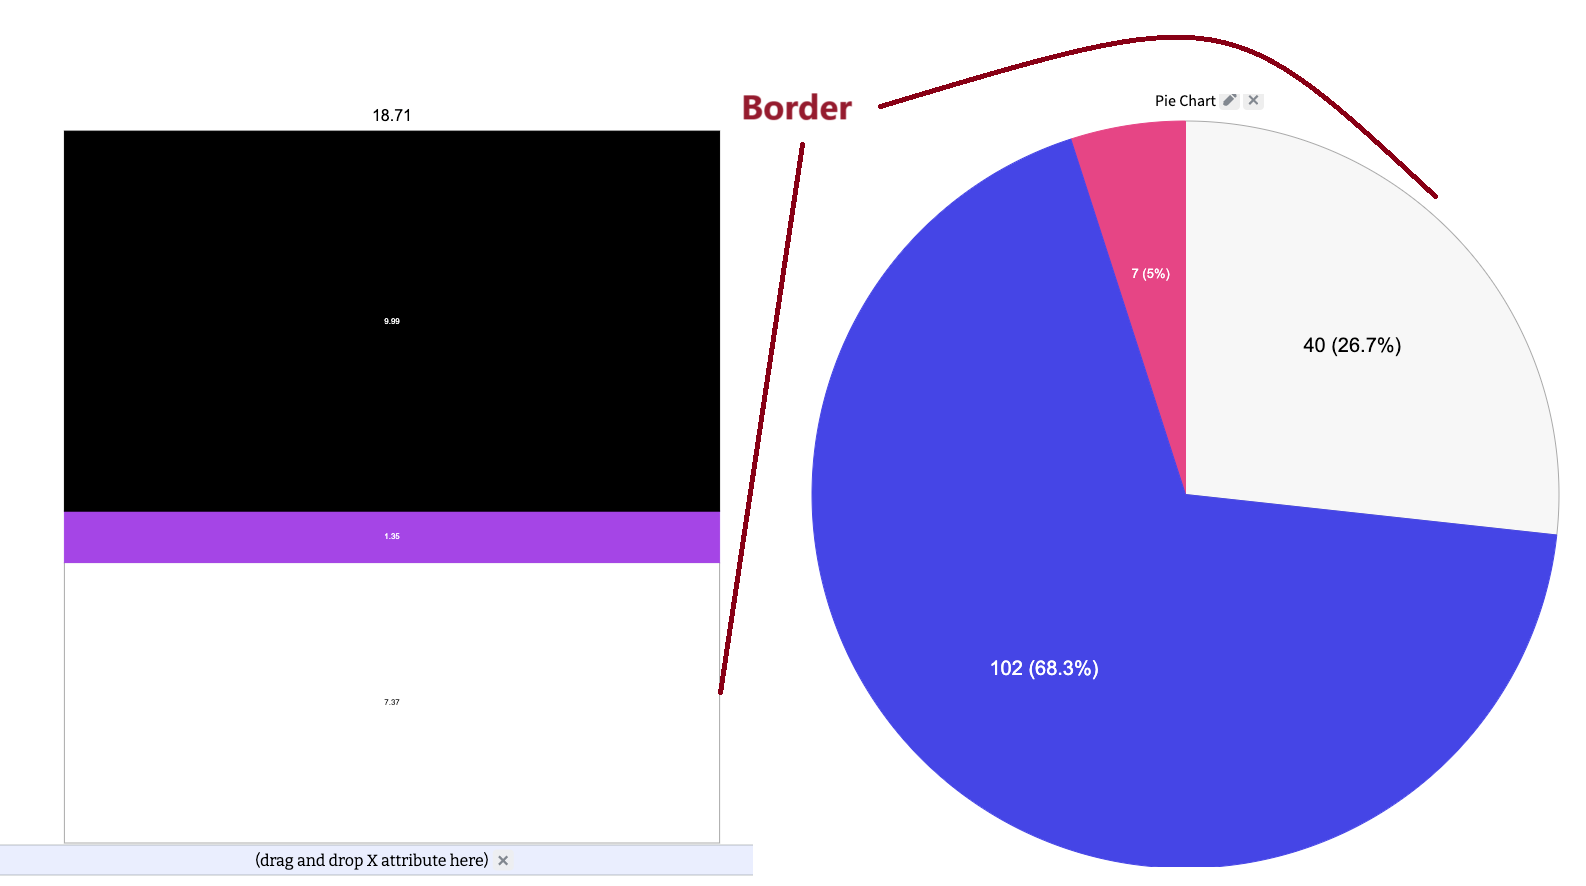
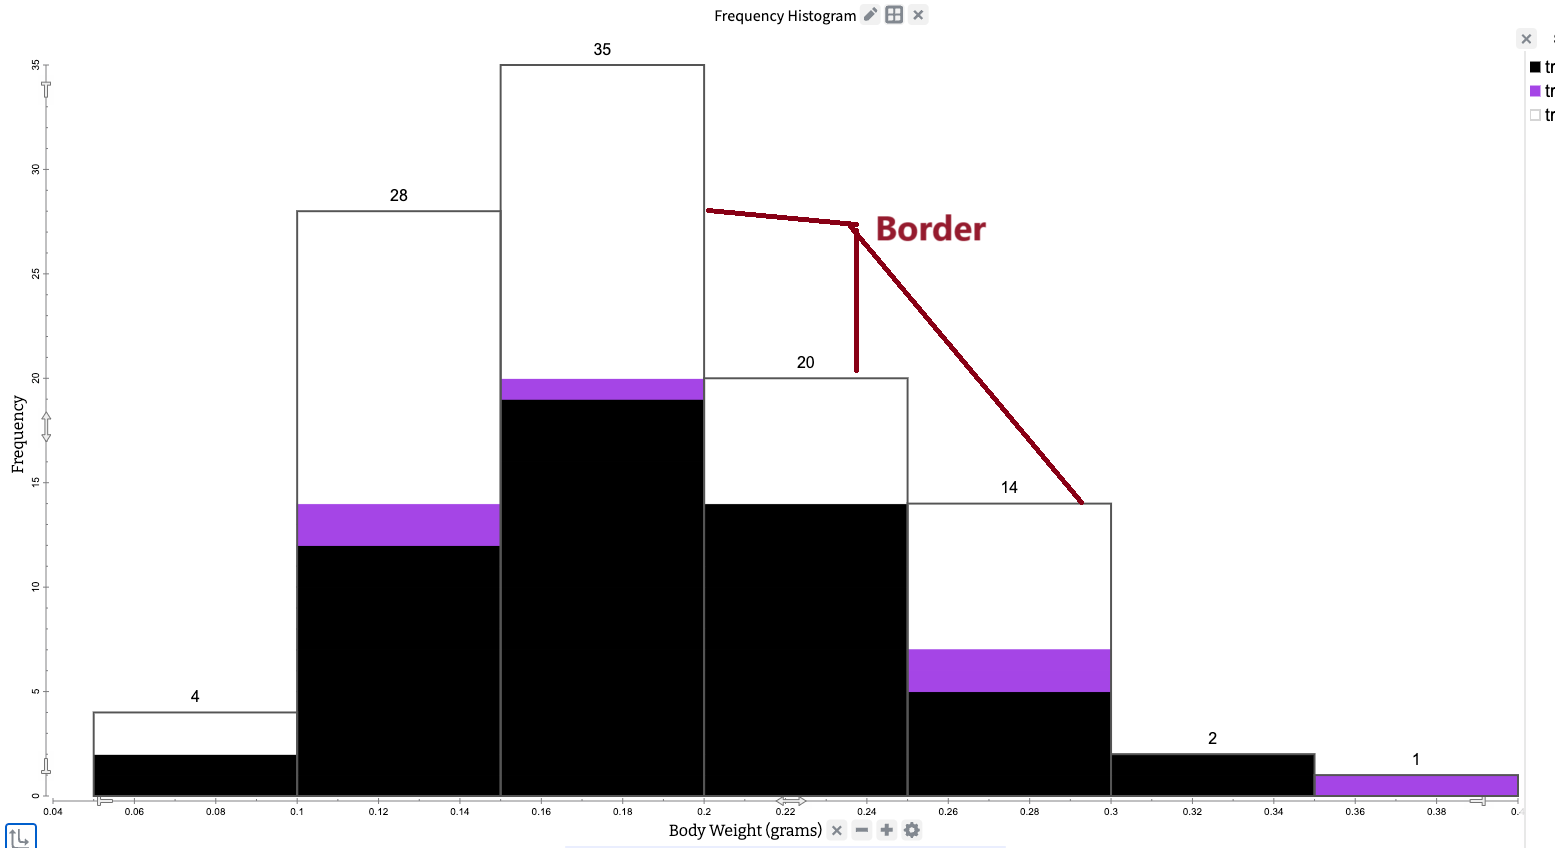
- Fixed Safari Focus Border Rendering: Addressed an issue where keyboard focus borders did not render fully in Safari, particularly on annotations and other plot elements. Focus outlines now display consistently across browsers, ensuring clear and complete visual feedback when navigating with the keyboard.
- Restored Plot Tabbing and Focus Behavior: Fixed an issue where tabbing through cases would prematurely shift focus to the table after a few items. Shift+P now correctly focuses the plot background, the focus rectangle displays consistently across browsers, and visible plot cases can be tabbed through as expected. The background rectangle also now serves as the screen-reader anchor for the plot summary.